View Coordination Architecture for Information Visualisation
Tim Pattison
Matthew Phillips
Information Technology Division Defence Science & Technology Organisation P.O. Box 1500, Edinburgh, South Australia 5111
Email:{Tim.Pattison,Matthew.Phillips}@dsto.defence.gov.au
Abstract
A view is a particular visual representation of a data set. Com-plex data sets typically require multiple views, each revealing a different aspect of the data. Coordinating the behaviour of these views is known to expedite tasks such as information seeking, and has been used to facilitate the exploration of large and complex data sets. The design and implementation of mul-tiple view coordinations is challenging; poorly designed coordi-nations may in fact detract from task performance, while the failure to make coordinations apparent could lead to unnec-cessarily complex mental models of a data set. In order to facilitate the exploration of this design space, we present here an architecture for the implementation of view coordinations. In contrast with many existing tools and prototypes, which fo-cus on specific view coordination techniques, this architecture provides generic support for view coordination. The implemen-tation of several standard coordination techniques within the architecture are discussed by way of illustration, and the ar-chitecture compared with the Snap view coordination architec-ture. Examples of its initial implementation within the InVi-sion component-based framework for information visualisation are also presented.
Keywords: Multiple window coordination, view coor-dination, software architecture.
1 Introduction
Information visualisation permits the interactive ex-ploration of potentially large volumes of abstract, multi-dimensional data. Of the many different view types and information visualisation techniques re-ported in the literature (see e.g. [Chi, 2000]), each is typically suited to a subset of both the visuali-sation tasks a user might need to perform, and the data types present in a heterogeneous data set [Shnei-derman, 1996]. Different views are therefore fre-quently used to present complementary aspects of the data. Multiple views are often also required for multi-dimensional data, for which there may be in-sufficient independent display “dimensions”, such as colour, shape and spatial position, to simultaneously represent all aspects of the data. Even if the dimen-sionality of the display does suffice, the cognitive over-head of interpreting a single complex view can out-weigh the effort required to manage multiple simple views [Baldonado et al., 2000].
Care must be taken in the design ofmultiple view systems to minimise the burden of additional inter-action and context switching by the user [Baldonado
Copyright c2001, Commonwealth of Australia. This paper ap-peared at the Australian Symposium on Information Visualisa-tion, Sydney, December 2001. Conferences in Research and Prac-tice in Information Technology, Vol. 9. Peter Eades and Tim Pat-tison, Eds. Reproduction for academic, not-for profit purposes permitted provided this text is included.
et al., 2000]. This burden can be substantially re-duced by coordinating the content, appearance and behaviour of the views in various ways [North and Shneiderman, 1997]. In a web page editing appli-cation, for example, automatically synchronising the scrolling of windows showing the HTML markup and its rendering in a web browser can save the author both time and distraction from task [North and Shnei-derman, 1997]. Similarly, an experiment comparing user performance with and without coordination be-tween overview and detail views showed that this form of coordination offered significant speed-ups for infor-mation seeking tasks [North and Shneiderman, 1997]. An important application of information visuali-sation is the crystallivisuali-sation of knowledge from data [Card et al., 1999]. Among the steps of the knowl-edge crystallisation process is not only information foraging, but also the search for a more suitable data schema which is consistent with the data, tailored to the task(s) at hand, and as simple or compact as pos-sible. Sets of views which fail to make evident the re-lationships between their respective contents, or the presentation thereof, will be interpreted by the user as portraying independent aspects of the underlying data set. In subsequent iterations of the knowledge crystallisation process (not dealt with here) these as-pects must then be independently accommodated in an unnecessarily complex data schema.
Clearly, then, the goal of simplification requires that relationships between views be made appar-ent through appropriate perceptual cues, a princi-ple known as the “Rule of Self-Evidence” [Baldonado et al., 2000]. This can be achieved either implicitly, through coordinated appearance or behaviour, or ex-plicitly through visual or other cues, such as lines link-ing the windows hostlink-ing the coordinated views. As an example of an implicit technique, “[...] ubiquitous coordinated painting reinforces the underlying con-nections between graphical objects representing the same elements” [Kolojejchick et al., 1997]. Similarly, the juxtaposition of a tooltip view, providing details on demand, with the corresponding element in the parent view is used as an implicit visual indication of the relationship between them.
There are a number of well-recognised multiple window coordination[Shneiderman, 1998] techniques, including navigational slaving, brushing and linking, and details on demand. Whilst it has been argued that many of these can be viewed as specific forms of coordination between selection and navigation ac-tions [North and Shneiderman, 2000, North, 2000], there are other potentially useful forms of coordina-tion which are not covered by this model. For ex-ample, the concept of brushing and linking can be extended beyond the selection action, such that the appearance of corresponding data elements is per-manently linked across views. Such linking accords with the principle ofleast effective difference [Tufte, 1997], reducing the cognitive effort required to switch
between views by visually reinforcing the connection between corresponding graphical elements. The cou-pling of this and other aspects of view appearance, such as element layout, across views is clearly not cov-ered by a taxonomy [North and Shneiderman, 1997] which considers only selection and navigation actions. Snap [North and Shneiderman, 2000] limits con-sideration to the coordination of actions on views of relational data. Based on join operations, Snap’s “advanced coordination is simply a data relationship representation problem, rather than a custom user-interface programming problem.” This elegant ap-proach greatly simplifies the design of the user inter-face through which users specify the required coordi-nations. However, a large range of potentially use-ful view coordinations cannot be implemented solely through data-centric coordination mechanisms. For example, with the exception of coordinated selection, linking the appearance of graphical elements corre-sponding to the same or related data elements, or the layout of collections of these elements, is not accom-modated. Similarly, coordinated geometric zooming and panning (see e.g. [Olston and Woodruff, 2000]) of pairs of views of the same type, such as charts or maps, is excluded, as is the linking of any trans-formations applied to the data in preparation for its visualisation, such as sorting, averaging or clustering. This paper presents a component architecture which provides generic support for these and other forms of view coordination in information visualisa-tion. The paper is organised as follows. In Section 2 we present a component-based software architecture for the specification, construction and presentation of views. In Section 3 we overlay a proposed architecture for view coordination. Examples of the implementa-tion of parts of this architecture within the InVision component-based software framework for information visualisation [Pattison et al., 2001a] are presented in Section 4. The architecture is compared with related work in Section 5.
2 View architecture
The benefits of the Model-View-Controller (MVC) software pattern [Krasner and Pope, 1988, Gamma et al., 1994] for visualisation are well established. Principal among these is the ability to produce mul-tiple views on the same data model, such as ball-and-stick and space-filling views of the molecular struc-ture of a protein [Sayle and Milner-White, 1995]. In this section we present an architecture for the imple-mentation of the Model and View components in the MVC pattern. In Section 3, the implications and ben-efits of this architecture for the flexible coordination of multiple views are discussed.
A common requirement in visualisation systems is abstraction of the view to be rendered from the graph-ics hardware and software platform on which it will be rendered, and through which a user will interact with it. This abstraction provides for portability of the view across, and its simultaneous display on, mul-tiple graphics platforms. The Virtual Reality Markup Language (VRML) provides this form of abstraction for the rendering of 3D scenes. The visual information at this level is abstracted in terms of geometric shapes and colours, textures, etc, and is thus independent of the display technique used to render it.
Separation of the responsibilities of the observer from those of the scene being observed is a second application of the MVC software pattern. This sepa-ration allows the same 3D scene model, for example, to be observed simultaneously from different angles, at different zoom levels, or indeed not as a 3D ren-dering at all, such as a table of visual objects and their properties. The separation of responsibilities
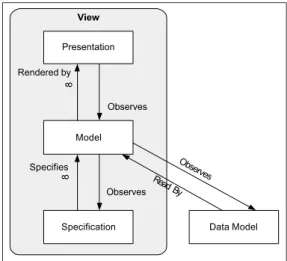
for both presentation and rendering of the view from its abstract representation is addressed in the archi-tecture of Figure 1 through the use of Presentation and Model components respectively.
View
Presentation
Model
Specification Data Model Observes Read By Observes Specifies Observes Rendered by 8 8
Figure 1: The proposed view architecture. The Model component is responsible for mapping the data into a view model, which is an abstract rep-resentation of the “scene” to be rendered. In the case of 3D visualisation, this view model is equivalent to a scene description. Whereas in other forms of visuali-sation the geometry of the scene is pre-specified, the choice or design of a suitable mapping of abstract data into 2D or 3D “scenes” is a major challenge in infor-mation visualisation techniques. The abstract data to be visualised is provided in structured form by the Data Model component, which hides the details of data pre-processing, persistence and querying mech-anisms.
A novel feature of the visualisation architecture presented in Figure 1 is the separation of responsi-bilities for the specification and implementation of the mapping from data model to view model. The Model component builds the view model according to the mapping specified by, and customised through, the Specification component. The view model can be optionally saved to preserve it, for the purpose of subsequent user exploration, from future changes in the underlying data model from which it was con-structed. But unless there is a specific requirement for such a snapshot, persistence of the view specifi-cation provides not only more efficient storage, but also portability to other data sets having the same meta-structure.
Using the Observer software pattern [Gamma et al., 1994], each Presentation component in the architecture of Figure 1 observes the corresponding Model component for changes and updates its dis-play accordingly.1 The Model component in turn ob-serves both the Specification and Data Model com-ponents for changes. This pattern of observations en-sures that changes in the view specification or the underlying data are propagated to the Presentation component(s). These changes occur through a vari-ety of mechanisms, including user customisation of the view specification via a user interface provided by the Specification component, and updates to the data model being visualised.
A single view model can have multiple presenta-tions, and multiple views can be associated with a single data model. This arrangement leads to im-plicit coordination between the Presentation
compo-1Other interactions between Presentation, Model and
nents corresponding to the same Model component, and between views on the same data model. Between the view model and view specification, on the other hand, there is a one-to-one correspondence.
Views on the same data model will have overlap-ping requirements for preparatory data transforma-tions such as filtering and analysis. Reuse of the re-sults of these transformations is therefore facilitated by the insertion of one or more Transform components (not shown in Figure 1) between the Data Model and Model components. A Transform component presents to the Model component the same interface as the Data Model component, and expects this same inter-face from the Data Model or Transform component which precedes it in the data processing pipeline. 2.1 Visualisation Reference Models
Several visualisation reference models have charac-terised the data pipeline required to produce a visu-alisation from raw data. In this section, we relate the roles of the components of the architecture in Figure 1 to two of these: Haber & McNabb’s filter-map-render reference model [Haber and McNabb, 1990] and the Data State Reference Model [Chi, 2000].
Although designed specifically for scientific data visualisation, the filter-mrender model can be ap-plied with slight generalisation to the field of informa-tion visualisainforma-tion. The Data Model component in our architecture, along with any Transform components, performs much of the generic data preparation nor-mally attributed to the “filter” stage of the pipeline. The Model component performs any data processing and filtering which is specific to the type of view being prepared, as well as implementing the “map” stage of the filter-map-render pipeline. In Haber & McNabb’s reference model, the “map” stage maps the data into an “Abstract Visualisation Object” [Haber and McN-abb, 1990], which is the analogue of our view model. The “render” stage is the responsibility of the Pre-sentation component.
The Data Model component of the architecture in Figure 1 encapsulates the Value stage of the Data State Reference Model [Chi, 2000], implements the Data Transformation processing step, and provides Analytical Abstractions. Transform components, if any, implement additional Within Analytic Abstrac-tion operators. The Model and SpecificaAbstrac-tion compo-nents collectively encapsulate the Visualization Ab-straction stage and part of the View stage, and perform and specify, respectively, the Visualization Transformation and Visual Mapping Transformation processing steps. The remainder of the View stage is implemented by the Presentation component. Unlike the proposed architecture, the Data State Reference Model does not appear to distinguish between the abstract view model, the generation of different per-spectives on that model or scene, and the rendering of those perspectives.
3 View coordination architecture
In this section, we describe a multiple view coordina-tion2 architecture which builds on the foundation of the view architecture described in the previous sec-tion. Our description starts with an exposition of the salient features of the view coordination architecture and their rationale, and outlines the potential imple-mentation of several well-known coordination tech-niques.
2Since the required coordination is between views, regardless
of whether they are hosted by the same or different windows, we henceforth use the termmultiple view coordination instead of “multiple window coordination”.
In the view coordination architecture depicted in Figure 2, coordination between views is mediated by coordination components which look for state changes in an observed view and trigger resultant changes in a dependent view. Coordination components en-capsulate functionality which relates specifically to the coupling between views, such as the join oper-ations required in Snap. They are implemented as unprivileged “clients” of the view components, and are plugged in as needed. The specification of a view coordination requires at a minimum the nomination of:
• the view to be observed by the coordination com-ponent;
• the type of change in this view which should trig-ger the coordination;
• the target view;
• the reaction of the target view to the trigger. The observed change and the assigned reaction need not be identical; a selection change in one view might for example cause a navigation reaction in another.
Composite coordinations between views, such as reciprocal or chained coordinations [Baldonado et al., 2000], can be implemented as a set of directional co-ordinations. In composite coordinations, a given view may play the role of an observed view in one direc-tional coordination and a dependent view in another. Directional coordinations could also be marshalled to implement more complex coordinations, such as those with two or more observed or dependent views.
A number of common coordination techniques re-quire only coordination between corresponding com-ponents. For example, brushing and linking [Ward, 1994] can be implemented as coordination between Model components, while navigational slaving [North and Shneiderman, 1997] of 3D scene browsers requires only coordination between Presentation components. Novel forms of coordination, such as slaving between the view specifications of two views, also arise from the introduction of a Specification component in the view architecture in Figure 1. View specification slav-ing allows changes in the specification of visual at-tributes, such as colour and shape, of graphical ob-jects in the observed view to be coupled to corre-sponding changes in the dependent view.
Clearly, the greater the diversity of view compo-nents with which a coordination component must in-teract, the more complex it is to code and debug. We have seen that a variety of coordinations can be im-plemented by mediation between corresponding view components. It is therefore tempting to simplify the view coordination architecture by mandating or rec-ommending that coordination components mediate
only interactions between corresponding view com-ponents. Before further considering the utility of this proposal, a slight change is required to avoid a signif-icant loss of generality.
To illustrate the required change, consider the im-plementation of a details-on-demand coordination, in which selection in one view, which is handled by its Presentation component, is coordinated with data fil-tering in the second view, which is implemented by its Transform component. Note that it is reasonable for the Presentation component of the first view to trans-late its selected view element set into a corresponding set of selected data model elements, which is main-tained in its model. However, this still requires an interaction between the model of the first view and the transform of the second. The details-on-demand coordination component must therefore mediate co-ordination between the Model component of the first view and the Transform component of the second.
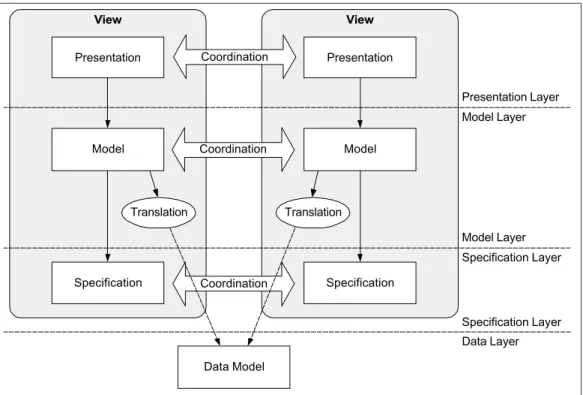
View Presentation Model Specification Data Model Translation View Presentation Model Specification Translation Coordination Coordination Coordination Presentation Layer Model Layer Model Layer Specification Layer Specification Layer Data Layer
Figure 2: The proposed view coordination architecture.
Accordingly, we choose to relax the proposed con-straint from “corresponding” components to “peer” components in the same architectural layer in Fig-ure 2.
Since even this relaxed constraint might rule out potentially useful coordinations, we choose to rec-ommend rather than mandate it. As the detail-on-demand example illustrated, however, complex co-ordinations can be mediated by a combination of peer interactions across views and “downwards” in-teraction between components within the same view, as per the view architecture described in Section 2. Brushing and linking provides a second example of this combination; in addition to coordination between Model components, “downward” propagation of the selection from the Presentation to the Model of the observed view is required. Interestingly, the coordi-nation component in this case must also interact with the Data Model component in order to invoke the join operations which underly the linking functionality in Visage [Derthick et al., 1997,Kolojejchick et al., 1997] and Snap. We further recommend that direct inter-action between coordination components be avoided wherever possible, since adherence to this recommen-dation has the effect of further reducing the types of interactions which must be accommodated by a coor-dination component.
To optimise reuse, view coordinations should be as far as possible independent of the types of views being coordinated. To enable common coordinations between disparate views, the relevant view compo-nents should therefore support a core set of opera-tions, which can be implemented in a semantically consistent way across different views. At a mini-mum, this core set will include various forms of selec-tion and navigaselec-tion [North and Shneiderman, 2000]. Within the navigation category, for example, geomet-ric zoom would be supported within the Presentation layer, while semantic zoom would require Model layer implementation. Additional, view-specific operations might optionally be exposed for use in less generic coordinations.
Each view should make its best effort to sup-port operations in the core set. To illustrate this
point, consider the support of a SetStyleMapping op-eration by the Specification component as part of this core set. This operation facilitates the coordi-nation between views of changes in the mapping of data attributes to visual styles such as colour, shape, transparency and texture. Whereas visualisations of graphs and trees are likely to share many stylistic at-tributes, such as the shape, position, colour and size of nodes, they will have little stylistic overlap with views of a document, which involve paragraph for-matting and font selection. Nevertheless, the coor-dination of graph and document views is useful for simultaneously browsing the structure and content of a web site. Coordination of graph node colour with document background colour, for example, could be used to reinforce their correspondence. The onus is on the designer of the coordination to choose styles which are supported by the target view, since the Specifi-cation component of the target view will necessarily ignore requests to set visual style mappings involving styles which the view does not support. In the case of coordination between the style mappings employed by two or more views, styles such as colour and size which are applicable to many, if not all, types of vi-sualisation are likely to be useful.
4 Towards implementation
The generic approach to view coordination which the architecture presented in Section 3 is designed to sup-port is consistent with the design philosophy of In-Vision [Pattison et al., 2001a], an open, component-based software framework for information visualisa-tion. In this section we present several examples of view coordination currently supported by a partial implementation of the view coordination architecture within the InVision framework.
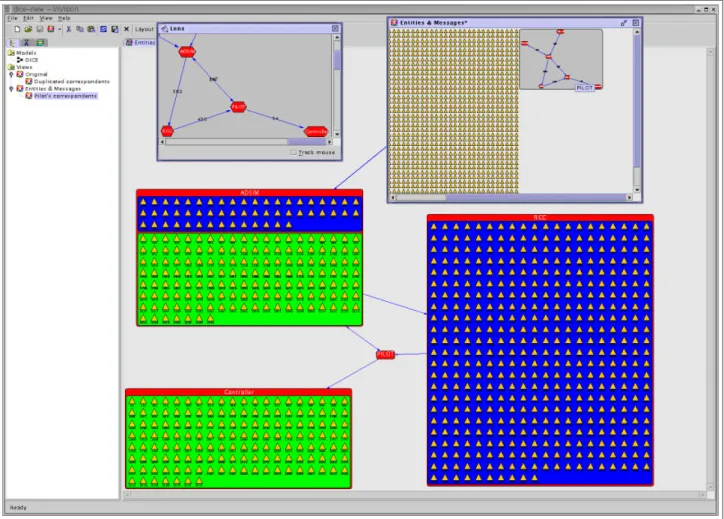
Before proceeding to examples of view coordina-tion, we start with an illustration of several of the many benefits of the view architecture described in Section 2. Figure 3 is a screenshot of a Clovis
view [Pattison et al., 2001b] of the simulated message traffic between entities represented in the simulation
Figure 3: View coordination in InVision.
of a military engagement. The window near the top right entitled “Entities & Messages” shows the mes-sages as orange triangles, organised in a single large array alongside a directed graph of the message ex-change relationships between the entities. The win-dow near the top left is a lens view which provides an alternative presentation of the same view model used to produce the presentation seen in the “Entities & Messages” window. This lens view can be panned and zoomed independently of the latter presentation. If the “Track mouse” check box in the window hosting the lens view is ticked, panning of the lens view is slaved to panning of the “Entities & Messages” view. A different view of the same data model can be seen in the large window underneath. Here each mes-sage appears twice, once in a blue box within a larger red box corresponding to the source entity for the message, and once in a green box within a larger red box corresponding to the destination entity for the message. The red boxes are an alternative representa-tion of the nodes of the same message exchange graph depicted in the two smaller windows discussed above. In contrast with these smaller views, the design of the larger view makes it easy to locate the messages sent and received by a node of interest.
Messages which were neither sent nor received by a nominated entity – in this case the “Pilot” – were filtered out from the data provided to the “Entities & Messages” view by a Transform component prior to construction of this “Pilot’s correspondents” view. A (possibly trivial) transformation is associated with each edge of the tree rooted at the “Views” node in the Workspace panel, shown on the left of Figure 3. Each node in this tree corresponds to either a view or a folder containing views. The latter view is shown
as a child of the former to indicate that an additional data transformation – in this case filtering – has been applied.
A more dynamic version of the “Pilot’s correspon-dents” view might in future be created by coordinat-ing selection of an entity of interest in the “Entities & Messages” view with the object of this filtering. The Transform component of the resultant view, which would be more appropriately named “Selection’s cor-respondents”, would filter out messages which were neither sent nor received by the entity nominated by the selection.
Rapid prototyping of information visualisations is an important design goal of the InVision frame-work. Accordingly, the facility to establish and cus-tomise multiple view coordinations through the user interface will be provided in future. Snap [North and Shneiderman, 2000] provides an elegant solution to the problem of simplifying the user’s conceptual model of coordination to the point where this is fea-sible. However, this simplification has been achieved at the expense of coordinations which are not data-centric. Further research will be required to include such coordinations in a user-accessible model of view coordination.
5 Related Work
Several specific view coordinations, most notably brushing and linking, are frequently hardwired by vi-sualisation tool vendors. Other than that proposed in Section 3, however, Snap [North and Shneiderman, 2000] provides the onlygenericview coordination ar-chitecture of which we are aware. In this section, these two architectures are compared and contrasted.
Snap uses COM to mediate view coordination be-tween third-party information visualisation tools sup-porting the Snap API, and ODBC to access the database(s) containing the information to be visu-alised [North and Shneiderman, 2000]. The API pro-vides for a pre-defined set of abstract actions on views, principally selection and navigation, which the devel-oper of a compliant visualisation tool can optionally support by mapping them to the methods and no-tifications of user input events appropriate to each view type. Abstraction of these actions simplifies the specification by the user of the required view coordi-nation, and delegates to the view developer the task of choosing and implementing sensible mappings. A language for specifying associations between the data items displayed in the coordinated views, and coordi-nations of the chosen user interface actions on those data items, is described in [North, 2001].
With reference to the view coordination archi-tecture depicted in Figure 2: the View component in Snap’s architecture is typically implemented by a third-party information visualisation application; interactions between the coordination “components” and the internal components of the view are medi-ated by the Snap API; the connection between the view and the data model – in this case a relational database – is via both the Snap API and ODBC; and view coordination is principally via the Model layer.
View coordinations in Snap are limited to those which involve the application of the abstract naviga-tion and selecnaviga-tion acnaviga-tions defined in the API to repre-sentations of data entities which are related by a join operation on the underlying relational database. Use-ful forms of view coordination are excluded by the re-striction to selection and navigation actions and join operations, and more generally to actions on related data. For example, other forms of correspondence between two or more views, such as corresponding regions within a shared coordinate system, or corre-sponding Clovis view containers (boxes), are also
possible. Even if we were to accept Snap’s restriction to data-centric coordination, correspondence between
sets of data elements might, for example, be deter-mined on the basis of matching the same query (on different subsets of the data), rather than through the join operator.
The proposed architecture accommodates a wider range of view coordinations by not only permitting more general forms of data correspondence within the Model layer, but also providing for coordination between views at the Presentation and Specification layers. These changes necessitate consideration of a greater variety of abstract operations for use in view coordinations. At the Presentation level, for exam-ple, the semantics of Snap’s navigate (to data) action is expanded to include geometric navigation to a re-gion of the view. Coordination at the Specification layer requires a new class of abstract actions to ac-commodate user customisation of the view, since the specification of other views may be derived from, and linked to, that of the view being customised. Simi-larly, user customisation of the data transformation implemented by the Transform component gives rise to another class of abstract actions.
6 Summary In this paper we have:
• argued the need for a generic approach to multi-ple view coordination;
• presented a view architecture and related it to standard reference models for the visualisation pipeline;
• overlaid a generic view coordination architecture onto this view architecture, including recommen-dations for the patterns of interaction between coordination and view components;
• presented examples from a partial implemen-tation of this architecture within the InVision component-based software framework for infor-mation visualisation;
• and compared our view coordination architecture with the data-centric view coordination architec-ture of Snap.
References
[Baldonado et al., 2000] Baldonado, M. Q. W., Woodruff, A., and Kuchinsky, A. (2000). Guide-lines for using multiple views in information visualization. In di Ges`u, V., Levialdi, S., and Tarantino, L., editors, Proc. Advanced Visual Interfaces, pages 110–119, Palermo, Italy. ACM Press.
[Card et al., 1999] Card, S. K., Mackinlay, J. D., and Shneiderman, B., editors (1999). Readings in In-formation Visualization: Using Vision to Think. Morgan Kaufmann Publishers, Inc., San Francisco, California.
[Chi, 2000] Chi, E. H. (2000). A taxonomy of visu-alisation techniques using the data state reference model. In Roth, S. F. and Keim, D., editors,Proc. IEEE Symp. Info. Vis., pages 69–75.
[Derthick et al., 1997] Derthick, M., Kolojejchick, J. A., and Roth, S. (1997). An interactive vi-sual query environment for exploring data. In Pro-ceedings of the ACM Symposium on User Interface Software and Technology (UIST ’97), pages 189– 198. ACM Press.
[Gamma et al., 1994] Gamma, E., Helm, R., John-son, R., and Vlissides, J. (1994). Design Pat-terns: Elements of Reusable Object-Oriented Soft-ware. Addison-Wesley, Wokingham, England. [Haber and McNabb, 1990] Haber, R. and McNabb,
D. (1990). Visualization idioms: A conceptual model for scientific visualization systems. In Niel-son, G., Shriver, B., and Rosenblum, L., editors,
Visualization in Scientific Computing. IEEE Com-puter Society Press.
[Kolojejchick et al., 1997] Kolojejchick, J., Roth, S., and Lucas, P. (1997). Information appliances and tools in Visage. IEEE Computer Graphics and Ap-plications, 17(4).
[Krasner and Pope, 1988] Krasner, G. and Pope, S. (1988). A cookbook for using the model-view-controller user interface paradigm in Smalltalk-80.
Journal of Object Oriented Programming, 1(3):26– 49.
[North, 2000] North, C. (2000). A User Interface for Coordinating Visualizations based on Relational Schemata: Snap-Together Visualization. PhD the-sis, Computer Science Dept., University of Mary-land.
[North, 2001] North, C. (2001). Multiple views and tight coupling in visualization: A language, taxon-omy, and system. In Proc. CSREA CISST 2001 Workshop of Fundamental Issues in Visualization, pages 626–632.
[North and Shneiderman, 1997] North, C. and Shnei-derman, B. (1997). A taxonomy of multiple win-dow coordinations. Technical Report CS-TR-3854, University of Maryland, Department of Computer Science.
[North and Shneiderman, 2000] North, C. and Shnei-derman, B. (2000). Snap-together visualization: A user interface for coordinating visualizations via re-lational schemata. In Advanced Visual Interfaces, pages 128–135.
[Olston and Woodruff, 2000] Olston, C. and Woodruff, A. (2000). Getting portals to be-have. In Roth, S. and Keim, D., editors, Proc. IEEE Symp. Info. Vis., pages 15–25.
[Pattison et al., 2001a] Pattison, T., Vernik, R., Goodburn, D., and Phillips, M. (2001a). Rapid assembly and deployment of domain visualisation solutions. Technical Report DSTO-TR-1100, Defence Science & Technology Organisation, www.dsto.defence.gov.au/corporate/reports/DSTO-TR-1100.pdf.
[Pattison et al., 2001b] Pattison, T., Vernik, R., and Phillips, M. (2001b). Information visu-alisation using composable layouts and vi-sual sets. Research Report DSTO-RR-0216, Defence Science & Technology Organisation, www.dsto.defence.gov.au/corporate/reports/DSTO-RR-0216.pdf.
[Sayle and Milner-White, 1995] Sayle, R. and Milner-White, E. (1995). RasMol: Biomolecular graphics for all. Trends in Biochemical Sciences, 20:374–376.
[Shneiderman, 1996] Shneiderman, B. (1996). The eyes have it: A task by data type taxonomy for information visualizations. In Proc. 1996 IEEE Conference on Visual Languages, pages 336–343, Boulder, CO.
[Shneiderman, 1998] Shneiderman, B. (1998). De-signing the User Interface: Strategies for Effective Human-Computer Interaction. Addison-Wesley, third edition.
[Tufte, 1997] Tufte, E. (1997). Visual Explanations. Graphics Press, Cheshire, Connecticut.
[Ward, 1994] Ward, M. (1994). Xmdvtool: Integrat-ing multiple methods for visualizIntegrat-ing multivariate data. In Proceedings of Visualization ’94, pages 326–33.