The Real-Time Data Management System for Argo Profiling Float Observations
CLAUDIASCHMID, ROBERTL. MOLINARI, REYNASABINA,ANDYEUN-HODANESHZADEH
National Oceanic and Atmospheric Administration/Atlantic Oceanographic and Meteorological Laboratory, Miami, Florida
XIANGDONGXIA, ELIZABETHFORTEZA,AND HUIQINYANG
Cooperative Institute for Marine and Atmospheric Studies, University of Miami, Miami, Florida
(Manuscript received 8 February 2006, in final form 8 September 2006) ABSTRACT
Argo is an internationally coordinated program directed at deploying and maintaining an array of 3000 temperature and salinity profiling floats on a global 3° latitude⫻3° longitude grid. Argo floats are deployed from research vessels, merchant ships, and aircraft. After launch they sink to a prescribed pressure level (typically 1000–2000 dbar), where most floats remain for 10 days. The floats then return to the surface, collecting temperature and salinity profiles. At the surface they transmit the data to a satellite and sink again to repeat the cycle. As of 10 August 2006 there are 2489 floats reporting data. The International Argo Data Management Team oversees the development and implementation of the data management protocols of Argo. Two types of data systems are active—real time and delayed mode. The real-time system receives the transmissions from the Argo floats, extracts the data, checks their quality, and makes them available to the users. The objective of the real-time system is to provide Argo profiles to the operational and research community within 24 h of their measurement. This requirement makes it necessary to control the quality of the data automatically. The delayed-mode quality control is directed at a more detailed look at the profiles using statistical methods and scientific review of the data. In this paper, the real-time data processing and quality-control methodology is described in detail. Results of the application of these procedures to Argo profiles are described.
1. Introduction
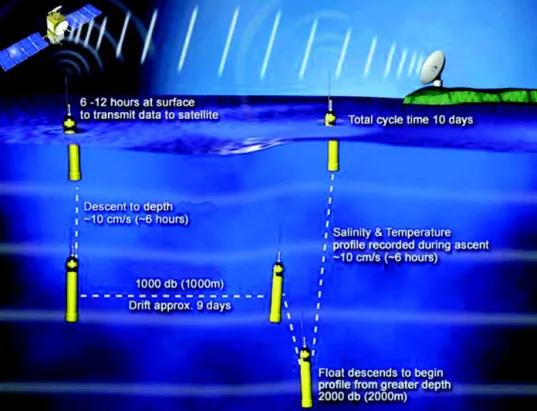
Argo is an internationally coordinated activity (see Table 1 for a list of the participating countries) directed at seeding the global ocean with 3000 profiling tem-perature and salinity floats. With usage, the name has evolved from being an acronym, the Array for Real-time Geostrophic Oceanography (ARGO), to a noun, Argo. Two primary types of float missions have evolved since the initial float design described in Davis et al. (1992). The original profiling float sinks after launch to a prescribed pressure level, typically 1000 dbar. After a preprogrammed time (typically 10 days) at this pres-sure, the float returns to the surface, collecting tem-perature and salinity profiles. On the surface, the float transmits the data to satellites. The data are then
for-warded via satellites for analysis. Newer floats can be programmed to drift at and profile to different pressure levels (Fig. 1). For instance, if a scientist’s interest is in the flow field at 400 dbar, the float is programmed to drift at this pressure for a prescribed time. Before sur-facing, the float sinks to a greater pressure (i.e., 2000 dbar), and then rises to the surface, collecting tempera-ture and salinity profiles. Data are returned ashore as before.
The primary objectives of Argo are to 1) provide a quantitative characterization of upper-ocean proper-ties, 2) use the float observations to improve interpre-tation of satellite altimetric data, 3) initialize ocean and coupled forecast models, and 4) provide input to other global ocean analyses (Roemmich et al. 1999). To ac-complish these objectives it was recognized early in the program that development of effective data manage-ment methodologies must be a major component of the overall Argo program. Thus, an international Argo Data Management Team (IADMT) was formed under
Corresponding author address: Dr. Claudia Schmid, NOAA/ AOML/PHOD, 4301 Rickenbacker Causeway, Miami, FL 33149. E-mail: [email protected]
1608 J O U R N A L O F A T M O S P H E R I C A N D O C E A N I C T E C H N O L O G Y VOLUME24
DOI: 10.1175/JTECH2070.1
the leadership of the International Argo Science Team (IAST) to define procedures to be used by the inter-national Argo community (Table 1). The guiding phi-losophy of Argo is that data are to be free, easily ac-cessible in a timely manner (i.e., for “real time” data within 24 h), and generated using uniform procedures. Thus, the majority of the procedures described in the text are not only employed by the U.S. Argo Data As-sembly Center (U.S. DAC) but also by the DACs op-erated by the other countries listed in Table 1. How-ever, the U.S. DAC is also testing additional real-time quality-control procedures that were not yet accepted by the IADMT. These procedures will be described as well.
The goal of this paper is to present the data manage-ment methodologies for real-time data developed by the IADMT and implemented by the U.S. DAC. In section 2, we will summarize the activities of the U.S. Argo Consortium and the components of the real-time data management program. The details of the real-time data processing are given in section 3. In section 4, we summarize the quality of the Argo data after real-time editing. In the next section, we will describe the value added both to the data and the Argo data management system by the real-time processing. Finally, we con-clude with possible enhancements to the real-time sys-tem.
2. The U.S. Argo Consortium and the Global Data Management System
A consortium of academic and government labora-tories sponsored by the National Oceanic Partnership Program (NOPP; online at http://www.nopp.org) man-ages the U.S. component of the Argo project. The sortium is comprised of members who either 1) con-struct and/or purchase floats; 2) deploy floats; and/or 3) perform the processing, quality control, and distribu-tion of the resulting data. Members of the U.S. consor-tium and their roles in the project are listed in Table 2. The consortium has committed to deploying 1500 floats of the final 3000-float array. The spatial distribution of the U.S. array in August 2006 is shown in Fig. 2. The number of profiles provided by the U.S. float array as a function of year is shown in Fig. 3.
Table 3 lists U.S. float deployments by ocean, year, and 20° latitude band. In the Atlantic, initial deploy-ments were concentrated in the equatorial band and the Northern Hemisphere. In the Pacific, deployments were primarily in the 30°S–10°N band. Indian Ocean deployments at all latitudes began in 2002. The U.S. commitment to global coverage is exemplified by the increase in deployments in the southern oceans begin-ning in 2002–03.
The U.S. consortium uses mainly two types of floats: the Autonomous Profiling Explorer (APEX) floats are built by Webb Research Corporation and the Sounding Oceanographic Lagrangian Observer (SOLO) floats are built by the Scripps Institution of Oceanography. With respect to data management, the encoding of the data and the quantity of the engineering data provided are the largest differences between the float types. [De-tails on the engineering aspects of the APEX (SOLO) floats can be found online at http://www.webbresearch. com (http://www.argo.ucsd.edu).] Both manufacturers typically use commercially available conductivity– temperature–depth (CTD) sensors from two compa-nies: Seabird and Falmouth Scientific Instruments. [De-tails on the various sensors can be found on the com-panies Web sites (respectively, http://www.seabird.com and http://www.falmouth.com).] The CTD units from Seabird pump seawater through the system of sensors. The pumps are typically turned off at 4–5 dbar to elimi-nate sensor problems caused by contact with contami-nants at the sea surface. The type of float and CTD sensor for a particular measurement are included in the metadata file accompanying the profile.
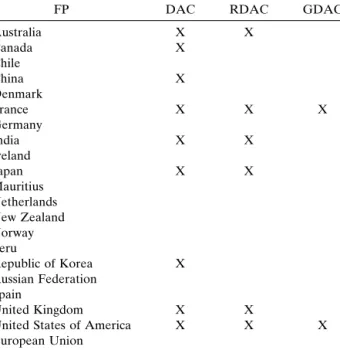
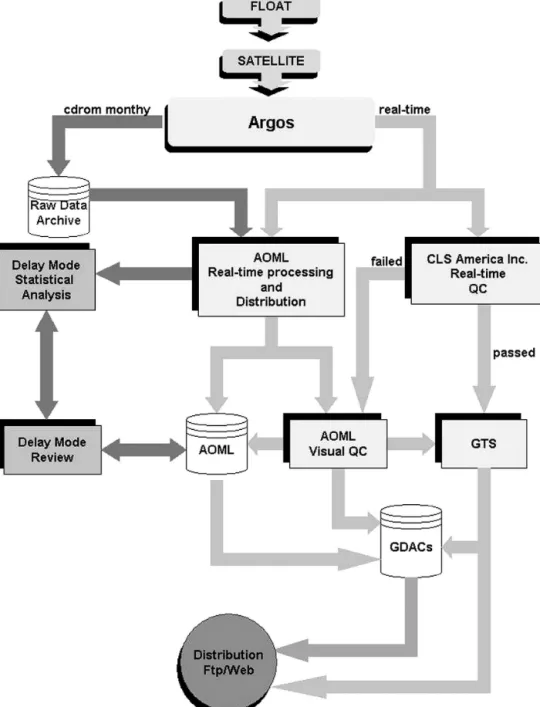
A schematic diagram showing the flow of data from the float to the user is given in Fig. 4 (details are given in section 3). Two time scales have been defined for Argo data processing: real time and delayed mode. The TABLE1. International Argo partners. Listed are the countries
that are float providers (FPs) and the other roles they play in the Argo project. The DAC, RDAC, and GDAC columns indicate which countries operate either a DAC, RDAC, or GDAC, re-spectively. See text for definition of DAC activities.
FP DAC RDAC GDAC
Australia X X Canada X Chile China X Denmark France X X X Germany India X X Ireland Japan X X Mauritius Netherlands New Zealand Norway Peru Republic of Korea X Russian Federation Spain United Kingdom X X
United States of America X X X
primary objective of the real-time data processing is to provide salinity and temperature profiles that have un-dergone some quality control to the operational and research communities within 24 h of collection. The 24-h constraint was requested by the operational agen-cies that use the Argo data to initialize ocean analyses and climate forecast models.
Delayed-mode data experience more stringent re-view using statistical procedures and scientific knowl-edge (i.e., dependent on operator involvement). Two levels of delayed-mode quality control are planned. First, individual float providers use a statistical analysis
(e.g., Wong et al. 2003; Böhme and Send 2005) of their profiles to derive offset and drift corrections to pres-sure, salinity, and (rarely) temperature, if needed. Sec-ond, regional DACs (RDAC; see Table 1 for the coun-tries participating in RDAC activities) compare all float data taken in one of seven regions (the North and South Atlantic, North and South Pacific, North and South Indian, and Southern Ocean), independent of float providers, and compare the float profiles to other profiles collected nearby in space and time (e.g., inde-pendent float, CTD, XBT profiles). Based on such comparisons, the need for additional corrections can be established once the regional DACs have finalized their FIG. 1. A float mission composed of drifting at a shallow pressure level and then sinking to a deeper
pressure level for profiling to the surface.
TABLE2. Members of the National Ocean Partnership Program funded U.S. Argo Consortium and their tasks. FP⫽float pro-vider, FD⫽float deployer, DAC⫽Data Assembly Center op-erator, and DM ⫽ performs delayed-mode quality control. PMEL ⫽ Pacific Marine Environmental Laboratory, SIO ⫽ Scripps Institution of Oceanography, UW⫽University of Wash-ington, and WHOI⫽Woods Hole Oceanographic Institution.
Institution; members FP FD DAC DM
NOAA/AOML; S. Garzoli, R. Molinari X X
NOAA/PMEL; G. Johnson X X X
SIO; R. Davis, D. Roemmich X X X
UW; S. Riser X X X
WHOI; B. Owens X X X
FIG. 2. Distribution of U.S. floats in August 2006. 1610 J O U R N A L O F A T M O S P H E R I C A N D O C E A N I C T E C H N O L O G Y VOLUME24
methodology. Herein, we will concentrate on the de-tails of the real-time data processing.
Two global DACs (GDACs) have been established to serve as the distribution points for all Argo data— one in the United States and the other in France. The GDACs ensure that uniform data access procedures are available to the user community. The DACs dis-tribute Argo data to the GDACs and the float provid-ers. The DACs also make the Argo profiles available through the Global Telecommunications System (GTS). The distribution through the GDACs is tar-geted at scientists performing detailed data analysis and interpretation, as well as at operational centers running numerical models. The GTS distribution is primarily targeted at the operational users.
The Atlantic Oceanographic and Meteorological Laboratory (AOML) of the National Oceanic and At-mospheric Administration (NOAA; information online at http://www.aoml.noaa.gov) is a member of the U.S. Argo Consortium and serves as the U.S. DAC for
Argo. The U.S. DAC is responsible for the real-time quality control of profiles obtained from floats de-ployed by members of the U.S. Argo Consortium. As described previously, all real-time DACs use the same methodology developed by the IADMT. The proce-dures described in this paper apply to the other DACs listed in Table 1 with the following exceptions: 1) a test uses climatology and reanalysis fields (see section 3e) as a tool to identify problematic float profiles and inves-tigates if such a test is suitable as an addition to the automatic Argo quality control; and 2) a visual inspec-tion of profiles that have failed an automatic Argo qual-ity-control test, as performed at the U.S. DAC, is not required by the IADMT, and therefore is not univer-sally implemented.
3. Processing of real-time data and generation of products for system evaluation
The primary objective of the real-time quality control of Argo profiles is to identify erroneous data prior to insertion in the GTS. Erroneous data are excluded from the profiles submitted to the GTS, but they are flagged and forwarded to the GDACs and float provid-ers. Thus, operational users of the observations who typically receive Argo profiles from the GTS are not overburdened with erroneous data and float providers are alerted to sensor problems in a timely manner. As mentioned above, another objective is to provide the data to the user community within 24 h, 24 h a day, and 7 days a week (commonly called a 24/7 operation). The 24-h time constraint and the requirement for a 24/7 operation necessitate a cursory, rather than detailed, review of the profiles applying automatic quality-control tests before transmission to the global user community. The 24/7 operations for the transmission of U.S. floats to GTS are performed at CLS America, Inc. (http://www.argosinc.com; formerly Service Argos, Inc.), using software developed by AOML. The profiles that pass the automatic Argo tests are immediately
for-TABLE3. Deployment of U.S. floats given by year and basin. The three numbers for each year are for the Atlantic, Pacific, and Indian Oceans. Band 2000 2001 2002 2003 2004 2005 ⬎50°N 0–0–0 0–14–0 0–8–0 4–2–0 2–2–0 1–2–0 50°–30°N 1–0–0 14–2–1 8–24–0 20–6–4 13–30–3 19–43–4 10°–30°N 2–5–0 9–11–0 8–14–4 30–22–3 29–20–5 18–55–0 10°S–10°N 21–14–0 6–39–1 7–6–6 11–78–26 14–27–0 16–76–10 30°–10°S 5–7–0 4–21–0 8–2–7 6–14–9 10–112–22 40–52–1 30°–50°S 0–0–0 0–2–0 3–4–20 20–24–0 17–91–17 19–77–0 ⬎50°S 0–0–0 0–0–0 0–0–4 0–17–0 0–13–8 6–58–0 Total 29–26–0 33–89–2 34–58–41 91–163–42 85–295–55 119–363–15
FIG. 3. Evolution by calendar year of the number of profiles
warded to the GTS for worldwide distribution. As a backup, the same system is also running at AOML (without the automatic transmissions to GTS). This sys-tem distributes to the GDACs and float providers, and is used for the visual inspection by an operator at AOML, who can assign new flags to those profiles that fail the automatic Argo tests (see section 3f). The sys-tem at AOML can also take over the GTS transmis-sions, if necessary.
For many profiles only a few measurements are bad.
Often these are identified properly by the automatic Argo tests. In other cases the tests may not flag certain erroneous measurements as bad while other good mea-surements may fail a test. These unwanted outcomes are primarily due to a trade-off between maximizing the amount of detected bad data while minimizing the rejection of good data. More details about quality con-trol and data distribution procedures are given in sec-tions 3d–g.
Figure 4 shows the details of the real-time and de-FIG. 4. The flow of Argo data from float to GDAC for floats that use Argos for the data
transmission. QC⫽quality control.
layed-mode processing system developed in response to the criteria established by the IADMT. A brief descrip-tion of each step in the real-time processing routine is given in sections 3a–g, followed by a description of the role of AOML in transmitting delayed-mode data to GDACs (section 3h), a summary of the products gen-erated to evaluate the overall performance of the floats and network (section 3i), and, finally, the definition of equivalent Argo floats (section 3j).
a. Metadata
To translate the raw data received from the floats to physical units, calibration and other information are required and given to the U.S. DAC by the float pro-vider. Metadata include information about the float provider, such as name, institution, etc.; the deploy-ment information, such as launch time, launch position, and launch vehicle (i.e., ship or aircraft); the equations and coefficients to convert the data to physical units; the type of float, including manufacturer; and the type of sensors on the floats. The metadata file retains all the identifiers associated with each float, including an in-ternal identifier assigned by AOML and two others provided by the World Meteorological Organization and the satellite service used for the data transmission. Additional information included in the metadata files, with examples, are available in appendix A.
b. Data transmission from float to DAC
The following three types of communications systems have been used to transmit data from the floats to DACs: 1) Argos (http://www.argos-system.org), 2) Iri-dium (http://www.iriIri-dium.com), and 3) Orbcomm (http://www.orbcomm.com). The characteristics of these systems (e.g., data transmission rates, vertical resolution, etc.) and a summary of desired characteris-tics are given in Roemmich et al. (1999). Because the majority of U.S. floats use Argos to transmit data, the description of the data processing is limited to that sys-tem.
Each float using Argos is equipped with a platform transmitter terminal (PTT). The PTT transmits data at a frequency of 401.650 MHz ⫾ 4 kHz (newer Argos receivers on satellites allow⫾25 kHz, and an additional increase is planned to allow two-way communication) to instruments flown on board NOAA Polar Orbiting Environmental Satellites, with a minimum of two satellites being operational at any time. The location of the float is determined from the Doppler effect on the transmitted signal. Position accuracies typically range from 150 to 1000 m, depending, in part, on the
position of the satellite relative to the position of the PTT.
The data of a profile (together with data collected during the drift and technical data) are encoded into several data frames for the transmission. Each frame can be up to 32 bytes in length. The number of frames necessary for data transmission depends on the number of pressure levels that were sampled, the precision with which the data are stored, the data compression, and the amount of engineering data. In general, floats that profile to 1000 (2000) dbar provide on the order of 40–50 (70) pressure–temperature–salinity triplets. The lowest pressure of profiles typically is 4–5 dbar. The resolution in the upper several hundred decibars is of the order of 10 dbar, typically increasing to greater pressure intervals near the bottom of the profile. Depending on the float type and mission parameters between 4 and 16 frames are needed to get a full profile, the drift, and the engineering data. A float remains at the surface for 9–24 h to transmit all data multiple times by cycling through the frames. The transmitted frames are received by satellites as they pass over the float (i.e., on current floats the PTTs are not interro-gated by the satellites). The received transmissions of a float contain each frame many times, which makes it necessary to identify the best version of each frame for generating the profile (see below). The multiple trans-missions of each frame are done to ensure that com-plete profiles and additional data are received by the orbiting satellites and transmitted to Argos processing centers.
Degradation of the data transmitted by the float can occur during several steps (e.g., the float-to-satellite link, the satellite-to-ground link, and in the actual pro-cessing of the data). Thus, most floats calculate a cyclic redundancy check (CRC) value (one byte) from all data bytes (30 or 31, dependent on length of the Argos identification number) in a frame and store it as the first byte of the frame. The CRC value is then recalcu-lated at the DAC. Because unequal CRC values usually indicate the introduction of errors during some portion of the transmission link, their comparison is very help-ful for the decoding process.
c. Decoding
By the end of August 2006, U.S. float providers were using primarily APEX and SOLO floats. However, be-cause of different float missions (e.g., some APEX floats have oxygen sensors; some SOLO floats work in a dual-mission mode, and therefore have a variable cycle time; and some SOLO floats use Orbcomm sat-ellites and some APEX floats use Iridium satsat-ellites to
transmit data), there are presently 36 different data for-mats used by U.S. floats. This paper only addresses decoding of data from APEX and SOLO float types that transmit data using Argos.
Within the “real-time processing and distribution” box of Fig. 4, data from the floats that are received at the processing center go through many processing steps. In this section the focus will be on the first three steps that are needed for the decoding of the data (Fig. 5): 1) sorting the incoming data by float (prv2hex), 2) sorting the data from each float by profiles and chang-ing the format from hexadecimal values to decimal val-ues (hex2cnt), and 3) converting the decimal valval-ues into physical units (cnt2phy). Experience has shown that us-ing three programs instead of one (i.e., gous-ing directly from DS format to physical units) facilitates the iden-tification of problems. A brief description of each pro-gram follows.
In the prv2hex program the data from all floats are received from Argos in the DS (sometimes called PRV) format in large files that contain received transmissions from many floats.1The prv2hex program sorts the raw
data and stores them in float-specific files (called
hexa-decimal file) that contain the received transmissions (in a hexadecimal format), time stamps, and satellite infor-mation and positions. One line in this file represents either a received transmission or a position provided by Argos. If the hexadecimal file of a float already exists, the new data are appended; therefore, it contains many profiles. Within each hexadecimal file, the data are sorted by time, and duplicate data lines (e.g., lines con-taining the same received transmission from the same satellite with the same time of reception) are elimi-nated.
The hex2cnt program identifies the profiles stored in a hexadecimal file through date checks2 and converts
the data to decimal integers (counts) according to the specifications given in the documentation describing the data format used by the float.3 One counts file is
generated for each profile. These files consist of a header and a profile part (their structure is similar to the file shown in appendix B). The header part has two main sections—the first contains float metadata, such
1Only one program is used for all float types using Argos for data transmission.
2For most float missions a new profile is designated if the dif-ference between the Julian days in the adjacent lines of the hexa-decimal file exceeds two days.
3A hex2cnt program exists for each data format, and the infor-mation needed to decide which one has to be used is given in the metadata file.
FIG. 5. Data flow through the real-time processing scheme. Programs such as hex2cnt, which converts files in hexadecimal (HEX) format to files into the counts (CNT) format, are de-scribed in the text. An example of the physical units file (PHY format) is given in appendix B. The CNT files have a structure that is very similar to that of the PHY files. The structure of the HEX files is described in the text.
as start transmission time, hydrographic data collected during the drift phase (provided by most floats), engi-neering data, number of levels, etc.; and the second contains the times of the first and last received message
(i.e., the approximate time at the surface) and the float positions with times derived during the reception of the data. The profile part contains the actual profile data, such as pressure, temperature, salinity, and oxygen (as counts).
As stated above, a line in the hexadecimal file rep-resents a received transmission or a position provided by Argos. Each transmission cycle associated with a profile results in many lines of hexadecimal data (typi-cally 100 or more, depending on surface time and trans-mission rate). Each received transtrans-mission contains a frame number. Because a float sends and the satellites acquire the same frame many times, the hex2cnt soft-ware selects the most likely frame (i.e., the frame of highest quality) for each frame number. If the float transmits CRC values together with the data, then this number is used in the process of selecting the most likely frame as follows. First, it is checked whether one or more received transmissions with the same frame number have matching CRC values. If only one has a matching CRC value, it is used. Otherwise, the software selects the most likely frame from them. If no received transmissions with the same frame number and match-ing CRC values are found, then the most likely frame is selected from all of them. In both cases, the algorithm used to find the most likely frame with a particular frame number is sorting through the identified subset of the transmissions to detect the one that occurs most frequently.
Because a float often stays on the surface through two or more data collections from Argos, it is possible that the same profile needs to be generated more than once. Sometimes this is the case because higher-quality data transmissions are received or part of the profile was not available initially because one or more frames were missing. Another likely case is that more position information becomes available. If more data come in for a particular profile, the old counts file is replaced with a new one.
The cnt2phy program is used to convert the data in the counts file to physical units using float-specific con-version equations.4 The result is stored in a physical units file with a structure that is very similar to the structure of the counts file. An example of a physical units file is given in appendix B. When converting counts to physical units, conversion equations and co-efficients are needed. The metadata file contains the float’s unique coefficients for conversion of the data.
4A cnt2phy program exists for each data format, and the in-formation needed to decide which one has to be used is given in the metadata file.
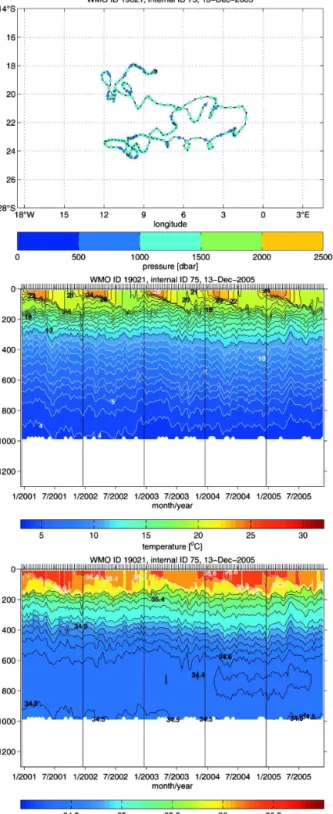
FIG. 6. (top) Subsurface float trajectory. (middle) Time series of
temperature vs pressure data from the same float. (bottom) Time series of salinity vs pressure data from the same float.
d. Automatic Argo quality-control tests
To provide data of the large number of Argo floats to operational agencies within 24 h, an initial review of the data has to be performed automatically and indepen-dent of any operator involvement. Based partially on previous experience gained in the quality control of expendable bathythermograph temperature profiles, a series of automatic tests was developed. The tests are not only checking for spikes, increasing pressure, unre-alistic temperature inversions, etc., but also for the po-sition data while the float is at the surface. Presently, Argo real-time float data undergo 16 automatic Argo quality-control tests (described online at http:// www.coriolis.eu.org//cdc/argo_rfc.htm).5 A brief
de-scription of these tests is given in appendix C.
Approximately 90% of all profiles received at AOML pass all the automatic Argo tests (see sec-tion 4). Those that fail a test are not transmitted to GTS immediately (see sections 3f,g about the procedure in these cases), but they are immediately forwarded to the GDACs and float providers with flags that indicate the outcome of the tests. A flag of 1 indicates that all tests were passed, a flag of 2 indicates a questionable but probably good data point, a flag of 3 is assigned to a
questionable but probably bad point, and a flag of 4 indicates a bad value. Missing values (if part of the profile was not transmitted by a float) are flagged with a 9. Only flags 1, 4, and 9 are assigned during the au-tomatic quality control unless a sensor of a float was put on the gray list (see section 3f) with a different flag value. Most frequently the latter occurs for older floats with a drifting salinity sensor and requires a flag of 3. As will be described in section 3g, it is not possible to include flags on GTS messages because of the present format used to transmit profile data.
e. Climatological and NCEP reanalysis tests
During the application of the automatic Argo qual-ity-control tests at the U.S. DAC, the temperature and salinity profiles are also compared to the monthly mean profiles from the World Ocean Atlas 2001 (WOA01; Conkright et al. 2002) and to weekly fields from an ocean reanalysis model run at NOAA/National Centers for Environmental Prediction (NCEP; D. Behringer 2005, personal communication). Standard deviations fromWOA01are also used for these tests. For a mea-surement to be considered as potentially wrong it has to deviate by more than 10 standard deviations from the mean for both tests (climatology and reanalysis). Be-cause neither test is included in the official real-time methodology endorsed by the IADMT, profiles that 5A visual quality control is also on the list. It is not mandatory
to perform this test in real time.
FIG. 7. Composite of battery voltage vs time histories for a particular float type used to identify potential problems with float performance.
fail one or both tests are automatically transmitted on the GTS. The tests were implemented at the U.S. DAC to test their effectiveness in identifying erroneous pro-files that were not flagged by the automatic Argo qual-ity-control tests. If these new tests are effective, an ar-gument could then be made for their inclusion in the officially accepted real-time protocol. The profiles that failed both tests undergo visual quality control as de-scribed in section 3f. In addition, as will be dede-scribed in section 4, the comparison with NCEP model results was introduced with the ultimate goal of determining the effectiveness of the assimilation schemes used in the forecast models.
Because a measurement that passed the automatic Argo tests must fail both comparisons to be considered bad, this will be called a statistical test hereinafter. The statistical test has demonstrated its usefulness in iden-tifying bad profiles that were not flagged by the auto-matic Argo tests. For example, incorrect metadata for the conversion from counts to physical values could be used (e.g., for a newly deployed float). Profiles from such a float could pass all the automatic Argo tests although the data are not correct. However, profiles from such a float would consistently fail the statistical test. Several cases like this occurred and were identified after the visual inspection described in the next section. As a result, the incorrect coefficients were found and corrected. A reviewer of this manuscript suggested that a careful review of the first few profiles can be used as an approach to identify such floats. However, this ap-proach cannot be used to identify problems that may occur later in the float life and are currently unknown. One example is that the statistical test and subsequent visual inspection were also able to identify floats that started to produce “frozen profiles,” which are charac-terized by the same profile being transmitted by a float during every surface cycle. Such cases were first de-tected with the statistical test, mainly due to the ab-sence of a seasonal cycle. An automatic real-time test has been developed by AOML and has been imple-mented by the IADMT to identify this problem faster. Float and sensor design is not static, and as new models of both are introduced it can be expected that new sources of errors will be introduced into the data stream. Thus, for the immediate future AOML will continue to apply this nonstandard (i.e., not on the of-ficial IADMT list of real-time Argo quality-control tests) statistical test.
f. Visual quality control
Presently at the U.S. DAC, those profiles that failed any of the automatic Argo tests undergo visual review by an operator. This review is not a requirement of the
real-time protocols established by the IADMT. Rather, it was implemented to determine whether automatic Argo tests were excessively flagging good measure-ments as bad or letting too many bad measuremeasure-ments pass as good, to motivate modifications to automatic Argo tests for which problems were detected, and to determine whether additional tests were necessary to catch problems that could not be detected by any of the existing tests.
The visual quality control is performed with graphi-cal software that allows an operator to 1) compare the Argo profiles to climatological profiles from the same month and position, 2) compare the profile with previ-ous profiles from the same float via a waterfall plot, and 3) generate a temperature–salinity diagram with super-imposed isopycnals to test for hydrostatic stability. The operator can revise the flags assigned to a measurement with the suite of automatic Argo tests. Afterward, the visual inspection profiles without the erroneous mea-surements are forwarded to GTS, following IADMT procedures (i.e., sufficient good points exist, see section 3g). This is typically done within 36–72 h of the mea-surement of a profile (i.e., AOML is not operating on a 24/7 schedule). The entire profiles with revised flags are resubmitted to the GDACs and provided to the prin-cipal investigators (PIs) as described in section 3d. The concept of a gray list has been introduced into the Argo data stream to reduce the need to perform a visual quality control of profiles from some floats. After ap-proval by the float provider, those floats that consis-tently generate erroneous profiles are placed on the gray list. Data from gray-listed floats are not distributed through GTS but are forwarded to the GDACs and PIs with the appropriate flags.
The objectives of the visual quality control have been, and continue to be, met. For instance, the specific examples of the identification of incorrect coefficients and frozen profiles are described in the previous sec-tion. However, to reduce the workload changes to the way the decision to perform a visual quality control of a profile is made are currently being discussed. One idea is that the decision could be based on how many data points in a profile failed a test, and this requirement could be made test dependent. For ex-ample, a profile with only one spike could bypass the visual quality control, while a single failure of the gra-dient test could be required to go through visual quality control.
g. Transmission of real-time data from DACs to GTS, GDACs, and float providers
The data processing is done twice a day, which means that a set of profiles that successfully pass the automatic
Argo tests are made available through GTS twice daily. In addition, those that passed the visual quality control are transmitted to GTS, typically within 36–72 h (as described above and in section 4). Some profiles are incomplete because a float surfaced shortly before the data processing started. In this case, the system waits for the next data-processing phase (12 h later). If the float does not provide a complete profile (this can, e.g., be due to bad weather at the location of the float), an incomplete profile is forwarded to GTS after 48 h. Only profiles with observations at more than five pressure levels and that reach 50 dbar are transmitted to GTS. The data are transmitted as a Temperature, Salinity, and Current Report (TESAC) message, a format ap-proved by the World Meteorological Organization, which was developed for profile data that include tem-perature and salinity. This format does not allow for quality-control flags to accompany the observations. If the pressure, or a temperature–salinity pair, is bad the data triplet is excluded in the TESAC message. If the temperature or the salinity failed the QC, the bad value is excluded.
The GDACs are the sanctioned distribution sites for all the international Argo float data and the locations from which data users can access the Argo observa-tions, because the DACs do not serve as a provider of data to users. When a new or changed profile from a float is created, the U.S. DAC transmits a trajectory file, with all the positions reported for this float during the time at the surface, a technical file, and a profile file to the GDACs once a day. The profile file contains the values of all measured parameters and the flags result-ing from the automatic and visual quality-control pro-cedures. Float providers can retrieve their float data from an AOML Argo ftp site.
h. Forwarding of delayed-mode data to the GDACs
Delayed-mode quality control of Argo profiles has begun, although the procedures have not been com-pletely finalized. After receiving the float data from the AOML Argo ftp site, the float providers further quality control the data in delayed mode. Then they return the profiles with the same or revised data and flags and AOML verifies that no errors were introduced into the dataset (e.g., incorrect positions, data values, etc.). Er-ror-free data are forwarded to the GDACs, while feed-back on inadvertently introduced errors is sent to the float provider.
i. Products for system evaluation
Products are generated to demonstrate the perfor-mance of 1) individual floats, 2) types of floats, and 3)
deployment strategies. For individual floats, a trajec-tory plot and temperature and salinity time series in the form of vertical sections (Fig. 6), waterfall plots, and temperature–salinity diagrams (not shown) are gener-ated for each float and placed on the AOML Argo Web site (online at http://www.aoml.noaa.gov/phod/ ARGO//HomePage/home.html). Products that demon-strate performance characteristics include statistics about premature failures, battery power, and sensor performance to identify and remedy any systematic problems with a specific float/sensor. For example, Fig. 7 shows how the battery voltage of several floats of the same type changes from profile to profile. In this case, most floats experience a gradual decrease of the volt-age, while some experience a quite rapid decrease after about 60 profiles or more.
Analyzing early failures of floats can help detect problems. For example, 2% (6%) of the floats deployed in 2000 never transmit data (stop reporting within 22 days of deployment). In all other years these percent-ages do not exceed 1% (3%). When taking the deploy-ment method into account and ignoring the deploydeploy-ment year it is found that the percentages of floats that stop reporting within 22 days after deployment are 2% for aircraft, 1% for research vessels, and 3% for commer-cial vessels. Overall, the similarity of the float perfor-mance for different deployment types indicates that the deployment methods created for airplanes and com-mercial vessel are working well. An analysis of sensor performance was done by estimating how many mea-surements provided by a float are bad. Poor perfor-mance is defined as 50% or more measurements that do not pass the quality control (including the visual test). The highest percentage of floats with poor sensor per-formance occurred among those deployed in 2003 (6%). In that year 17 floats of a new type were de-ployed, and 7 of them had a poor sensor performance.
j. Equivalent Argo floats
There are several groups in the United States that deploy profiling floats but are not funded by NOPP. These groups include the Naval Oceanographic Office of the United States Navy, the University of Hawaii, NOAA/National Data Buoy Center, and the Florida State University. These organizations have contributed the data from their profilers to the Argo program. They provide the appropriate metadata to AOML and the measurements undergo the same real-time procedures as do NOPP-funded floats. The profiles are submitted to the GTS (some by the University of Washington and some by AOML) and GDACs (by AOML) for global access.
4. Results of real-time quality control of Argo data
The majority of profiles (about 90%) pass the auto-matic Argo tests (Fig. 8). Typically, about one-quarter of the profiles that failed an automatic Argo test passed operator inspection (Fig. 9). Most profiles failed an au-tomatic Argo test because of isolated errors in tempera-ture, salinity, and/or position values, which are re-moved based on the flags prior to transmission.
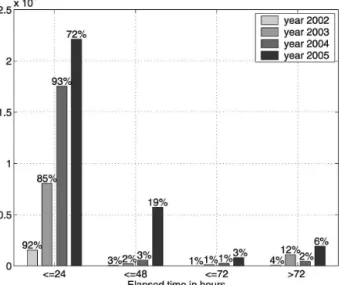
In 2002–04 close to 90% of the profiles are transmit-ted on the GTS within 24 h (Fig. 10). In 2005 the per-centage of data submitted within 24 h is lower (72%), because the increasing amount of incoming data slowed down the first processing step (prv2hex, see section 3c for details about this process), primarily in June– August (in these months the percentage dropped to about 65% for the 24-h time frame). However, optimi-zations of the data processing system were imple-mented in August, so that on average 89% of all pro-files that passed the automatic Argo quality control were available on GTS within 28 h (i.e., 17% were sent in the interval 24–28 h). To achieve this the files created
by prv2hex are now being split into “historical” and “recent” data once a year to reduce the size of the files being used in real-time processing. In mid-2006, the increasing amount of data resulting from the increasing number of floats slowed down the system again. This problem is being dealt with, first by the purchase of a more powerful computer, which is being used for op-erational data processing since September 2006, and second by investigating additional ways to optimize the processing system.
The impact of the real-time editing on the quality of the Argo profile data transmitted on the GTS is dem-onstrated by comparing their temperature and salinity values with the climatology (WOA01; Conkright et al. 2002). As will be described, the comparison also pro-vides a measure of both the accuracy of the climatology used in the AOML processing and the improvement in float performance with time. TheWOA01climatology provides, on a 1° latitude⫻1° longitude grid, monthly mean and standard deviation values of temperature and salinity at standard depths. Because the floats report pressure, a pressure-to-depth conversion was per-formed before the comparison. This is done based on the method by Saunders and Fofonoff (1976), which has been revised to adapt to the new equation of state of the ocean derived in 1980. Differences between float temperature (salinity) and climatological values from the appropriate 1° quadrangle were computed for depths greater than 400 m. The deeper depths were selected for review because water mass characteristics FIG. 8. Outcome of the quality-control tests. Light gray bars
represent the number of profiles that passed all the Argo auto-matic quality-control tests and were immediately forwarded to the GTS and Global Data Assembly Centers. The dark gray bars represent the number of profiles that failed the climatology and analysis test and were immediately forwarded to the GTS. They were also forwarded to the operator performing visual quality control. The black bars represent the number of profiles that failed an automatic Argo quality-control test and were immedi-ately forwarded to the Global Data Assembly Centers. They were forwarded to the operator for visual review. The percentages rep-resent the profiles that passed the automatic Argo quality control, independent of the outcome of the climatology and analysis test.
FIG. 9. Number of profiles that failed an automatic Argo qual-ity-control test but passed visual inspection by an operator and were then forwarded to the Global Telecommunications System. The files with the revised flags are also resubmitted to the Global Data Assembly Centers. The percentages represent the profiles that failed an automatic Argo quality-control test and passed the visual inspection.
are typically more stable at depth than closer to the surface.
To determine if there are any generic problems with either the climatology and/or float performance as a function of position (e.g., warm tropical versus cold subpolar regions), ensemble averages and standard de-viations of differences were computed by grouping pro-files into 10-profile increments from all floats within 20° latitude bands for each ocean (i.e., the first 10 profiles of all floats in a region go into the first group). Incre-mental averages were computed to determine if there are any problems with a float’s performance that can be linked to its time in water. The issue of generic prob-lems in either climatology or float performance is the subject of an ongoing study and will not be addressed in detail in this paper; however, some general comments will be presented. The difference information can also be used to provide a measure of the effects of the au-tomated procedures on the quality of the Argo data.
Figure 11 provides an example of the calculations for 600 and 1000 m for a 20° latitude band in the South Pacific Ocean. Overall means of the 10-profile incre-ments of average differences and standard deviations were computed and are also shown. For this particular band mean temperature differences between climatol-ogy and float observations before and after automatic quality control are small and equal, suggesting that the climatology is valid for this region. However, there is a 10% (at 600 m) to 20% (at 1000 m) reduction of the mean standard deviation after quality control, caused primarily by the removal of measurements in the early
stages of the lifetime of some floats (e.g., the 10–20-profile increment). Later, the impact is smaller, because the floats with sensor problems either stopped operat-ing or stopped providoperat-ing full depth profiles. It has to be noted that the number of temperature profiles is not reduced much by the quality control (see the value fol-lowing “#prof” in Fig. 11); this is discussed below.
Similarly, the quality control does not have an impact on the mean differences of climatological and float sa-linities, indicating that the salinity climatology is also robust for this band. The reduction of the mean stan-dard deviation for salinity is much larger than for tem-perature (70%–80%, instead of no more than 20%). The reduction in the number of profiles (not resolved in the figure) after quality control is 31 in the 1–10-profile range and gradually goes down to 1 in the 51–60-profile range. Some of the profiles are from floats that did not produce many profiles, but in most cases they are from floats that measured bad salinity at the depths shown here for part or all of the available record.
Beyond 60 (80) profiles, no temperature (salinity) profiles are rejected at the two depths by the quality control, indicating that all the floats reaching 80 profiles are performing well (as of December 2005). The quite sharp drop-off in the number of profiles around profile 50 is partly due to the fact that the majority of floats (71%) in the region shown were deployed after March 2004 (i.e., they could only measure up to about 56 pro-files through December 2005).
To provide a summary of the statistics for all the 20° bands by ocean, standard deviations before and after quality control were computed for 600 and 1000 m, using the method described for Fig. 11. In all oceans the quality control leads to reductions of the standard de-viations (Fig. 12). Before going into details it has to be noted that, based on poor initial performance of some float types, significant improvements were made to these models after 2002. Prior to 2003, the majority of these floats were deployed in the Atlantic and Pacific Oceans (Table 3) where quality control had the greatest impact on the profiles resulting from these floats. The improvement is marked by the dramatic decreases in temperature and salinity standard deviations in these basins (Fig. 12). The impact of the quality control is largest for the temperature and salinity measurements in the northern and equatorial Atlantic Ocean, fol-lowed by the northern Pacific Ocean. Only for the 20° and 40°S bins in the Atlantic Ocean, where deploy-ments started later, the standard deviations before quality control have the same characteristics as in the other oceans. Similarly, the majority of the Southern and Indian Ocean floats were deployed after 2002 FIG. 10. Distribution of elapsed times between observation and
transmission to the Global Telecommunications System. The de-sired elapsed time is less than 24 h. The numbers at the top ends of the bars are percentages.
FIG. 11. Examples of mean differences and standard deviations (black lines with error bars) computed for 10-profile increments
between observed values of (upper four panels) temperatureTfand (lower four panels) salinitySf, and the corresponding values from
theWOA01climatologyTcandSc(Conkright et al. 2002) at 600 and 1000 m. Data (left) before and (right) after quality control. The
example is computed from all floats located in a 20° latitude band in the South Pacific (30°–10°S, 145°E–70°W). The ensemble averages of the 10-profile increment mean differences (mean) and standard deviations (std) are given in the upper-right corner of each panel. The gray lines indicate the number of profiles that contribute to each estimate. The number behind # prof indicates the number of eliminated profiles.
(Table 3). The small changes in means and standard deviations before and after quality control (Fig. 12) in these areas are representative of the improvements in float performance.
The impact of the quality control on the standard deviations for salinity is typically larger than the impact on those for temperature. This can be explained by the fact that temperature sensors are more stable than sa-FIG. 12. Summary of all the average standard deviations by ocean and 20° intervals (Fig. 11 shows
estimates for one latitude band in the Pacific) for (left) temperatureTand (right) salinityS. In addition
the standard deviation from the WOA01climatology (Conkright et al. 2002) is shown. The ocean boundaries are 145°E–70°W for the Pacific, 70°W–20°E for the Atlantic, and 20°–145°E for the Indian Ocean. The inset legend in the middle right panel is valid for all panels. QC⫽quality control.
linity sensors. The latter can suffer from biofouling, which reduces their accuracy over time. This was a par-ticular problem with earlier floats with SeaBird conduc-tivity sensors, although the sensors were treated with antifouling. An improvement of the stability of the con-ductivity cells was achieved by switching to a different antifouling compound on the sensors. Another factor that can deteriorate conductivity cells is contaminants at the surface of the ocean that can damage the sensors. For CTD systems that use pumps this deterioration is reduced by stopping the sampling a couple of meters below the surface.
TheWOA01climatology (Conkright et al. 2002) also provides standard deviations for temperature and sa-linity on their 1° grid. These values are averaged for each 20° band by ocean and are also given in Fig. 12 to provide a measure of the historical variability. In all cases, the average standard deviations after quality con-trol are closer to the historical variability than the val-ues before quality control. In some regions the standard deviations after quality control are significantly larger than those from theWOA01climatology. This indicates that some regions may be more variable than the cli-matology suggests. Examples are the temperature at 600 and 1000 m in the North Atlantic, at 40°S in the Indian Ocean, and at 1000 m in the North Pacific, and the salinity at 600 m at 40°S in the Indian Ocean. This points toward both the great potential of Argo profiles for the derivation of an improved climatology and the variability around the mean state.
5. Value added to Argo data and data management methodology by real-time processing
The users of Argo data can be divided into two gen-eral classes: those that do basic research and those that do operations. The first group typically prefers data that have gone through a quality control but not nec-essarily within a 24-h time constraint. The second group generally performs their own quality control before us-ing the data to initialize climate models or ocean analy-ses, for example. They do require data in a more timely manner than their research counterparts to meet op-erational schedules.
Because real-time Argo data will be replaced by data that have undergone the more stringent delayed-mode quality-control procedures only after some 6–12 months (details are being developed), the real-time quality control performed by the DACs will provide an edited dataset for those researchers that require data in less than 6–12 months. Receiving the data from the
GDACs rather than the GTS will also provide them with flags to evaluate the quality of the data.
In many cases the automatic Argo tests provide sig-nificant benefits for the research user due to the flag-ging of erroneous data, as described previously in sec-tion 3d. Often, the addisec-tional visual quality control per-formed at AOML provides valuable information by revising some of the flags (section 3f). This information is used in the generation of the data files for distribu-tion via GTS. In other cases, results from a combined climatology and reanalysis test (section 3e) are used for instituting a visual review of a profile (section 3f). Be-cause profiles in this category already went to GTS, this revised flagging is only available at the GDACs.
The operator review resulted in identification of sev-eral floats whose profiles passed all automatic Argo tests but whose data were erroneous. As described above, sometimes the cause for the bad data could be identified and corrective action could be taken. In other cases the data from a float sensor was considered bad enough to put it on the gray list (e.g., sensor drift and frozen profile cases). To summarize, the real-time qual-ity control 1) adds value for research users who require data in less than 6–12 months and 2) can identify prob-lems and potentially solve them quickly.
Figure 9 shows that during most years, approximately one-quarter of the profiles that failed the automatic Argo quality control passed the visual quality control, and therefore were suitable for GTS transmission with-out exclusion of any measurements. Others could be sent to GTS after corrective action, as described in sec-tions 3f and 3g. Thus, the operator’s review of the data increases the information available to the operational and research users of the profiles. Finally, as described above and summarized in the next section, many prod-ucts that help evaluate the health of the entire Argo system (individual floats, types of floats, types of sen-sors, etc.) were developed during the real-time quality control and will be presented to the IADMT for con-sideration as a requirement for information to be pro-vided by either the DACs, the GDACs, or the Argo Information Center.
6. Future directions
The following list of future improvements to the real-time data processing methodology is a result of the ex-perience gained by AOML and other DACs in applying the original tools designed for this operation. Several of the items in this list are being reviewed by the IADMT. • Replace the present format used for TESAC mes-sages to Binary Universal Form for the
Representa-tion of Meteorological Data (BUFR) so that flags can be transmitted on the GTS.
• Analyze the performance of automatic Argo quality-control tests (e.g., spikes, pressure increasing, speed check) and modify them to improve their ability to detect bad measurements. If successful, such modifi-cations will reduce the number of bad measurements slipping through and the number of good measure-ments that are rejected, and reduce the need of op-erator involvement.
• Add new tests to the automatic quality-control pro-cess, including comparisons with a climatology and reanalysis. With the evolution of float technology new types of errors are possible that may not be de-tected by the current suite of automatic Argo quality-control tests. The use of climatology and reanalysis tests can help detect systematic problems with a sen-sor earlier than if their detection relies on the scien-tific quality control. The choice of climatology or re-analysis will not have a dramatic effect on the iden-tification of systematic problems.
• Revising the way the decision to perform visual qual-ity control is made can reduce the number of profiles that have to undergo visual quality control without reducing the accuracy of the assigned flags signifi-cantly.
• A careful review of the first few profiles of a float can be invaluable in the identification of errors in the conversion coefficients or float-type specifications in the metadata file. The outcome of climatology and reanalysis tests, as well as comparison with nearby independent observations, can be very helpful in the detection of such problems.
• Develop a Web site that provides additional products to evaluate the performance of individual float types. Examples would include composites by float type of time series of surface pressure, pressure at drift depth, and battery voltage. Such products could po-tentially be made available at the Argo Information Center or the Global Data Centers.
• Generate additional products to evaluate the health of the Argo network, such as statistics of float and sensor performance, charts indicating the age of the active floats, charts showing deployment sites, and trajectories of floats that have run aground.
• Increase the interaction between the DACs and op-erational and research users of the Argo data to ob-tain their input on how to improve the real-time data processing methodology.
Acknowledgments.Comments by Dr. Alberto Mes-tas-Nunez and Dr. Carlisle Thacker are gratefully ac-knowledged. The Argo project is funded under the Na-tional Oceanographic Partnership Program in fulfilling its strategic goal to Achieve and Sustain an Integrated Ocean Observing System (IOOS). This research was carried out in part under the auspices of the Coopera-tive Institute for Marine and Atmospheric Studies, a joint institute of the University of Miami and the National Oceanic and Atmospheric Administration, Cooperative Agreement NA67RJ0149. We gratefully appreciate the comments of the reviewers. These comments improved the text and also provided ideas on how to improve the real-time quality-control pro-cess.
APPENDIX A Example of a Metadata File
The left-hand column lists the requirements, and the right-hand column gives, as an example, the contents from a completed metadata file.
internal ID number 0894
transmission ID number 49050
transmission type ARGOS
instrument type APEX_TS21
ARGOS program number 2862
WMO ID number 2900150
WMO instrument type (table 1770) 846
WMO recorder type (table 4770) 60
start time [dd mm yyyy hh mm (Z)] 15 06 2004 00 34
status of start time as recorded
launch time [dd mm yyyy hh mm (Z)] 15 06 2004 01 27
status of launch time as recorded
launch position [lat latm lon lonm] 32. 23.94 144. 34.98
status of launch position as recorded
delay of first down time [hours] 6
down time [days] 4.4583
up time [hours] 13
transmission repetition rate [sec] 44
clock drift [hours/hours] 0
last cycle n/a
⫽⫽⫽⫽⫽⫽⫽⫽⫽⫽⫽⫽⫽⫽⫽⫽⫽⫽⫽⫽⫽⫽⫽⫽⫽⫽⫽⫽⫽⫽⫽⫽⫽
calib Eq. 1 for salinity sslope*cnts⫹soff
calib coef for salinity SSLOPE⫽0.001; SOFF⫽0.0;
calib Eq. 1 for temperature tslope*cnts⫹toff
calib coef for temperature TSLOPE⫽0.001; TOFF⫽0.0;
calib Eq. 1 for pressure pslope*cnts⫹poff
calib coef for pressure PSLOPE⫽0.1; POFF⫽0.0;
calib Eq. 1 for voltage vslope*cnts⫹voff
calib coef for voltage VSLOPE⫽0.1; VOFF⫽0.4;
calib Eq. 1 for vacuum vacslope*cnts⫹vacoff
calib coef for vacuum VACSLOPE⫽ ⫺0.209; VACOFF⫽26.23;
⫽⫽⫽⫽⫽⫽⫽⫽⫽⫽⫽⫽⫽⫽⫽⫽⫽⫽⫽⫽⫽⫽⫽⫽⫽⫽⫽⫽⫽⫽⫽⫽⫽
conductivity calibration date n/a
temperature calibration date n/a
pressure calibration date n/a
float manufacturer Webb
float serial number 1736
PI Peter Hacker, Bo Qiu
principal investigator address UH, Honolulu, HI
originating country USA
Project name UH, Argo equivalent
float deployer P. Hacker, H. Mitsudera
float deployer address UH
deployment type R/V
deployment platform Thomas G. Thompson
deployment cruise id TN-168
profile at deployment CTD-012
nominal drift pressure [dbar] 1500
cycles for drift pressure 1
nominal profile pressure [dbar] 1500
cycles for profile pressure 1
Profile Sampling Method discrete
pump type 260ml
conductivity sensor type SBE41
conductivity sensor manufacturer SBE
conductivity sensor serial number 1480
temperature sensor type SBE41
temperature sensor manufacturer SBE
temperature sensor serial number 1480
pressure sensor type 2900 psia
pressure sensor manufacturer druck
pressure sensor serial number n/a
battery type Alkaline
initial battery voltage [volt] 15
ROM version 030804
APPENDIX B
An Example of a Physical Units File
INTERNAL ID NUMBER 0894
WMO ID NUMBER 2900150
TRANSMISSION ID NUMBER 49050
PROFILE NUMBER 86
WMO INSTRUMENT TYPE (TABLE 1770) 846
WMO RECORDER TYPE (TABLE 4770) 60
ARGOS PROGRAM NUMBER 2862
INSTRUMENT TYPE APEX_TS21
CONTROLLER SN 1728
PI PETER HACKER, BO QIU
START OF TRANSMISSION 2005 8 18 21 47 56
PROFILE LENGTH (BINS) 76
BATTERY (VOLT) 6.70
BATTERY CURRENT (COUNTS) 48
AIR BLADDER PRESSURE 146
AIR PUMP ON TIME (SECONDS) 944
DRIFT BATTERY (VOLT) 14.40
DRIFT BATTERY CURRENT (COUNTS) 1
DRIFT TEMPERATURE (DEG C) 2.569
DRIFT PRESSURE (DBAR) 1502.5
DRIFT SALINITY (PSU) 34.494
SURFACE PRESSURE (DBAR) 5.0
INTERNAL VACUUM (INCHES HG) 6.2
PISTON POSITION 184
SURFACE PISTON POSITION 209
DRIFT PISTON POSITION 27
FORMAT NUMBER 8
DEPTH TABLE NUMBER 61
BATTERY SBE PUMP ON (VOLT) 14.00
BATTERY CURRENT SBE PUMP ON (COUNTS) 15
PROFILE TERMINATION FLAG (HEX) 0
NUMBER OF COLUMNS 4
1. COLUMN PRESSURE (DBAR)
2. COLUMN TEMPERATURE-90 (DEG C)
3. COLUMN SALINITY (PSU)
4. COLUMN CHECKSUM FLAG
CALIB EQ 1 FOR SALINITY SSLOPE*CNTS⫹SOFF
CALIB COEF FOR SALINITY SSLOPE⫽0.001; SOFF⫽0.0;
CALIB EQ 1 FOR TEMPERATURE TSLOPE*CNTS⫹TOFF
CALIB COEF FOR TEMPERATURE TSLOPE⫽0.001; TOFF⫽0.0;
CALIB EQ 1 FOR PRESSURE PSLOPE*CNTS⫹POFF
CALIB COEF FOR PRESSURE PSLOPE⫽0.1; POFF⫽0.0;
CALIB EQ 1 FOR VOLTAGE VSLOPE*CNTS⫹VOFF
CALIB COEF FOR VOLTAGE VSLOPE⫽0.1; VOFF⫽0.4;
CALIB EQ 1 FOR VACUUM VACSLOPE*CNTS⫹VACOFF
CALIB COEF FOR VACUUM VACSLOPE⫽ ⫺0.209; VACOFF⫽26.23;
⫽⫽⫽⫽⫽⫽⫽⫽⫽⫽⫽⫽⫽⫽⫽⫽⫽⫽⫽⫽⫽⫽⫽⫽⫽⫽⫽⫽⫽⫽⫽⫽⫽⫽⫽⫽⫽⫽⫽⫽⫽⫽⫽⫽⫽⫽⫽⫽⫽⫽⫽⫽⫽⫽⫽⫽⫽⫽⫽⫽⫽⫽⫽⫽⫽⫽⫽⫽⫽⫽
LATITUDE LONGITUDE YEAR/MO/DY HR:MN:SC XMITS SAT CLASS
⫹99.999 ⫹999.999 2005/08/18 22:56:08 000 J 0 ⫹29.854 ⫹142.496 2005/08/18 23:00:54 006 J 3 ⫹29.853 ⫹142.492 2005/08/19 0:11:18 009 M 2 ⫹29.850 ⫹142.490 2005/08/19 0:41:44 004 J 1 ⫹29.851 ⫹142.481 2005/08/19 1:51:02 008 M 3 ⫹29.852 ⫹142.474 2005/08/19 2:46:46 005 N 2 ⫹29.852 ⫹142.479 2005/08/19 3:21:14 006 L 1 ⫹29.857 ⫹142.477 2005/08/19 4:25:24 013 N 3 ⫹99.999 ⫹999.999 2005/08/19 5:02:48 000 L 0 ⫽⫽⫽⫽⫽⫽⫽⫽⫽⫽⫽⫽⫽⫽⫽⫽⫽⫽⫽⫽⫽⫽⫽⫽⫽⫽⫽⫽⫽⫽⫽⫽⫽⫽⫽⫽⫽⫽⫽⫽⫽⫽⫽⫽⫽⫽⫽⫽⫽⫽⫽⫽⫽⫽⫽⫽⫽⫽⫽⫽⫽⫽⫽⫽⫽⫽⫽⫽⫽⫽ 1626 J O U R N A L O F A T M O S P H E R I C A N D O C E A N I C T E C H N O L O G Y VOLUME24
1399.2 2.748 34.462 1 1299.2 2.961 34.424 1 1199.1 3.222 34.377 1 1099.4 3.512 34.322 1 999.4 3.925 34.249 1 968.8 4.091 34.222 1 939.2 4.316 34.211 1 909.2 4.469 34.185 1 879.4 4.481 34.126 1 849.3 4.754 34.094 1 818.9 4.955 34.063 1 789.2 5.062 34.024 1 759.4 5.232 33.997 1 729.2 5.645 33.981 1 699.5 6.145 33.982 1 669.3 7.231 34.059 1 638.9 7.997 34.084 1 609.4 8.932 34.164 1 579.2 9.913 34.246 1 549.5 10.720 34.297 1 519.5 11.761 34.366 1 488.9 12.729 34.433 1 458.7 13.386 34.479 1 429.1 13.944 34.520 1 399.4 14.692 34.573 1 379.0 15.400 34.630 1 359.3 15.888 34.667 1 339.4 16.312 34.705 1 319.0 16.664 34.741 1 299.2 16.893 34.767 1 278.8 17.085 34.788 1 259.1 17.179 34.798 1 238.9 17.271 34.803 1 219.1 17.387 34.813 1 199.3 17.490 34.814 1 178.8 17.573 34.815 1 159.1 17.664 34.818 1 139.4 17.864 34.816 1 129.5 18.097 34.824 1 119.4 18.336 34.834 1 109.5 18.618 34.842 1 99.0 18.988 34.845 1 89.6 19.439 34.849 4 85.5 19.870 34.871 4 74.4 20.187 34.914 4 69.3 20.430 34.852 4 64.5 20.895 34.877 4 59.6 21.133 34.880 1 54.5 21.364 34.899 1 49.7 22.014 34.881 1 44.6 22.509 34.917 1 39.6 23.440 34.913 1 34.7 25.647 34.664 1 29.5 27.599 34.513 1 24.8 28.053 34.537 1 19.7 28.408 34.538 1 14.4 28.624 34.544 1 9.5 28.655 34.546 1 4.5 28.840 34.542 1
APPENDIX C Brief Description of Real-Time Quality-Control
Tests
Platform identification: It is ensured that floats have a unique valid identifier that is assigned to the float providers by the World Meteorological Organiza-tion.
Impossible date/time: The year must be greater than 1996; the month must be in the range from 1 to 12; the day must be in the range expected for the month; and the hours and minutes must be in the range from 0 to 23 and 0 to 59, respectively. Impossible location: The latitude (longitude) must be
in the limits⫺90 to 90 (0 to 360).
Position on land: The float position must be located in an ocean. The ETOPO5 bottom topography (National Geophysical Data Center 1988) is used for this test.
Speed test: Surface and subsurface drift speeds may not exceed 3 m s⫺1.
Global range test: Temperatures must fall in the range from⫺2.5° to 40.0°C and salinity must be from 0.0 to 41.0.
Regional range test: Temperatures from floats in the Red Sea (Mediterranean Sea) must range from 21.7° to 40.0°C (10.0°–40.0°C) and salinity ranges must be from 0.0 to 41.0 (0.0–40.0).
Pressure increasing: The pressures must increase monotonically.
Spike: The test value is|2⫺(3⫹1)/2|⫺|(3⫺1)/2| for a value2, where1 and3 are the values above and below 2, which may not exceed prescribed limits. Above 500 dbar, the limit for temperature (salinity) is 6°C (0.9) and below 500 dbar the limits are 2°C (0.3).
Gradient: The test value|2⫺(3⫹1)/2|for a value
2 may not exceed prescribed limits. Above 500 dbar, the limit for temperature (salinity) is 9.0°C (1.5) and below 500 dbar the limits are 6.0°C (0.5). Digit rollover: A specific number of bits are allocated for the storage of temperature and salinity values in a float. When the number is exceeded, stored values rollover to the lower end of the range. This rollover when detected is compensated for in the processing algorithm.
Stuck value: This test checks for constant tempera-ture or salinity values throughout the profile. Density inversion: This test computes the density at
all pressure levels from the observed temperature and salinity values and tests for hydrostatic stabil-ity.
Gray list: A list generated based on the history of a float. When a float sensor has systematic problems it is placed on this list.
Gross salinity or temperature sensor drift: If the av-erage temperature (salinity) from the last 100 dbar of two adjacent profiles exceeds 1°C (0.5), then the profile is considered to be bad.
Frozen profile: If floats produce five consecutive pro-files with very small differences throughout the en-tire water column (i.e., of the order of 0.001 for salinity and of the order of 0.01°C for temperature) they are candidates for the gray list.
Visual quality control by an operator. This test is not mandatory in real-time processing.
REFERENCES
Böhme, L., and U. Send, 2005: Objective analyses of hydrographic data for referencing profiling float salinities in highly variable environments.Deep-Sea Res. II,52(3–4), 651–664. Conkright, M. E., R. Locarnini, H. Garcia, T. O’Brien, T. P.
Boyer, C. Stephens, and J. Antonov, 2002:World Ocean Atlas 2001: Objective Analyses, Data Statistics and Figures. Na-tional Oceanographic Data Center, CD-ROM Documenta-tion, 17 pp.
Davis, R. E., D. C. Webb, L. A. Regier, and J. Dufour, 1992: The Autonomous Lagrangian Current Explorer.J. Atmos. Oce-anic Technol.,9,264–285.
National Geophysical Data Center, 1988: Digital relief of the sur-face of the earth. NOAA/National Geophysical Data Center Data Announcement 88-MGG-02. [Available online at http:// www.ngdc.noaa.gov/mgg/global/etopo5.HTML.]
Roemmich, D., and Coauthors, 2001: Argo: The global array of profiling floats.Observing the Oceans in the 21st Century,
C. J. Koblinsky and N. R. Smith, Eds., Melbourne Bureau of Meteorology, 604 pp.
Saunders, P. M., and N. P. Fofonoff, 1976: Conversion of pressure to depth in the ocean.Deep-Sea Res.,23,109–111.
Wong, A. P. S., G. C. Johnson, and W. B. Owens, 2003: Delayed-mode calibration of autonomous CTD profiling float salinity data by⌰-S climatology.J. Atmos. Oceanic Technol.,20,308– 318.