Exp Brain Res (1996) 110:67-79 9 Springer-Verlag 1996
M a r t h a F l a n d e r s 9 J o h n J. P e l l e g r i n i 9 S c o t t D. G e i s l e r
Basic features of phasic activation for reaching in vertical planes
Received: 13 January 1995 / Accepted: 21 November 1995
A b s t r a c t The purpose of this study was to fully charac- terize the timing and intensity of the phasic portion of the electromyographic (EMG) waveform for reaching movements in vertical planes. Electromyographic activi- ty was simultaneously recorded from nine superficial el- bow and/or shoulder muscles while human subjects made rapid arm movements. Hand paths comprised 20 directions in a sagittal plane and 20 directions in a fron- tal plane. In order to focus on the more phasic aspects of muscle activation, estimates of postural EMG activity were subtracted from the EMG traces recorded during rapid reaches. These postural estimates were obtained from activity recorded during very slow reaches to the same targets. After subtraction of this postural activity, agonist or antagonist burst patterns were often observed in the phasic EMG traces. For nearly all muscles and all subjects, the relation between phasic EMG intensity and movement direction was a function with multiple peaks. For all muscles, the timing of phasic EMG bursts varied as a function of movement direction: the data from each muscle exhibited a gradual temporal shift of activity over a certain range of directions. This gradual temporal shift has no obvious correspondence to the mechanical re- quirements of the task and might represent a neuromus- cular control strategy in which burst timing contributes to the specification of movement direction.
Key words Reaching 9 Arm movement.
Electromyography 9 Joint torque 9 Neuromuscular pattern generation 9 Human
Introduction
For reaching movements of the arm, the equations of motion are complex, containing terms for inertial, cen- tripetal, Coriolis, and gravitational moments. How neural M. Flanders ( ~ ) 9 J.J. Pellegrini 9 S.D. Geisler
Department of Physiology, 6-255 Millard Hall,
University of Minnesota, Minneapolis, MN 55455, USA; Fax: + 1-612-625-5149, e-mail: martha@ neuro.med.umn.edu
control mechanisms deal with this mechanical complexi- ty is a fundamental, unanswered question. Approaches to understanding the control of reaching have included the analysis of motor cortical activity (e.g., Georgopoulos 1991), mechanical optimization (e.g., Soechting et al. 1995), and investigation of the frame of reference in which adaptation occurs (e.g., Shadmehr and Mussa-Iva- ldi 1994). Electromyographic (EMG) studies comple- ment these various lines of investigation by providing a description of the activation patterns which constitute the interface between the central nervous system and the biomechanics of the moving arm.
In our initial studies of the neuromuscular control mechanism for reaching, we reported that muscle activa- tion waveforms are complex in that they exhibit compo- nents related to both dynamic and gravitational torques (Flanders 1991; Flanders and Herrmann 1992). Never- theless, the complex EMG waveforms clearly showed a gradual variation in timing, for movements in various di- rections in a vertical plane. An analogous directional variation in the onset of EMG activity had been reported for reaching in the horizontal plane (Wadman et al. 1980). For the horizontal plane, EMG onset covaried with EMG intensity (Karst and Hasan 1991b), but, for the vertical plane, the earliest EMG waveform was not necessarily the most intense (Flanders 1991). Thus there appear to be both similarities and differences in the pat- terns reported for vertical and horizontal planes.
For the vertical plane, decomposition of the complex EMG waveform into phasic (speed-related) and tonic (gravity-related) components allowed us to closely ex- amine the temporal pattern (Buneo et al. 1994). In a re- cent research note, we showed the spatial/temporal pat- tern of isolated EMG bursts for four muscles, for reaches in one plane (Flanders et al. 1994). The objective of the present report is to fully characterize the timing and in- tensity of isolated EMG bursts, for reaches in two verti- cal planes. We will show that a gradual shift in burst tim- ing is a feature seen in each of the nine muscles exam- ined. For each muscle, we will also show how burst in- tensity varies with movement direction; in many cases
the timing and intensity do not exhibit the same pattern. Neither the timing nor the intensity pattern seems to cor- respond to the patterns of joint torques required for straight hand paths (Buneo et al. 1995).
Materials and methods
Reaching task
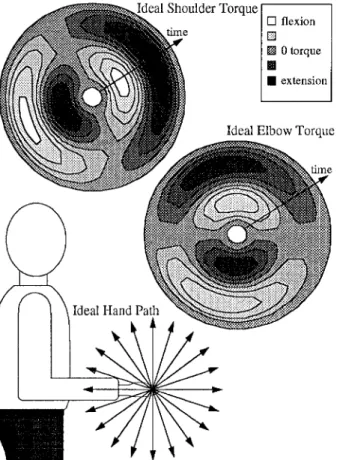
Figure 1 illustrates the idealized mechanics of sagittal-plane reaches, in terms of straight hand paths and the computed pattern of dynamic shoulder and elbow torques needed to produce these movements (assuming a bell-shaped velocity profile). Despite the complexity of the equations of motion, the torque pattern is rela- tively simple when the arm moves in a sagittal plane and the gravi- tational component is subtracted away (cf. Buneo et al. 1995). (The torque pattern for hand paths in the frontal plane is more complex and has not been computed.)
In the present study, we arranged 20 targets in a sagittaI plane (as indicated in Fig. 1) and 20 targets in the frontal plane passing through the finger tip (not illustrated). The target array was made from fishing sinkers, suspended from the ceiling with fishing line. Each target was 30 cm from the starting point. For movements in both planes the initial posture was as shown in Fig. 1: the upper arm was vertical, the forearm was horizontal, and the plane con- taining the right arm was parallel to the midsagittal plane of the
body. With the wrist neutral with respect to pronation/supination, the subject held a pen-shaped stylus that was used to record hand position in three dimensions (Graf Pen GP3-3D; spatial resolution 0.1 ram, sampling rate 100 Hz).
The same four human subjects were used in both parts of the experiment (sagittal and frontal planes). They were healthy and young (aged 21-49 years), and gave informed consent. Subject A was a 1.778-m, 68.1-kg man; subject B was a 1.829-m, 86.26-kg man; subject C was a 1.753-m, 59.02-kg woman; and subject D was a 1.803-m, 72.64-kg man. Each part of the experiment was completed in one recording session using one set of electrode placements, but the two parts were performed on two separate days. All protocols were approved by the University of Minnesota Institutional Review Board.
Each subject was instructed to move from the initial position to the target position after hearing a computer-generated tone. The subject was instructed to refrain from changing the wrist posture, but was otherwise free to move naturally. Subjects were requested to move in the proper direction, and to move consistently from trail to trial without making corrections for inaccuracies. Most subjects chose to practice the movement once or twice for each new direction. On alternate trials, the subject was instructed to move either very fast or very slowly. Each part of the experiment consisted of 400 trials. The subject moved five times in a row to each target, three times fast and twice slowly. The target directions were varied pseudorandomly until all 20 directions had been cov- ered, and then the entire sequence was repeated three more times. To avoid fatigue, subjects rested whenever they wished.
E M G data acquisition
We recorded simultaneously from nine elbow and/or shoulder muscles: brachioradialis (BR, elbow flexor), biceps (BI, elbow and shoulder flexor), medial head of triceps (MT, elbow extensor), long head of triceps (LOT, elbow and shoulder extensor), pectora- lis (Pec, shoulder adductor and medial rotator), anterior deltoid (AD, shoulder flexor and adductor), medial deltoid (MD, shoulder abductor), posterior deltoid (PD, shoulder extensor and adductor), and latissimus dorsi (LAD, shoulder extensor and medial rotator). In presenting the data for the sagittal plane, we will exclude Pec, since its activity was close to noise level in most subjects, for most directions. For the frontal plane we will exclude data from LoT, for the same reason.
We taped small bipolar surface electrodes over the belly of each muscle (SensorMedics). These Ag/AgC1 electrodes were 2 mm in diameter and were placed about 2 cm apart. A typical power spectrum is shown in Fig. 2A. The signals were amplified and band-pass filtered at 100-5000 Hz to remove movement arti- fact and detect electrical artifact. The data were then digitized at 500 Hz (cf. Fig. 2A,B). We collected 2 s of data for each trial. Digitally rectified EMG data from like trials (same direction, same speed) were then aligned at movement onset (as described below), averaged, and smoothed (Fig. 2B).
Fig. 1 Schematic illustration of the idealized mechanical require- ments of the reaching task. Computed dynamic joint torques are shown on a polar plot, with directions corresponding to those il- lustrated for hand path (forward is to the right). Time radiates out- ward, such that forward and upward movements are initiated by a propulsive shoulder flexion torque (light shading) and then slowed by a shoulder extension torque (dark shading)
Data analysis
For each trial, we first examined the hand path and tangential ve- locity data (computed in two dimensions). We measured the onset and end of the movement by placing cursors on the velocity pro- file, at zero crossings. Trials in which the movements had unam- biguous onsets and unimodal velocity profiles were then grouped for averaging. Very few trials were discarded at this stage. Mean movement times were computed across trials of the same type, and trials with movement times more than 1 SD from the mean were excluded from further processing. About 30% of the trials were discarded for this reason. Kinematic data from similar trials were compressed into the same time frame and resampled (cf. Flanders and Herrmann 1992) prior to averaging hand paths (in two dimen- sions).
We averaged EMG data from the five to ten trials representing either fast (about 0.5 s) or slow (about 1 s) movements in a particu-
Fig. 2 A - C EMG data from the anterior deltoid of subject C. A A typical power spectrum (on a logarithmic scale) of the EMG data recorded in our lab- oratory. EMG power has dropped to less than 1% of maximum at a frequency of 250 Hz. Routine sampling at 500 Hz was based on data such as these. B Rectifiedi averaged (ten trials), and smoothed EMG data. C The subtraction proce- dure for isolating the most pha- sic portion of EMG records.
The top panel shows EMG
means for fast (400-ms move- ment time, solid bar) upward and forward reaching move- ments (39 cm from the standard initial hand location), The mid-
dle panel shows the corre-
sponding record from slow (1-s movement time, solid bar)
reaches, along with static EMG levels. The intermediate points are placed on the EMG trace at times corresponding to when the slowly moving hand passed through each location (assum- ing a bell-shaped velocity pro- file, and a 150-ms lag between EMG and movement). The bot-
tom panel shows the difference
between the two, after the time base of the record from the slow movement was com- pressed (direction of arrow).
After subtraction, the baseline was near zero and the first ago- nist burst was larger than the second agonist burst. Ampli- tude units are arbitrary but uni- form across the three panels
69
300.0-
200.0-
I
1
0
0
.
0
-
~
0 . 0 - - 1 0 0 . 0 - - z o o . o - Sample Number at 10,000 Hz -3oo.o-, , , , , , , ,A
0
1000 2000 3000 4000 5000 6000 7000
1 . 0 - 1 0 % o f m a x . , [ d } l i | J ~|L Log o o - l % o f m a x . , t ~ t I ~ l l [ r ~ i ~ [ , i t r o w e r ~ "ifi '1 ! r alO-
/ q ,
i,i] iii1 I
i:12
AA/
I1' '
40.
0 10 100 250Frequency
(Hz)
( 1 sec) I i I8000 9000 10000
500 5000 100Anterior Deltoid EMG 0
Sampled at 10,000 Hz
Sampled at 500 Hz
Digitally Smoothed (Low-pass)
Movement Time 100
Static E ~
0 , ~ ~ , , , ' , EM? from Slow Movement,
I I I
01.,I" " 1 " ~ ~ ' , ~ " x . . , - - - ~ f ' k . , , - 4 0 ] , , ~ , , Phasic EMG from Subtraction
200 600 ms
lar direction. To isolate the phasic aspects of the muscle activity, we then used the subtraction procedure illustrated in Fig. 2C. The full description of this procedure is published elsewhere (Buneo et al. 1994), and in Fig. 2C we use data from that previous study to describe the method. The top panel depicts the EMG mean from AD, for reaches directed upward and forward to a target 39 cm dis- tant, in the sagittal plane of the arm. In the middle panel, we show a smoothed trace from a slow (1 s) movement to this same target. In this previous study, subjects also moved in the same direction, to targets 13 cm and 26 cm from the initial position. Static AD EMG levels were computed for these two intermediate positions by aver- aging across 100 ms of data, 100 ms after the end of each move- ment. These static data are shown in the middle panel along with static levels from the initial and final (39 cm) positions. Although the static EMG levels were slightly lower than the EMG for slow movement, the traces for slow movement usually appeared to be a reasonable approximation of postural activity. Results from our previous study suggested that distortions caused by this approxima- tion were less than 10% of maximum phasic EMG levels (Buneo et
al. 1994). The bottom panel of Fig. 2C shows the result of digitally compressing the slow EMG trace (middle panel) into the time frame of the fast trace (top panel), and then subtracting it. This pro- cedure isolated the most phasic aspect of the full EMG waveform. The phasic activity usually resembled either an agonist (as in Fig. 2C) or an antagonist waveform, except that, for what appeared to be either the "first agonist burst" or the "antagonist burst," burst timing was not constant across the different movement directions.
Because burst timing clearly varied with movement direction, we developed a method for locating the point in time around which the most intense (largest) 100-ms EMG epoch was cen- tered. This measure is similar to the time of peak EMG and serves to summarize variations in burst onset and duration. A 100-ms window was stepped through each phasic trace at 10-ms intervals. The 100-ms epoch with the greatest mean intensity was identified (as indicated in the lower panel of Fig. 2C), and the time of its peak value was expressed as a percentage of the mean movement time for that subject and that plane of movement (0% indicates that the burst was centered on movement onset).
Phasic EMG intensity was quantified as the mean EMG level in the 100-ms epoch identified as the center of the largest burst. Confining the intensity measurement to a single 100-ms epoch tended to enhance the appearance of multiple peaks in the polar plots of spatial tuning (Figs. 9-11). However, similar results were obtained using mean EMG levels across a 200-ms epoch or across the entire phasic trace. The spatial tuning curves in Figs. 9-12 and Fig. 4 were generated with SYGRAPH software (SYSTAT), using spline- and distance-weighted least squares (DWLS) smoothing al- gorithms, respectively.
Results
Most of the analyses presented in this paper are focused on the phasic E M G components obtained by subtraction (see Fig. 2C). The results will be presented within the conceptual framework introduced in Fig. 1. In Fig. 1 we show that, despite the rather complex equations of mo- tion, a relatively simple pattern of joint torque can pro- duce straight hand paths in the sagittal plane (Buneo et al. 1995). The pattern shows an abrupt switch from a flexion propulsive region to an extension propulsive re- gion in upward and downward directions for shoulder torque, and in forward and backward directions for el- bow torque. We will show that phasic E M G patterns do not match the simplicity of the idealized torque pattern but instead exhibit gradual (rather than abrupt), direc- tional variations in timing and subtleties in the spatial tuning of intensity.
Kinematics
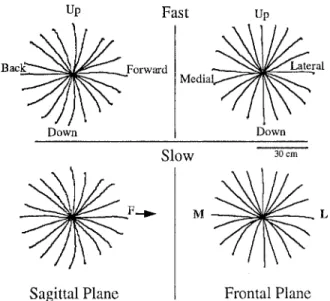
Representative hand paths are shown in Fig. 3: on the left we show averaged hand paths in the sagittal plane (from the first part of the experiment); on the right we show averaged hand paths in the frontal plane (from the second part of the experiment).
The hand path data in Fig. 3 reveal that, although there were substantial curvatures for certain directions, the paths were quite similar for fast movements (top) and slow movements (bottom). For slow movements, move- ment times were approximately 1 s. For fast movements, movement times were approximately 450 ms and changed slightly, but consistently, with movement direc- tion. Movement times were the greatest for movements straight back, in the sagittal plane (525_+17 ms, grand mean and standard error across four subjects). We will return to these points in the second paper of this set (Pel- legrini and Flanders 1996), and we will show that hand paths were similar across the four subjects.
Phasic timing
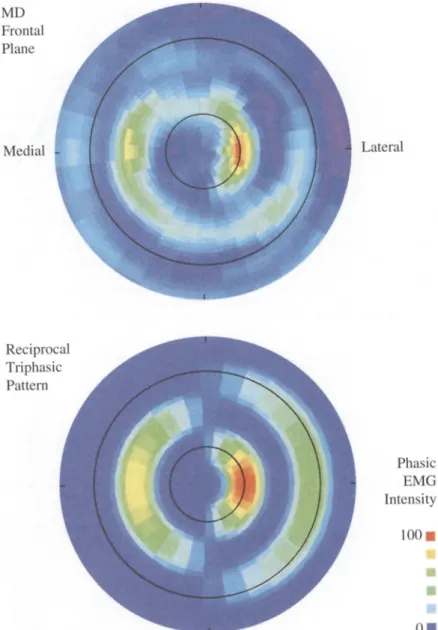
Figure 4 summarizes the main results of this study using the full set of 20 phasic E M G traces from the medial del- toid of subject B, for hand paths in the frontal plane. In the top panel, phasic E M G intensity (color scale) is shown on a polar plot of movement direction, with time
Up
Bac@Forward
Down
Fast uMedial~
~tera[
Down
Slow 30 cm
~ F ~
M @ L
Sagittal Plane FIontal Plane
Fig. 3 Hand paths, averaged over five to ten trials, in one subject. On the left are data from the first part of the experiment, where targets were in a sagittal plane. On the right are data from the sec- ond part of the experiment, where targets were in a frontal plane. During the experiment, fast reaching movements (paths in top
panel) were alternated with slow reaching movements (paths in
bottom panel). The directional conventions are also used in polar
plots in Figs. 9-12: for sagittal plane data, the arrow indicates for- ward (F) for frontal plane, medial (M) is left and lateral (L) is
right
progressing outward along the radius. The small black circle marks the time of movement onset, and the larger black circle marks the approximate time of movement end (which, for this subject, was about 400 ms later). For the lateral direction, the first agonist bursts are apparent in the light blue to orange shading and the second ago- nist bursts are shown by light blue to green shading. The inactivation between first and second agonist bursts is shown with violet shading (shorter wavelength than blue). The first agonist burst was centered near move- ment onset, whereas the second agonist burst was near the end of the movement. For the medial direction, the burst timing was that of an antagonist. Going counter- clockwise around the plot, the antagonist burst appears to gradually emerge from the first agonist burst and then gradually merge into the second agonist burst.
The top panel of Fig. 4 shows that the spatial tuning of phasic E M G intensity consisted of oppositely directed lobes, corresponding to agonist and antagonist regions. In this sense, the activity of MD was organized as might be expected from the mechanics (cf. Fig. 1). However, despite the reciprocal pattern for intensity, the timing did not switch abruptly from that of an agonist to that of an antagonist, but instead made a gradual transition in a smooth spiral. For the sake of comparison, the appear- ance of a strictly reciprocal organization, for both spatial tuning and timing, is shown in the bottom panel. This il- lustration shows idealized agonist and antagonist E M G bursts in a fixed time-frame, with two opposite lobes of cosine-tuned intensity modulation. In its best direction, the first agonist burst achieves 100% of maximal phasic
Fig. 4 Polar intensity plots comparing the medial deltoid
(MD) temporal pattern (top
panel) to the simulation of a re-
ciprocal pattern (bottom panel).
Phasic EMG intensity ranges from negative (violet) to zero
(dark blue background) to posi-
tive values (green to yellow to
red). Directions are oriented as
in Fig. 3 (right panel). The ra-
dius represents time (a total of
800 ms). The small black circle
marks the time of movement onset, and the larger black
circle marks the approximate
time of movement end (400 ms after onset). First agonist bursts were centered on movement onset; antagonist bursts were centered between onset and end. For MD, the intensity of these bursts was reciprocally organized, but the timing shift- ed in a continuous spiral. As documented in the following figures, each muscle exhibited a unique pattern
71
activity (red), while the second agonist burst achieves 50% (green). A reciprocal pattern implies that the antag- onist burst reaches its greatest value in the opposite di- rection. That value is chosen here as 75% (yellow) of maximal phasic activity. With the possible exception of LaD for the sagittal plane, none of the muscles that we studied had a spatial-temporal pattern that fit this hypo- thetical ideal. Instead, we will show that most muscles exhibited intensity peaks in directions that were not op- posite to each other and/or temporal shifts over a range of directions.
The E M G pattern shown in the top panel of Fig. 4 does not represent the directional variation in burst tim- ing for all muscles. Instead, each muscle exhibited a dis- tinct pattern (cf. Flanders et al. 1994), involving various spatial regions of intermediate burst timing (as will be documented in Figs. 6-8, below). This implies that a movement in a given direction was subserved by a tem- porally staggered activation of early and later "agonist bursts" in some muscles followed by early and later "an-
tagonist bursts" in other muscles. In Fig. 5 we show an example of this asynchronous activation pattern, using the MD trace for lateral hand paths (same data as in Fig. 4) along with the simultaneously recorded data from posterior deltoid (PD), latissimus dorsi (LAD), anterior deltoid (AD), and pectoralis (Pec).
Figure 6 shows burst timing as a function of move- ment direction, for two muscles. As described in the methods section, a 100-ms moving window was used to identify (with 10 ms resolution) the timing of the burst with the largest average intensity. In Fig. 6, the left panel and the top right panel show the E M G traces and the tim- ing function that correspond to the MD data shown in Fig. 4. The left panel depicts consecutive phasic E M G traces for lateral directions; clockwise consecutive direc- tions are indicated by progressively darker lines. The MD data in the left panel were the traces used to gener- ate points 3-10 (hatched symbols, numbered on the ab- scissa) of the timing function in the top right panel. For MD, burst timing is plotted in ms: movement onset was
72
P h a s i c E M G Lateral Direction
(For each muscle, amplitude is scaled to % max. for this recording session.) 0 200 ms [ M o v e m e n t T i m e P D
LaD
A D 600 msFig. 5 Asynchronous phasic shoulder muscle activation for hand paths in the lateral direction. EMG bursts in medial and posterior
deltoid (MD and PD) resemble agonist busts. Latissimus dorsi
(LAD) exhibits a burst with intermediate timing. Anterior deltoid
(AD) and pectoralis (Pec) exhibit busts that begin after movement
onset (at 200 ms). All data were simultaneously recorded from the
shoulder muscles of subject B and represent the mean of eight reaches in the lateral direction. Mean movement time for this di-
rection was 343 ms (dashed line). [Mean movement time for this
experiment (20 directions) was 394 ms; the longest average move-
ment time was 447 ms, for downward movements (dotted line)]
Medial Deltoid Phasic EMG
Directions 3, 4, 5, 6 9 51 / Direction t 7, 8, 9, 10 J ~ 7 ~!~ 200 ms 600 ms
80v
Ick MD
Frontal Plane
60
Time 40aJk[ . . . ~ - " - - . . .
(ms) ~1~ . . . / _ _ _ _ " - 7 _ - _ _ ~ _ ___
0 J ,
3
1,0,
,
Up Lateral Down Medial Up
% of 10s Move- ment 50- Time 0-
AD
Sagittal Plane
I I i I I Up Fwd. Down Back UpFig. 6 Timing of the largest intensity EMG burst. Left panel Tem-
poral patterns for medial deltoid (MD) across two lateral ranges;
phasic EMG waveforms during movements to targets in a frontal plane. EMG amplitude scale is arbitrary but the same in both pan-
els. In each range progressively darker lines represent data from
movement in progressively clockwise directions. For example, in
the upward-lateral range (direction 3-6), 36 ~ is the light gray line,
54 ~ is the gray line, 72 ~ is the dark gray line, and 90 ~ is the black
line. In the lateral-downward range (direction 7-10), the pattern
changed from that of an agonist to that of an antagonist. Right
panel The time at which the largest 100-ms-long burst peaked is
plotted against movement direction. For the top right panel, the
time axis is plotted in milliseconds with movement onset at 200 ms (394 ms mean movement time). This is to facilitate com-
parison with the corresponding EMG traces in the left panel. For
the bottom right panel, time is plotted as percentage of movement
time. Zero percent is movement onset; 100% represents the mean movement time for this subject and this plane (415 ms). In this figure, as in subsequent figures, the expected timing of an antago-
nist burst (around 50% movement time) is indicated by dashed
lines. All data are from subject B
at 200 ms, the d a s h e d lines i n d i c a t e the a p p r o x i m a t e t i m - ing o f an a n t a g o n i s t burst, a n d the m o v e m e n t s e n d e d at a p p r o x i m a t e l y 600 ms.
F r o m the t i m i n g plot, it is a p p a r e n t that M D h a d the t i m i n g o f an a g o n i s t for l a t e r a l m o v e m e n t s a n d the t i m -
ing o f an a n t a g o n i s t for m e d i a l m o v e m e n t s , as e x p e c t e d f r o m this m u s c l e ' s m e c h a n i c a l action. T h e t i m i n g o f M D p h a s i c a c t i v i t y was g r a d u a l l y e a r l i e r for c l o c k w i s e c h a n g e s in d i r e c t i o n in the l a t e r a l r a n g e (points and trac- es 3 - 6 ) . F o r d i r e c t i o n 10 ( d o w n ) , the first a g o n i s t burst
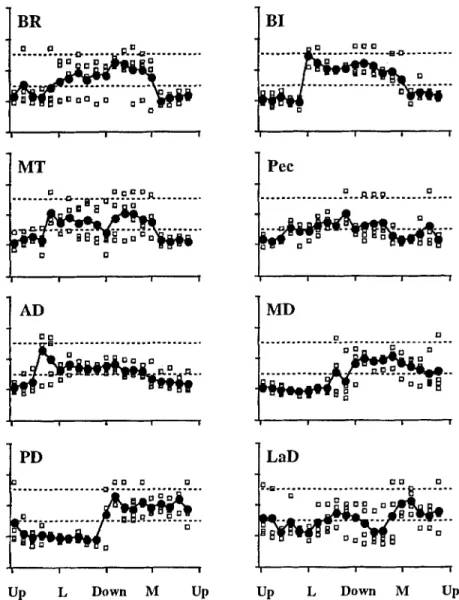
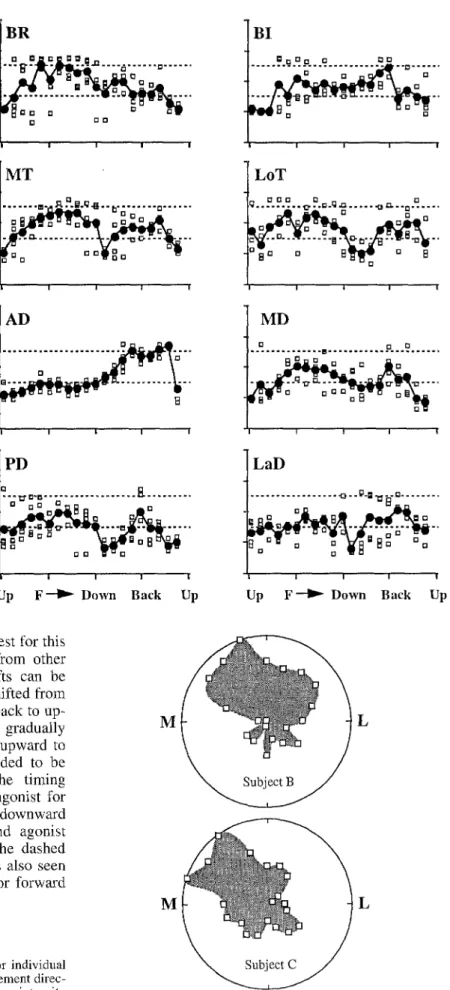
Fig. 7 The time of the largest intensity EMG burst for move- ments to targets in the frontal plane. Data from individual subjects are represented by
open squares; means are repre-
sented byfilled circles. The or- dinate scale is the same as in the bottom right panel of Fig. 6, with values expressed as percentage of movement time for each subject. The antagonist time zone is indicated by
dashed lines (BR brachioradia-
lis, BI biceps, MT medial head of triceps)
BR
0 D ~ D . o . . . . . . ~ ~ ~ . . . i i I i M T ... ... D D i i i ! A D e l l = El ~ D O 0 D . . PD D ~ 0 g . . . 9 D . . . - o - . . . . . . m . ~ . q 2". 2.Q..: ~ . . . 7 3B I
. . . ~ . . . ? E E . - . o . . . i J I I I e e c o o . . . .R l~l.g .. . . ! I | | M D . . . .o .. . . ~.. D O 0 I | I. ! L a D .o.m .. . . =.y. ~....=... Up L Down M Up Up L Down M Upbecame smaller than a later burst (black trace in the low- er left panel), which accounts for the discontinuity in the timing function. The timing plot shows, however, that from down to medial to up, the burst timing gradually changed from that of an antagonist to that of an agonist.
The bottom right panel of Fig. 6 shows that the timing of the largest AD burst was a continuous function of movement direction over a wide range of directions; burst timing is plotted against direction of movement in the sagittal plane. For upward and forward movements, burst timing was that of an agonist, i.e., the burst was centered on movement onset (0% movement time). For progressively downward and backward movements, the time of the burst gradually moved through the zone esti- mated to be the expected time of occurrence of an antag- onist burst (dashed lines). For backward movements, the intensity of phasic EMG was very low and the periods of largest activity occurred near the end of the movement.
The examples in Fig. 6 are representative of the re- suits from all subjects. Substantial variability between subjects in burst timing was usually confined to spatial regions where phasic activity was low and EMG traces contained no large bursts (making the timing difficult to
identify). However, despite the similar pattern of a given muscle across subjects, the different muscles exhibited a wide variety of temporal patterns.
Figures 7 and 8 show the timing of phasic EMG for all subjects, all muscles, and all directions, plotted in the format of the bottom right panel of Fig. 6, with the an- tagonist time zone indicated by dashed lines. The open symbols are data from individual subjects and the filled symbols are the means computed for each direction. For movements in the frontal plane, most of the muscles showed a region of gradual temporal shift (Fig. 7). For BI, activity was early for upward movements and late for downward movements, with a region of discontinuity in the lateral direction. A gradual transition took the timing from that of an antagonist to that of an agonist in the downward to medial to upward range. Similarly, for MD and PD there was a jump in the data between the agonist and antagonist regions, but the timing shifted gradually within each region.
In Fig, 8 (sagittal plane), it is readily apparent that AD showed the most consistent temporal shift: the data were remarkably similar across subjects. This may be partly due to the fact that signal-to-noise ratios in the
Fig. 8 The time of the largest intensity E M G burst, for move- ments to targets in the sagittal plane. Data from individual subjects are represented by
open squares; means are repre-
sented by filled circles. The time scale is the same as in Fig. 6, with the antagonist time zone indicated by dashed lines
(LoT tong head of triceps)
BR o I I 1 1 ~ II ~ I I . ~ "'" I~" ~ ' , 9 " O , . ~ . . . ,~ . . . [] . . . o . . I 1 I I M T ~ . . . , = u . q . . . i ~ . [ ~ . ~ . . . ~ . . . I i I i AD ! i I i' PD 0 ~ 0 [ ] I I I i Up F ~ D o w n B a c k Up BI . . . D . . . O D [ ] h . . . . I I I i L o T ~...~.~..~Y.~.~ ... ~ . . ~ . ~ .... [] [] D [ ] ~ G o i I 8 I i M D . ~ . . . . . . . ~ . . ~ . . . o ~ o I o i I L a D . . . . Q - - ~ - B - ~ [~- ~ . . . I I I I Up F ~ D o w n B a c k Up
surface EMG recordings were always the highest for this muscle. Despite the variability in the data from other muscles, regions of consistent temporal shifts can be seen in most cases. For example, BR timing shifted from antagonist to agonist time zones for down to back to up- ward directions. The timing of MD shifted gradually from agonist to antagonist time zones in the upward to forward range, while the timing of LaD tended to be more constant in this range. For LaD, the timing switched rather abruptly from that of an antagonist for forward movements to that of an agonist for downward movements, but in some subjects the second agonist burst was larger than the first (data above the dashed lines). Consistently large and late activity was also seen in BI for backward movements and in MT for forward movements.
Fig. 9 Anterior deltoid (AD) phasic spatial tuning for individual subjects. EMG levels are shown on polar plots of movement direc- tion. The phasic EMG level (open squares) was the mean intensity of the largest 100-ms-long burst. For AD data from the frontal plane, the existence of multiple lobes within the tuning curves for individual subjects was readily apparent
M
M
L
erontal t'lane
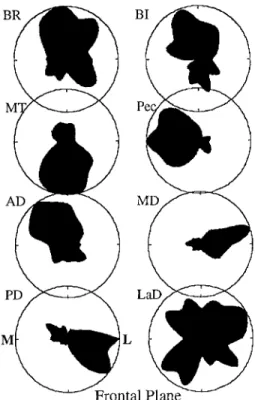
Fig. 10 Phasic spatial tuning for the frontal plane. EMG levels for eight muscles are shown on polar plots of movement direction. For each subject, the phasic EMG level was the mean intensity of the largest, lO0-ms-long burst. Data were averaged across four sub- jects. EMG intensity scale ranges from 0 to 100% of the mean maximum phasic activity for this plane
B
baglttal l:'lane
Fig. 11 Phasic spatial tuning for the sagittal plane. EMG levels
for eight muscles are shown on polar plots of movement direction, as in previous figures. For each subject, the phasic EMG level was the mean intensity of the largest, 100-ms-long burst. Data were av- eraged across four subjects. EMG intensity scale ranges from 0 to 100% of the mean maximum phasic activity for this plane
75 Phasic intensity tuning
Figures 9-11 show the spatial tuning of the intensity of the largest EMG burst, for fast movements in the sagittal and frontal planes. As explained in the methods section, the phasic data represent the mean EMG intensity during the 100-ms epoch containing the largest burst. It is ap- parent from these spatial tuning profiles that in most cases phasic EMG intensity could not be completely de- scribed by a double cosine function (cf. Figs. 1 and 4), which on these plots would appear as two circles in op- posite halves of the plot. In most cases the spatial tuning showed considerable distortion from a cosine function and showed nonopposite peaks.
The "multiple-peak" phenomenon seen in Figs. 10 and 11 is not simply due to averaging across the four subjects. Figure 9 shows an example where two subjects had multiple peaks in slightly different directions, but exhibited a roughly similar overall pattern. For this mus- cle (AD, frontal plane), the mean shown in Fig. 10 was a reasonable representation of the overall pattern. In gener- al, the occurrence and direction of multiple peaks was similar across the four subjects, and the mean appeared to be the most faithful representation of the behavior of each muscle.
In the full set of frontal plane data (Fig. 10), the oc- currence of multiple peaks was quite prominent. All data in Fig. 10 are four-subject means. In many cases, one peak clearly represented the spatial tuning of the first ag- onist burst, whereas a smaller, opposite peak represented the spatial tuning of the antagonist burst. As also shown above in Fig. 4, this was most clearly the case for MD, which was an agonist for lateral movements and an an- tagonist for medial movements. However, in other cases there appeared to be two or more peaks in the agonist di- rection (e.g., BR, BI, LaD) in consonance with a previ- ous report for tonic EMG under isometric conditions (Flanders and Soechting 1990).
For the sagittal plane data (Fig. 11), phasic EMG was often sharply tuned, in contrast to the broad spatial tun- ing usually reported for tonic EMG and motor cortical activity (e.g., Georgopoulos et al. 1982, 1983, 1986; Bu- chanan et al. 1986, 1989; Flanders and Soechting 1990). Sharp peaks were usually centered around movements straight back (LOT, MD, PD) but were also centered on movements straight forward (MD), and straight down (mw).
For the sagittal plane, only AD had tuning with the breadth of a cosine function. The main intensity peak was in the forward direction. However, even for this muscle, there was a narrow second peak in the down- ward direction. This separate downward peak was pres- ent in all four subjects. It is interesting to note that this clear separation between forward and downward peaks occurred in a spatial region where phasic timing changed gradually and smoothly (cf. Fig. 8). We will return to this point in the discussion.
For the sagittal plane data, the phasic spatial tuning shown in Fig. 11 resembled the "end-point" spatial tun-
@S a ittal @P
ane
Fig. 12 Final, static EMG levels (arbitrary units) at the end of movements to targets in the sagittal plane. The data were averaged across four subjects for each of eight muscles (see Materials and methods). The two curves on each plot represent EMG levels for fast Oqlled squares) and slow (open circles) movements to the same targets. The spatial tuning for fast and slow movements was nearly indistinguishable
ing shown in Fig. 12. Figure 12 illustrates static EMG levels, averaged across a 100-ms time window, starting 100 ms after the end of the movement. The data were av- eraged across the four subjects such that each data point represents the mean from about 20 trials for slow move- ments (open symbols) and about 40 trials for fast move- ments (filled symbols). The data in Figs. 11 and 12 are directly comparable because they are means across the same four subjects. The data were in fact, taken from the same trials, but the phasic data were obtained using the difference between fast and slow EMG waveforms.
An assumption underlying the subtraction approach is that the postural activity associated with fast and slow movements does not differ in its spatial tuning. If it did then the subtraction would distort the measurement of phasic spatial tuning. As a test of this assumption, Fig. 12 compares the end-point spatial tuning for fast (filled symbols) and slow (open symbols) movements in the sagittal plane, revealing that they were nearly identi- cal. A similar comparison for the frontal plane data (not
shown) also verified that end-point spatial tuning was the same for fast and slow movements. Combining data across both planes, fast-movement end-point EMG am- plitudes were only slightly larger (5.7%) than slow- movement end-point EMG amplitudes. This difference was not statistically significant (t-test, n=4, P>0.05).
Discussion
This report described the spatial tuning and timing of phasic EMG bursts. Our general approach follows a model in which phasic activity may be controlled sepa- rately from tonic activity, and intensity may be con- trolled separately from timing (Flanders 1991, 1993; Flanders and Herrmann 1992). In Figs. 4-11, we showed that each muscle has a distinct spatial and temporal pat- tern and that intensity and timing often fail to covary, e.g., timing can change gradually over a range of direc- tions where intensity exhibits two separate peaks (as in Fig. 4).
Cortical to motoneuronal transformations
Spatial tuning is an ubiquitous property of neurons in sensory and motor systems. In the motor system, spatial tuning is an important phenomenon that has been docu- mented for many of the cortical and subcortical areas in- volved in the control of arm movement (reviewed by Ge- orgopoulos 1991). Motor pattern generation obviously involves the participation of many neuronal structures, but, for reaching, activity in primary motor cortex has been studied the most thoroughly. Georgopoulos and col- leagues (1982, 1983, 1986) devised a method for fitting cosine functions to the spatial tuning of motor cortical units and combining data across units to compute a pop- ulation response. Although this population vector ap- proach has given a useful overview of cortical activity (e.g., Georgopoulos et al. 1989), not all motor cortical unit activity is well fit by unimodal cosine functions, and individual units exhibit a variety of temporal firing pat- terns. Temporal patterns of unit activity have been classi- fied in a continuum ranging from phasic to phasic-tonic to tonic (e.g., Kalaska et al. 1989; Cheney et al. 1991; Fetz 1992). It seems clear from the diversity of temporal patterns that various motor cortical units could preferen- tially influence motoneurons during different phases or for different aspects of the movement (i.e., acceleration, deceleration, posture). The degree of covariation in the spatial and temporal activities of cortical units remains an open question.
Somewhat less effort has been devoted to the charac- terization of the spatial tuning of muscle activation, and this may be the first full report of the spatial tuning of phasic EMG. For both distal and proximal muscles, tonic EMG intensity appears to be a broadly tuned function of movement or force direction (e.g., Buchanan et al. 1986, 1989). In a previous study of nine elbow and/or shoulder
muscles, Flanders and Soechting (1990) fit cosine func- tions to tonic EMG level versus direction of static force at the wrist. For all nine muscles, the data were often best fit with multiple cosine peaks. Since multimodal spatial tuning had not been reported for motor cortical units, we hypothesized that the spatial tuning of static EMG represented the convergence of multiple, descend- ing motor commands.
Neural network-type models of the "cortical to moto- neuronal" transformation would be simplified if one could assume that all neuronal activity in the motor system is cosine tuned for movement direction. This is a reasonable starting point, since dynamic shoulder and el- bow torques are nearly cosine tuned with movement di- rection (Fig. 1; and Buneo et al. 1995) and angles and torques are nearly cosine tuned with final hand position (Buneo et al. 1995; Flanders, unpublished observations). Knowing the preferred directions for the cortical neurons and the preferred directions for the motoneurons, the transformation between the two could be modeled as a weighted mapping. Although cosine tuning could be used as a first approximation, the results of the present study suggest that unimodal or even bimodat (opposite) cosine tuning may be an incomplete description of pha- sic muscIe activation.
This present description of multiple peaks in phasic spatial tuning needs to be followed by a full study of the mechanisms implied by these patterns. We are currently testing the hypothesis that multimodal tuning curves for surface EMG data represent the combined unimodal tuning curves of individual motor units. Ter Haar Romeny and colleagues (1982, 1984) demonstrated that different subpopulations of biceps motor units preferen- tially contribute to forces in different directions (flexion or supination; see also van Zuylen et al. 1988). There is also some recent evidence that the multiple peaks in the spatial tuning of AD represent the activities of different motor units (Theeuwen et al. 1994). However it is still possible that in some cases each peak represents a dif- ferent descending input onto a common group of motor units. For example, Garland and colleagues (1994) have reported a case where the agonist and antagonist bursts of one muscle are subserved by a common group of mo- tor units.
Differences between isometric force and movement Based on previous studies examining the dependence of arm muscle activity on movement or force direction (Wadman et al. 1980; Buchanan et al. 1986, 1989; Flan- ders 1991, 1993; Flanders and Soechting 1990), we ex- pected phasic EMG intensity to be either unimodal or bi- modal, and broadly tuned. In some cases, the spatial tun- ing of the intensity of phasic EMG bursts was not as broad as anticipated (Fig. 11). There are several possible explanations for the sharp peaks exhibited in LoT, MD, and PD for movements straight back. One is that the fi- nal position for this movement is near the extremes of
77
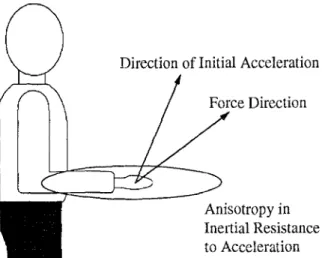
Direction of Initial Acceleration Force Direction
Anisotropy in Inertial Resistance to Acceleration Force Direction -> Direction of Initial Acceleration
Back
Down Down
Forward
Fig. 13 Schematic drawing of the differences between force di- rection and the direction of the resulting initial acceleration. The discrepancy is due to the anisotropy in the inertial resistance to movement. Inertia is least in the direction perpendicular to the forearm (up and down), where only the mass of the forearm resists acceleration. For the initial posture used in this experiment, inertia is greatest in the direction perpendicular to the upper arm (back and forward)
shoulder extension and elbow flexion and thus might in- volve forces in passive tissue. This explanation is sup- ported by the similarity between end-point (Fig. 12) and phasic (Fig. 11) tuning for these muscles and also goes along with the fact that phasic activity in these muscles, and also in BI, is unusually late for this direction (Fig. 8). Another explanation is that, when compared with previous studies using static force tasks, the sharp tuning of phasic EMG might be related to the force-ve- locity muscle characteristics encountered under dynamic conditions (reviewed by Wilkie 1956; Zajac 1989). In general, if movement time is nearly constant across di- rections, the directions with the largest joint excursions will require a disproportionately large increase in EMG, due to the increase in joint angular velocity, and the ve- locity of muscle shortening.
A third explanation for differences in breadth of tun- ing between movement and isometric conditions relates to the lack of homogeneity in the inertial resistance to arm movements in various directions. This is illustrated schematically in Fig. 13. In the top panel we show a dia- gram of the arm in the initial posture used in this study: upper arm vertical, forearm horizontal. For hand paths in the sagittal plane, the largest inertial resistance is straight back and straight forward (as indicated by the large el-
lipse). This implies that movements in different direc- tions have different force requirements. This anisotropy is not encountered when producing static forces in vari- ous directions.
Another implication of the inertial anisotropy is that the directional tuning of a given muscle cannot be easily compared between movement and isometric conditions. With the exception of the up-and-down and forward-and- back directions, a force in a particular direction will lead to an initial acceleration in a somewhat different direc- tion (Fig. 13, top panel). The discrepancy between force and the resulting acceleration varies as a nonlinear func- tion of movement direction (Fig. 13, bottom panel). This phenomenon has been pointed out by several groups; the schematic in Fig. 13 was computed using the equations published in Karst and Hasan (1991 a).
Temporal patterns
The bottom panel in Fig. 4 shows the temporal pattern that would have resulted if phasic EMG bursts had been organized according to a classic reciprocal pattern. Al- though phasic muscle activity for wrist movements may be organized in a fixed time-frame (Hoffman and Strick 1986), it has been shown that for multi-joint movements, the time between the onset of shoulder muscle EMG and the onset of elbow muscle EMG changes with the direc- tion of the reach (Wadman et al. 1980; Karst and Hasan 1991b). The present study shows that temporal relations across different shoulder muscles also change as a func- tion of movement direction. In a recent note we illustrat- ed this using AD and LaD data from the sagittal plane (Flanders et al. 1994). In this present report we showed that the same is true for movements in the frontal plane (Figs. 4-7). We also showed the full set of timing data for four subjects and 40 directions (Figs. 7-8). These da- ta showed regions where timing changed as a continuous function of movement direction and each muscle exhibit- ed a somewhat different pattern.
The continuous temporal shift in the surface EMG signal could result from a gradual time delay of activity in a common group of motor units. Alternatively, units could exhibit a temporal fractionation (each firing during a fixed phase of the movement) and the temporal shift could be caused by selective recruitment and derecruit- ment of subpopulations of units. This issue can be relat- ed to the hypothesized mechanism for multiple peaks in the phasic spatial tuning. If, as discussed above, different peaks of spatial tuning represent activities of different motor units, then a temporal shift across peaks would in- volve a temporal fractionation across units. For example, for MD in the frontal plane (Fig. 4), going clockwise from medial to up to lateral, there was a dramatic discon- tinuity in the intensity tuning that may represent the ac- tivities of separate motor units (Fig. 10). At the same time, there appeared to be little discontinuity in the tim- ing. Likewise, for AD in the sagittal plane, there were two separate (forward and downward) peaks in the pha-
sic intensity tuning in the region of a large and apparent- ly continuous temporal shift (compare the AD plots in Figs. 11 and 8, for forward to downward directions). Based on the unit study of Gielen and colleagues (Theeuwen et al. 1994) these two separate peaks in AD may represent the activities of separate subpopulations of motor units. If our interpretation is correct, the gradu- al temporal shift results from a gradual change in the rel- ative contributions of two subpopulations of motor units, each with fixed timing.
Although a more complete calculation (e.g., consider- ing muscle mechanics and minimizing total muscle force) could potentially lead to different predictions, the temporal shift in phasic EMG activation does not seem to be completely dictated by the mechanical require- ments (at least for movement in the sagittal plane). As we showed in Fig. 1, straight hand paths in various direc- tions could theoretically be achieved by a relatively sim- ple pattern of joint torque, which switches abruptly from a flexion to extension propulsive region without a gradu- al temporal shift. However, we also showed that hand paths are not straight (Fig. 3). Shoulder torques comput- ed from the actual curved hand paths show a gradual temporal shift corresponding to the pattern of phasic EMG (Soechting and Flanders 1997). In the following paper (Pellegrini and Flanders 1996) we will show that a temporal shift in phasic EMG persists under dynamic isometric conditions where, from a mechanical perspec- tive, it would seem to be suboptimal. This suggests that the tendency for gradual temporal variation may repres- ent a robust neuromuscular control strategy.
Acknowledgements This work was supported by the National In- stitute of Neurological Disorders and Stroke, grant R01-NS27484. We thank John Soechting for his careful and critical reading of the manuscript.
References
Buchanan TS, Almdale DPJ, Lewis JL, Rymer WZ (1986) Char- acteristics of synergic relations during isometric contractions of human elbow muscles. J Neurophysiol 56:1225-1241 Buchanan TS, Royal GP, Rymer WZ (1989) Strategies for muscle
activation during isometric torque generation at the human el- bow. J Neurophysio162:1201-1212
Bunco CA, Soechting JF, Flanders M (1994) Muscle activation patterns for reaching: the representation of distance and time. J Neurophysiol 71:1546-1558
Buneo CA, Boline J, Soechting JF, Poppele RE (1995) On the form of the internal model for reaching. Exp Brain Res
104:467-479
Cheney PD, Fetz EE, Mewes K (1991) Neural mechanisms under- lying corticospinal and rubrospinal control of limb move- ments. Prog Brain Res 87:213-252
Fetz EE (1992) Are movement parameters recognizably coded in the activity of single neurons? Behav Brain Sci 15:679-690 Flanders M (1991) Temporal patterns of muscle activation for arm
movements in three-dimensional space. J Neurosci 11:2680- 2693
Flanders M (1993) Shoulder muscle activity during natural arm movements: What is optimized? In: Matsen FA (ed) The shoulder: a balance of mobility and stability. American Acade- my of Orthopaedic Surgeons, Rosemont, IL, pp 635-645
Flanders M, Herrmann U (1992) Two components of muscle acti- vation: scaling with the speed of arm movement. J Neuro- physiol 67:931-943
Flanders M, Soechting JF (1990) Arm muscle activation for static forces in three-dimensional space. J Neurophysiol 64,
1818-1837
Flanders M, Pellegrini JJ, Soechting JF (1994) Spatial/temporal characteristics of a motor pattern for reaching. J Neurophysiol 71:811-813
Garland S J, Cooke JD, Ohtsuki T (1994) Lack of task-related mo- tor unit activity in human triceps brachii muscle during elbow movements. Neurosci Lett 170:1-4
Georgopoulos AP (1991) Higher order motor control. Annu Rev Neurosci 14:361-377
Georgopoulos AR Kalaska JR Caminiti R, Massey JT (1982) On the relations between the direction of two-dimensional arm movements and cell discharge in primate motor cortex. J Neu- rosci 2:1527-1537
Georgopoulos AP, Caminiti R, Kalaska JF, Massey JT (1983) Spa- tial coding of movement: a hypothesis concerning the coding of movement direction by motor cortical populations. Exp Brain Res [Suppl] 7:327-336
Georgopoulos AR Schwartz AB, Kettner RE (1986) Neuronal pop- ulation coding of movement direction. Science 233:1416-1419 Georgopoulos AP, Lurito J, Petrides M, Schwartz AB, Massey JT
(1989) Mental rotation of the neuronal population vector. Sci- ence 243:234-236
Haar Romeny BM ter, Denier van der Gon JJ, Gielen CCAM (1982) Changes in recruitment order of motor units in the hu- man biceps muscle. Exp Neurol 78:360-368
Haar Romeny BM ter, Denier van der Gon JJ, Gielen CCAM (1984) Relations between location of a motor unit in the hu- man biceps brachii and its critical firing levels for different tasks. Exp Neurol 85:631-650
Hoffman DS, Strick PL (1986) Activity of wrist muscles during step-tracking movements in different directions. Brain Res 367:287-291
79 Kalaska JF, Cohen DA, Hyde ML, Prud'homme MA (1989) Com- parison of movement direction-related versus load direction- related activity in primate motor cortex using a two-dimen- sional reaching task. J Neurosci 9:2080-2102
Karst GM, Hasan Z (1991a) Initiation rules for planar, two-joint arm movements: agonist selection for movements throughout the work space. J Neurophysiol 66:157%1593
Karst GM, Hasan Z (1991b) Timing and magnitude of electro- myographic activity for two-joint arm movements in different directions. J Neurophysiol 66:1594-1604
Pellegrini JJ, Flanders M (1996) Force path curvature and con- served features of muscle activation. Exp Brain Res 110:80- 90
Shadmehr R, Mussa-Ivaldi FA (1994) Adaptive representation of dynamics during learning of a motor task. J Neurosci 14:3208-3224
Soechting JF, Buneo CA, Herrmann U, Flanders M (1995) Moving effortlessly in three dimensions: does Donders' law apply to arm movement? J Neurosci 15:6271-6280
Soechting JF, Flanders M (1997) Evaluating an integrated muscu- loskeletal model of the human arm. J Biomech Eng (in press) Theeuwen M, Gielen CCAM, Miller LE, Doorenbosch C (1994)
The relation between the direction dependence of electromyo- graphic amplitude and motor unit recruitment thresholds dur- ing isometric contractions. Exp Brain Res 98:488-500 Wadman WJ, Denier van der Gon JJ, Derksen RJA (1980) Muscle
activation patterns for fast goal-directed arm movements. J Hum Mov Stud 6:19-37
Wilkie DR (1956) The mechanical properties of muscle. Br Med Bull 12:177-182
Zajac FE (1989) Muscle and tendon: properties, models, scaling, and application to biomechanics and motor control. Crit Rev Biomed Eng 17:359411
Zuylen EJ van, Gielen CCAM, Denier van der Gon JJ (1988) Co- ordination and inhomogeneous activation of human arm mus- cles during isometric torques. J Neurophysiol 60:1523- 1548