NBER WORKING PAPER SERIES
MUTUAL FUND TAX CLIENTELES Clemens Sialm
Laura Starks Working Paper 15327
http://www.nber.org/papers/w15327
NATIONAL BUREAU OF ECONOMIC RESEARCH 1050 Massachusetts Avenue
Cambridge, MA 02138 September 2009
The authors thank Federico Belo, Li Jin, Jennifer Huang, Sheridan Titman, and seminar participants at the Australian National University, the City University of Hong Kong, the College of William and Mary, Dartmouth College, the Hong Kong University of Science and Technology, Notre Dame, Southern Methodist University, Texas A&M University, the University of Texas at Austin, the University of Toronto, and conference participants at the European Summer Symposium on Financial Markets in Gerzensee, the ISCTE Business School – Nova Annual Finance Conference on Mutual Funds and Investment Management in Lisbon, and the University of Oregon Institutional Investor Conference for helpful comments. The views expressed herein are those of the author(s) and do not necessarily reflect the views of the National Bureau of Economic Research.
NBER working papers are circulated for discussion and comment purposes. They have not been peer-reviewed or been subject to the review by the NBER Board of Directors that accompanies official NBER publications.
Mutual Fund Tax Clienteles Clemens Sialm and Laura Starks NBER Working Paper No. 15327 September 2009
JEL No. G11,G12,G23,G35,H24
ABSTRACT
Mutual funds are pooled investment vehicles with diverse tax clienteles. Whereas many mutual funds are held primarily by taxable investors, a significant fraction of mutual fund assets are held in tax-qualified retirement accounts. Our paper investigates whether the characteristics, investment strategies, and performance of mutual funds held by diverse tax clienteles differ. Examining both mutual fund income distributions and mutual fund holdings, we find that funds held primarily by taxable investors tend to be more tax-efficient than funds held primarily in tax-deferred retirement accounts. Despite these differences, we find no evidence that any investment constraints that may arise from the funds that pursue tax efficient management strategies result in performance differences between funds held by different tax clienteles.
Clemens Sialm
University of Texas at Austin McCombs School of Business 1 University Station; B6600 Austin, TX 78712
and NBER
[email protected] Laura Starks
University of Texas at Austin McCombs School of Business 1 University Station; B6600 Austin, TX 78712
The preferences of portfolio managers’ clientele should be an important part of the managers’ investment strategies. For example, portfolio managers with high net worth or trust clients commonly consider tax effects in making investment decisions. On the other hand, managers of defined benefit pension plans have no need to consider tax effects because the portfolio is not taxed on capital gains or dividends. The decisions of both of these groups of portfolio managers are straightforward as they can focus on the tax consequences (or lack of tax consequences) in their portfolio decisions. Mutual fund portfolio managers, however, face a more complicated task. The complication is caused in part because mutual funds are pooled investment vehicles with potentially diverse tax clienteles and in part because their incentives may encourage them to ignore their investors’ tax situations.
From the taxable shareholder’s perspective, the choice of mutual fund may depend on the fund’s tax efficiency. Empirical evidence suggests that this is the case – the tax efficiency of mutual funds is important for shareholders’ mutual fund choice. Morningstar provides mutual fund investors with information on funds’ embedded capital gains (termed “capital gains overhang”) and these tax burdens appear to affect investor inflows as documented by Bergstresser and Poterba (2002). In our sample, the average annual tax burden of a mutual fund (taxes on dividends and capital gains) is about 1.25%. This burden is the same order of magnitude as the average fund’s expense ratio in our sample as well as previous estimates of trading costs, yet although the expense ratio and
trading costs have received substantial attention in recent literature, the tax burden has received relatively little.1
The decisions of mutual fund managers as well as their shareholders have become more complicated in recent years due to the increase in diversity of the shareholders’ tax status. The increased diversity is a result of the large growth in tax-deferred assets being invested in mutual funds. Investment in 401(k) and other defined contribution retirement plan accounts has grown significantly since the plans were first given special tax treatment by a 1978 change in the tax code, and has grown even more so over the last two decades from about $1 trillion in 1991 to $4.5 trillion by 2007, before dropping back to $3.5 trillion at the end of 2008. Moreover, more than half of the 2007 total was invested in mutual funds before dropping lower in 2008. This overall growth of tax-deferred assets in mutual funds has resulted in increasing proportions of defined contribution assets in equity mutual funds, reaching almost 27 percent by 2008.2 Despite the potential changing perspectives of the mutual fund managers and shareholders, there has to date been little research on whether the investment strategies of mutual funds differ according to their tax clienteles.
In this paper we examine whether the presence of tax-deferred assets affects the strategies of the mutual funds in which they are primarily invested. We address the question of whether systematic differences exist in the investment strategies or performance of mutual funds according to the relative degree of defined contribution assets in the funds. We hypothesize such differences should exist because of differences
1 See, for example, Sirri and Tufano (1998), Edelen (1999), Chalmers, Edelen and Kadlec (2001), Deli
(2002), Deli and Varma (2002), Barber, Odean and Zhang (2005), Foster, Gallagher, and Looi (2005), Christoffersen, Keim and Musto (2006), Edelen, Evans, and Kadlec (2007), Chan, Faff, Gallagher, and Looi (2008).
in shareholder tax preferences. If the tax preferences are unimportant to the managers and investors, then we would expect no systematic differences across the mutual funds. Related to this hypothesis is the question of the source of the systematic differences. These differences could arise due to mutual fund managers choosing tax efficient strategies because of their investors’ preferences or due to the mutual fund investors choosing funds based on their tax efficiency.
To address these questions we first examine whether the characteristics of mutual funds differ according to their proportions of defined contribution assets. Mutual funds in defined contribution plans are typically chosen to be included on a menu by plan sponsors and then selected in individual plans by the plan participants. Thus, one would expect that the preferences of both the plan sponsors and participants would be reflected in the characteristics of the mutual funds so chosen. In line with this expectation, we find significant differences in the characteristics of mutual funds with high versus low levels of defined contribution assets. For example, funds held extensively in DC plans tend to have lower expense ratios and lower load fees, have greater assets under management, be part of larger families of funds, and be better diversified as compared to the funds with lower defined contribution assets. These results support the hypothesis that plan sponsors or fund investors effectively screen the mutual funds included in DC plans.
We then examine whether the mutual fund managers’ investment strategies are related to the composition of their shareholder base by examining two outcomes of the fund managers’ investment decisions. We investigate the funds’ distributions (capital gain distributions and dividend distributions) and their disclosed equity holdings to determine whether fund shareholder tax status is related to the time horizon of the
holdings. Our results document differences in investment strategies between funds with high amounts of defined contribution assets and those with low amounts. Examining both distributions and mutual fund holdings, we find that mutual funds with primarily defined contribution accountholders tend to be less tax-efficient than funds held primarily by taxable investors as would be expected if either mutual fund managers or fund investors were considering tax consequences. In particular, we find that capital gain distributions are increasing in the proportion of defined contribution assets in the fund and that mutual funds held primarily by taxable investors have higher propensities to realize capital losses.
To examine whether the principal source of these differences in investment strategies is the decision of the mutual fund manager or the investor, we examine changes in funds’ investment strategies after an exogenous event. If substantial numbers of mutual fund managers are making at least some investment strategy decisions based on their clienteles’ tax status, then we would expect to see changes in investment strategies after a change in the tax code that affects their clientele. After the 2003 legislative tax reforms, which reduced capital gains and dividend taxes, we find systematic differences across mutual funds in their investment strategy changes. Specifically, we find that mutual funds with low levels of defined contribution assets increased their relative propensities to realize long-term capital gains and to hold high-dividend stocks.
Finally, we address the question of whether the fund’s performance is related to the tax status of its participants. We hypothesize that maintaining the tax efficiency of a mutual fund may constrain the managers’ investment strategies, resulting in their having to give up return to achieve tax efficiency. We test whether fund performance differs
according to their shareholders’ tax status We find no significant return differences according to the tax clientele, suggesting that any tax efficiency constraints do not appear to have costs in terms of lower before-tax returns.
Our paper is related to several literatures. First, it is related to the literature on whether mutual fund investors take tax effects into account in their investment decisions. We examine whether mutual funds differ across the taxability of the investors.3 Second, our paper is related to the literature on mutual fund managers’ investment decisions in light of the tax consequences. This literature has provided evidence that mutual fund managers appear to consider taxes in their decisions, but that the decision is complex.4 Barclay, Pearson, and Weisbach discuss the conflict that mutual fund managers face in determining their capital gains distribution policy, arguing that managers have an incentive to realize some capital gains (reducing the capital gain overhang) in order to attract prospective investors. Their empirical evidence supports their arguments. Dickson, Shoven, and Sialm (2000) analyze tax externalities of mutual funds across investors and show that these tax externalities are important determinants of the after-tax performance of equity mutual funds. Three other papers employ the actual trading of mutual fund managers in order to infer whether they consider the tax consequences of their decisions. Gibson, Safieddine, and Titman (2000) find evidence of mutual fund managers engaging in tax loss selling just before a year end. Huddart and Narayanan (2002) find differences in the propensities to realize capital gains between mutual funds
3 See, for example, Dickson and Shoven (1995), Bergstresser and Poterba (2002), Barber and Odean
(2003), Ivkovic, Poterba and Weisbenner (2005), Johnson and Poterba (2008), Fong, Gallagher, Lau, and Swan (2009), and Ivkovic and Weisbenner (2009).
4 In addition, the tax burden can have an effect on other decisions by mutual fund managers. Khorana and
and tax-exempt institutions. The results of both of these papers suggest that the mutual fund managers pay attention to the tax consequences of their investment decisions. Another paper that considers the tax decisions of mutual fund managers is that of Christoffersen, Geczy, Musto and Reed (2005) who find that in 2003 managers’ decisions with respect to cross-border dividend payments differ according to the proportion of defined contribution assets in their funds. Finally, our paper is related to the literature on the tax selling by institutional investors.5
We examine the question of whether mutual fund managers consider their tax clienteles from a different perspective. We examine whether mutual fund characteristics, investment strategies, and performance vary systematically with the proportion of defined contribution assets in mutual funds over the 1997 through 2006 time period. An important distinction is that in our analysis rather than examining the investment decision itself to infer whether managers consider taxes, we examine the tax outcome of the investment decision in terms of the dividend and capital gain distributions including the timing of these distributions.
In the next section we describe our data, followed by Section II in which we present our empirical results on the determinants of defined contribution assets across mutual funds. In Section III we examine whether differences in investment strategies exist and in Section IV we examine whether differences in performance exist. We conclude in Section V.
5 See, Jin (2006), Desai and Jin (2008), Sikes (2008), and Cohn and Sikes (2009). Neither of these papers
include mutual funds in their institutional investor samples. Further, evidence exists that institutional investors have some preferences regarding a firm’s dividend policy, which would also be consistent with managers considering the tax effects on their investors (e.g., Del Guercio, 1996, Gompers and Metrick, 2001, Bennett, Sias and Starks, 2003, Grinstein and Michaely, 2005, and Brav, Graham, Harvey, and Michaely, 2005).
I. Data
The main data source for the size of the mutual fund assets in the Defined Contribution (DC) retirement accounts is based on the annual survey of mutual fund families by the publication Pensions & Investments.6 Since 1997, Pensions &
Investments has conducted an annual survey of mutual fund families that manage DC
contribution plans. The surveys ask the mutual fund families to report the total assets managed in DC accounts for the mutual funds most used by DC plans in broad investment categories (Domestic Equity Funds, Domestic Fixed Income Funds, International Equity Funds, Balanced Funds, Money Market Funds). We obtain data for the surveys between 1997 and 2006, which cover the assets managed in DC plans as of December 31st of the year prior to the survey date. Fund families are asked to list the dollar amount of DC plans in the funds.7 Generally, mutual fund families are asked in the survey to report the DC plan assets for the twelve funds in each category with the largest DC assets. Therefore, for the largest fund families, we do not have DC assets for all of their funds. However, we can surmise from our data that the unlisted funds in these families tend to have relatively low DC assets.
We focus on actively-managed domestic equity funds held by families that participate in the annual surveys.8 For example, in 2006, 63 mutual fund families,
6 We thank David Klein from Pensions & Investments for providing us with the survey data. Additional
information about the survey can be obtained from the website at http://www.pionline.com. The same data source has been used previously by Christoffersen, Geczy, Musto and Reed (2005) in their study of managers’ decisions with respect to cross-border dividend payments in 2003.
7 This specifically excludes assets in IRAs, Keoghs and SARSEPs, sponsoring company stock, and assets
under administration.
8 Focusing on equity mutual funds does not allow us to address the location of assets between taxable and
including the three largest mutual fund DC providers: Fidelity, Capital Research & Management, and Vanguard, participated in the survey. These 63 mutual fund families reported the DC plan assets for 550 equity mutual funds in 2006.
We merge the survey data with the CRSP Survivorship Bias Free Mutual Fund database using the funds’ ticker symbols and names. In addition, we merge the CRSP database with the Thomson Financial CDA/Spectrum holdings database and the CRSP stock price database using the MFLINKS file based on Wermers (2000) and available through the Wharton Research Data Services. The CRSP mutual fund database includes information on fund returns, total assets under management, fees, investment objectives, and other fund characteristics. The Thomson Financial database provides long positions in domestic common stock holdings of mutual funds. The data are collected both from reports filed by mutual funds with the SEC and from voluntary reports generated by the funds. The majority of the mutual funds in our sample disclose their portfolio holdings at a quarterly frequency over the sample period.
To focus our analysis on actively-managed domestic equity mutual funds, we eliminate balanced, bond, index, international, money market, and sector funds, as well as funds not invested primarily in equity securities.9 To avoid the incubation bias described by Evans (2006), we exclude funds which in the previous month manage less than $10 million, funds with missing fund names in the CRSP database, and funds where the year for the observation is in the same year or in an earlier year than the reported fund starting year. For funds with multiple share classes, we combine the classes into one observation
location decisions are analyzed empirically by Barber and Odean (2003) and Bergstresser and Poterba (2004).
9 We select funds according to their S&P objectives: Domestic Equity Funds (AGG, GMC, GRI, GRO,
ING, SCG). Mutual funds that, on average, hold less than 80 percent of common stocks are eliminated. The classification of index funds is made according to the fund names.
for fund and compute the fund-level variables by aggregating across the different share classes. Finally, we only include equity mutual funds from fund families that participate in the Pensions & Investments surveys.
Our sample includes 6,811 fund-year observations between 1997 and 2006 from 1,348 distinct equity mutual funds. Since mutual funds are only asked to give the DC assets for a limited number of funds, we have DC values for 3,554 fund-year observations. However, the funds with reported DC asset values account for 87.1 percent of the assets under management of the surveyed fund families.
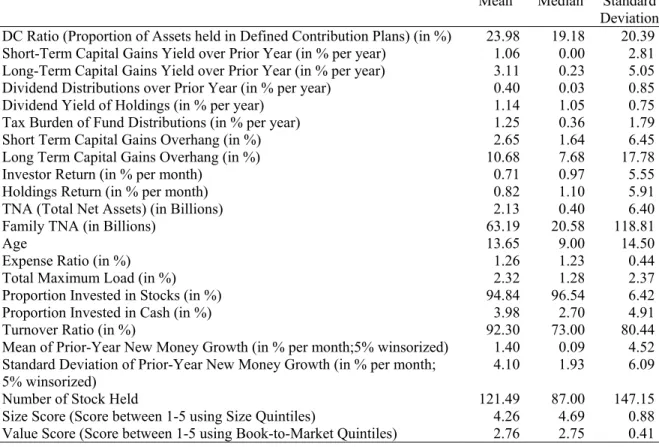
Table I provides summary statistics for the sample fund characteristics. The equal-weighted mean of the proportion of assets held in DC plans is 24 percent with a median of 19 percent. The size of these statistics suggests that managers should be aware of their tax clientele differentials. Figure 1 shows the distribution of the proportions of assets held in DC plans across mutual funds. Panel A summarizes the distribution by the number of funds and Panel B by the funds’ total assets under management. Panel A of Figure 1 shows that although funds have a relatively small proportion of DC assets, there are also a number of funds with substantial proportions. Panel B of Figure 1 shows that large funds tend to be over-represented in DC plans and the weighted average by assets under management equals 31 percent. The proportion of assets held in DC plans does not represent all assets held in tax-qualified accounts because mutual funds can be held in Individual Retirement Accounts (IRAs), Keoghs, and other tax-qualified investment vehicles.
An important consideration in examining mutual fund managers’ investment decisions is the way in which mutual fund income is considered under tax law. Although
mutual funds are considered corporations, there is usually no double taxation of their income because according to the Investment Company Act of 1940, mutual funds registered under the Act can pass-through their dividend and capital gains income to the fund shareholders on an annual basis. Thus, an investment company distributing all its realized income to its shareholders would have no tax liability. However, these distributions are taxable to the mutual fund shareholder, whether or not that shareholder had been holding the stock when the gain was received. Thus, when funds realize capital gains, they accelerate the payment of taxes on those gains for their current shareholders. Alternatively if the funds have price appreciation on their shares, but have not sold them, they have a capital gain tax “overhang” that is faced by current shareholders as well as future shareholders.
We obtain the distributions of dividends and short- and long-term capital gains from the CRSP mutual fund database. In a few cases (representing only 2.4 percent of the total value of capital gains distributions), the CRSP mutual fund database does not classify the term of the capital gains. In these cases, we assume that unclassified gains correspond to long-term capital gains.
Table I also gives the summary statistics for the funds’ capital gains and dividend distribution yields over the prior year. We compute the capital gains and dividend yields of each individual distribution as the distribution amount divided by the net asset value (NAV) immediately prior to the distribution. The distribution yields throughout the year are then added to obtain annual distribution yields. Mutual funds in our sample distribute on average 1.06 percent of their initial value as short-term capital gains and 3.11 percent as long-term capital gains. Figure 2 depicts the time series variation in these distributions
over our sample period. It shows that there were large variations over time, with higher yields in the late 1990s, falling to very low yields after the market downturn in 2000, and then climbing back up with market appreciation. Table I also shows that dividend distributions amount on average to 0.40 percent of the initial value of a fund. According to Figure 2, this amount remains relatively stable over the sample period with some decrease early and then a slight increase after 2003. These dividend distributions are relatively small because mutual funds commonly subtract fund expenses before making the distributions. As an alternative measure we compute the dividend yield of the fund’s holdings, which is the weighted average dividend yield of the fund’s equity positions. This dividend yield proxies for the dividend yield of a fund prior to subtracting their expense ratio. Over our sample, the dividend yield based on the holdings averages 1.14 percent per year.
To obtain a measure of the overall tax costs of an equity mutual fund, we define the tax burden (TB) as:
LCG t LCG t f SCG t SCG t f DIV t DIV t f t f y y y TB , = , τ + , τ + , τ , (1)
where yDIV, ySCG, and yLCG are the dividend and short- and long-term capital gains distribution yields, and τDIV, τSCG, and τLCG are the average marginal tax rates on dividends, and short- and long-term capital gains for taxable investors, as described in Sialm (2008). The average marginal tax rates are defined as the weighted averages of the marginal tax rates of investors in different income brackets, where the weights correspond to the declared amounts of dividends and capital gains. The tax rates include the impact of federal and state taxes. The tax burden measures the tax costs from dividend and capital gains taxation as a percentage of the assets under management.
However, the tax burden captures only the direct tax costs based on mutual fund distributions. It ignores any tax costs that occur if an investor liquidates a mutual fund and realizes additional capital gains on the mutual fund trades.
Figure 3 summarizes the time-series variation of the average marginal dividend and capital gains tax rates since 1997. The most significant change in tax laws over our sample period was the Jobs and Growth Tax Relief Reconciliation Act (JGTRRA) of 2003, which reduced the marginal federal tax rate on qualified dividends and long-term capital gains to 15 percent.
The annual tax burden has a mean of 1.25 percent and a standard deviation of 1.79 percent. Around one-quarter of mutual funds do not make any taxable distributions, one-quarter of funds have tax burdens exceeding 2.00 percent per year, and ten percent of funds have tax burdens exceeding 3.59 percent per year. It is notable that the annual tax costs of mutual funds are of a similar order of magnitude as their annual expense ratios. However, the tax burden exhibits significantly higher cross-sectional variation than the expense ratio. Moreover, although fund expenses have received a great deal of attention in the literature (e.g., French, 2008; and Fama and French, 2008), the tax burden of mutual funds has not obtained nearly as much attention.
Using the equity holdings from Thomson Financial over the period from 1980 through 2006, we obtain a measure of the short- and long-term capital gains overhang of a mutual fund. Specifically, at the end of every quarter we compute for each equity position the unrealized capital gain as the percentage difference between the current price of the position and the price of the position on the last trading day in the quarter the position was acquired. If the current position was acquired across multiple quarters, then
we compute the weighted average capital gain of the different lots. An unrealized capital gain is classified as short-term if the position has been held for less than four quarters. The unrealized short-term and long-term capital gains are then aggregated over all stock positions of a fund. As Table I shows, the short- and long-term capital gain overhangs equal 2.65 and 10.68 percent, respectively. The large standard deviations of these capital gain overhangs indicate that there are significant cross-sectional differences in tax overhangs across funds.
Table I reports additional summary statistics for fund characteristics used in our paper. The average return of mutual funds based on the CRSP database equals 0.71 percent per month with a monthly standard deviation of 5.55 percent. We also compute the gross holdings return based on the most recently disclosed quarter-end Thomson equity holdings and the asset allocation weights from CRSP. The holdings database includes long positions in domestic common stocks and excludes other non-equity holdings. To adjust fund holdings returns for various asset classes, we proxy for these asset returns using published indices. For bonds and preferred stocks we use the total return of the Lehman Brothers Aggregate Bond Index, while for cash holdings and other assets we use the Treasury bill rate. The mean gross holdings return equals 0.82 percent per month and has a correlation of 96.4 percent with the net investor return across the mutual funds in our sample.
The mean of Total Net Assets (TNA) equals $2.13 billion, although the median is about $400 million. The average fund family in our sample manages $63.19 billion in equity funds. The average age of a fund is 13.65 years with a standard deviation of 14.50 years. The mean expense ratio is 1.26 percent per year and the mean turnover ratio is
about 92 percent per year. Not surprisingly, since we focus on equity funds, the vast majority of the assets are invested in common stocks (94.84 percent) and cash (3.98 percent). Bonds, preferred stocks, and other securities comprise a relatively small proportion of the total holdings.
Based on the CRSP data we compute the new money growth (NMG), which is defined as the growth rate of the assets under management after adjusting for the appreciation of the mutual fund’s assets (RFt), assuming that all the cash flows are
invested at the end of the period:
(
)
1 , , 1 , , , 1 − − + − = t f t f t f t f t f TNA RF TNA TNA NMG (2)Since estimated fund flows are very volatile, we winsorize both the top and the bottom parts of the distribution at the 2.5 percent level. The winsorized new money growth rate has a mean of 1.40 percent per month and a standard deviation of 4.10 percent over the prior year.
The number of stocks held by a mutual fund is computed based on the holdings information from Thomson Financial. The average fund holds approximately 121 stocks.
We also summarize holdings-based style characteristics for the mutual funds in our sample. Each stock listed in CRSP is grouped into respective quintiles according to its market value (using NYSE cutoff levels) and its industry-adjusted book-to-market ratio. Using the quintile information, we compute the value-weighted size and value scores for each mutual fund in each period following Kacperczyk, Sialm, and Zheng (2005). For example, a mutual fund that invests only in stocks in the smallest size quintile has a size score of one, whereas a mutual fund that invests only in the largest size quintile has a size score of five. Mutual funds in our sample tend to hold stocks in the largest size quintile.
II. Determinants of Defined Contribution Assets in Mutual Funds
The sponsors of defined contribution plans offer the participants a menu of investment opportunities and the participants choose their investments from these menus. According to a survey of plan sponsors by Deloitte Consulting (2006), 17 percent of the responding plans had fewer than 10 investment options, while 19 percent of plans had at least 20 investment options. Most of the options in the plans were mutual funds. Thus, the presence of defined contribution assets in a mutual fund depends on the choices of both the plan sponsor and the individual participant.
The first question we address is whether certain mutual fund characteristics attract plan sponsors and participants to a particular fund. For each year in our sample, we divide the mutual funds into quartiles according to the ratio of defined contribution assets to total assets invested in the fund. We then calculate the averages of the mutual fund characteristics for each quartile and average across the years. We present these statistics in Table II. Since we do not have DC ratios for all the funds, in the first column we include average characteristics for a fifth group, the funds with missing data (which by definition should be funds with low or no amounts of defined contribution assets because they were not reported as one of the funds with a significant amount of such assets). In the middle four columns of the table we show the average characteristics for the defined contribution quartiles. The last column reports the differences in the characteristics between the top and the bottom quartile and the standard errors clustered by fund. Overall the results show that defined contribution assets are a significant portion of many
funds’ assets under management. The bottom quartile has an average DC ratio of 4.49 percent and the top quartile has a DC ratio of 52.62 percent of total assets.
Table II also shows that many of the mutual fund characteristics differ significantly across the groups. The funds in the highest DC ratio quartile have lower expenses, lower maximum loads, greater assets under management, are part of larger fund complexes, and have a larger number of stocks in the portfolio. Mutual funds extensively held in DC plans also have significantly lower turnover levels, despite the fact that the portfolio managers of such funds should not be as worried about the tax consequences of trading activities in their portfolios.
Funds with relatively high DC assets tend to have a lower mean growth rate of new money, probably because they tend to be significantly larger. Furthermore, the standard deviation of the new money growth rate is also slightly lower for funds with above median DC assets. This result might occur because retirement flows are smoother than non-retirement flows into mutual funds.
Many reasons exist for mutual fund managers to trade securities other than for tax purposes. To capture some of these reasons we examine other characteristics of the mutual fund holdings for differences across the DC asset groups. We calculate the average percentage stock and cash allocations in each group as well as the size and value scores of their equity positions (based on the holdings). We do not find significant differences in the asset allocations and the investment styles of the various funds. While the former would be expected since our sample is restricted to funds with at least 80% allocation to equities, the latter result suggests that there does not exist preferential
differences in investment styles between retirement and non-retirement shareholders in these fund families.
Finally we examine the short-term and long-term capital gain overhangs for each fund and find that high DC ratio funds tend to have slightly lower short-term capital gains overhangs and higher long-term capital gains overhangs. This result would be driven primarily by the fact that high DC ratio funds tend to have lower turnovers and to hold a larger proportion of stocks for longer than a year.
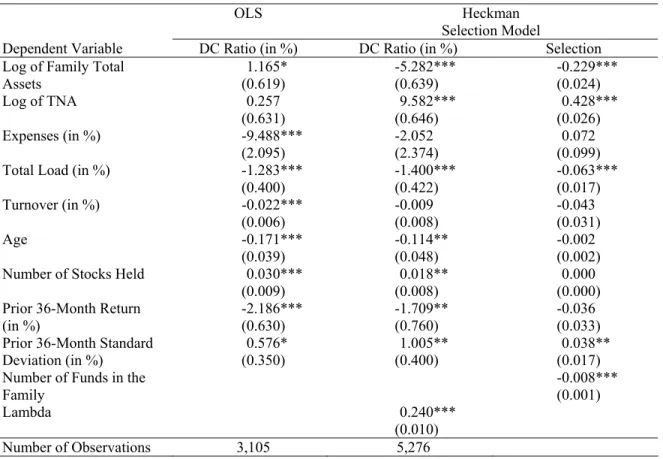
Table II provides a univariate perspective of which individual mutual fund characteristics are associated with assets held in defined contribution plans. In a multivariate test of these factors, we consider the determinants of the DC assets in mutual funds by regressing the proportion of fund assets invested by defined contribution participants (DC-ratio) against the mutual fund characteristics. Besides running an OLS specification, we also run a Heckman selection model because we do not have information on the defined contribution assets in all funds. The Heckman selection model uses the number of funds in a family as an additional variable to explain the selection of funds in our sample.
The results for the OLS estimation model and the Heckman selection model are provided in Table III. The coefficient on the logarithm of family size is significant, indicating that funds from large families are over-represented in DC accounts. This should not be surprising since some of the largest fund families (e.g., Vanguard, T. Rowe Price, Fidelity) provide recordkeeping services to defined contribution plans and their funds are typically included in the choices for these plans.10 The coefficient on fund size
is positive in both econometric specifications, but is only statistically significant after correcting for sample selection. Consistent with the univariate results, we find that funds with significant DC investments tend to have lower expense ratios and loads suggesting that plan sponsors consider fund fees in their selection process. Mutual funds held predominantly in retirement accounts also tend to be better diversified than funds held predominantly in taxable accounts. The coefficient on the return over the prior 36 months is significantly negative, indicating that funds held extensively in DC plans tend to chase performance less aggressively than funds held outside DC plans.
III. Differences in Investment Strategies A. Evidence from Mutual Fund Distributions
In this section we consider hypotheses related to differences in the investment strategies of funds with primarily taxable versus nontaxable investors. Portfolio managers with primarily taxable investors presumably would be interested in improving the tax-efficiency of their funds by taking several actions that lower the taxes faced by the investors in a given year. First, the managers can defer the realization of capital gains (by not selling appreciated stocks). Second, the managers can accelerate the realization of capital losses (by selling depreciated stocks). Third, the managers can tilt their portfolios toward stocks with low dividend yields, lowering dividend distributions. The benefit of shifting towards stocks with low dividend yields has been reduced significantly after the implementation of the 2003 tax reform. These potential activities imply that if managers consider the tax profiles of their shareholders, funds with low proportions of defined contribution assets should have different distribution patterns than those with
high proportions of such assets. Similarly, mutual fund investors might also choose funds with different distribution properties. That is, we should expect to see, controlling for other differences, significant differences across capital gain distributions and dividend yields for funds held in different tax environments.
1. Univariate Analysis
We first employ a univariate analysis to test the hypothesis that the distribution characteristics of mutual funds should vary according to the proportion of defined contribution assets. As in the previous tests, we divide the sample funds into quartiles according to the mutual fund’s ratio of DC assets and include a fifth group for funds for which the DC asset information is missing. The results are shown in Table IV. Consistent with the hypothesis that the portfolio managers pay attention to the tax status of their shareholders we find that funds with high DC ratios tend to distribute significantly larger capital gains and exhibit significantly higher tax burdens than funds with low DC ratios. For example, funds in the bottom DC quartile distribute capital gains of 3.75 percent of their assets compared to the funds in the top DC quartile who distribute capital gains equal to 4.58 percent of their assets, a 22% higher distribution rate. Furthermore, as would be expected if mutual fund managers are tailoring their investment strategies, at least in part, by the tax preferences of their shareholders, we find the tax burden for the set of funds with large numbers of shareholders who do not pay taxes is about 23% higher than the tax burden for the set of funds with low numbers of such shareholders.
On the other hand, we do not find significant differences in dividend yields across funds with different tax clienteles. This result likely occurs because dividend distributions are relatively small due to the deductibility of fund fees and because changes in dividend yields would require large changes in the fund investment strategies (e.g., focus on high-dividend paying or non-dividend paying stocks), which could generate significant tracking errors relative to the relevant benchmarks.
Figure 4 summarizes the cumulative distribution functions of the capital gains distributions (Panel A) and of the tax burdens (Panel B) over our sample period between 1997 and 2006. We depict the cumulative distribution functions for funds in the top and the bottom DC quartiles. Consistent with the average results summarized in Table IV, we find that high DC funds tend to distribute higher annual capital gains than low DC funds over the entire depicted range. We find that 49.08 percent of funds in the bottom quartile and 46.14 percent of funds in the top quartile do not make any capital gains distributions in a particular year. Panel B shows a similar pattern using the total tax burden of dividend and capital gains distributions. These results are broadly consistent with Barber and Odean (2003) who examine the differences in distribution characteristics for mutual funds held by individual investors in their taxable versus nontaxable brokerage accounts over the 1991-1996 time period.
It is interesting that funds held primarily by taxable investors tend to distribute large capital gains, indicating that these funds do not take full advantage of opportunities to defer capital gains for their investors. A relatively small proportion of the funds in our sample (about 2.3 percent) identify themselves as tax-efficient or tax-managed mutual funds. These funds make significantly smaller capital gains distributions than other
actively managed funds (0.67 vs. 4.16 percent per year). Not surprisingly, these tax-efficient funds are rarely held in DC accounts (2.76 vs. 24.01 percent). Index funds also tend to be significantly more tax-efficient than actively managed funds. For example, investors holding the Vanguard 500 Index fund would have received dividend distributions of 1.48 percent, and short- and long-term capital gains distributions of just 0.05 and 0.15 percent over our sample period. On average over the sample period, index funds make total capital gains distributions of 1.68 percent per year, whereas actively managed funds distribute 4.08 percent per year. However, index funds tend to be overrepresented in DC accounts relative to actively managed funds (38.33 vs. 23.98 percent).
2. Multivariate Analysis
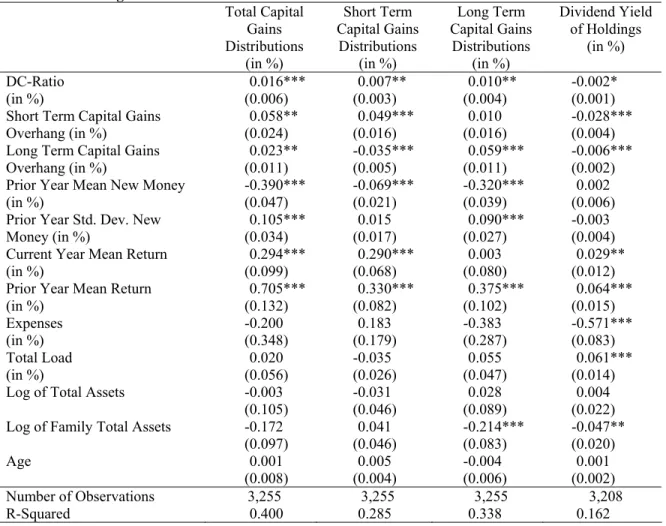
We examine the determinants of mutual fund distributions in a multivariate framework that includes the proportion of defined contribution assets in the mutual fund as an independent variable. Our major control variables are the short- and long-term capital gains overhangs, the flows and variation in flows to the fund over the previous year, the funds’ expenses, load, fund size, family size, and fund age. We also control for time fixed effects and cluster the standard errors by fund. Table V shows the results of these regressions where our dependent variables are the fund’s capital gains distributions and dividend yield normalized by net asset value. Our independent variable of interest is the ratio of defined contribution assets to total assets (DC ratio). Panel A reports the OLS regression coefficients and Panel B reports the Tobit coefficients, which take into account the inability of distributions to be negative.
The first column of Panel A of Table V shows the results when the dependent variable is the fund’s total capital gains distribution. Consistent with the results from Table IV, we find a positive relation between the DC ratio and the capital gains distribution. Moreover, this relation is economically meaningful. We find that a one-standard deviation increase in the DC ratio increases total capital gains distributions over the subsequent 12 months by around 0.32 percentage points. The relation is positive and significant for both short- and long-term capital gains distributions. In contrast, funds with higher DC ratios tend to hold stocks with slightly lower dividend yields. However, the results are economically relatively small. For example, a one-standard deviation increase in the DC ratio increases the dividend yield of the holdings by only around 4 basis points per year.11
As would be expected, a positive relation exists between the current capital gains overhang and the subsequent capital gain distribution. Consistent with Dickson, Shoven, and Sialm (2000), we find that funds that experience negative or highly volatile new money growth over the prior year tend to distribute higher capital gains over the subsequent year since these funds are more likely to sell off shares and recognize capital gains. Thus, taxes correspond to an additional source of strategic complementarities across investors in open-ended funds besides the liquidity-based externalities discussed by Chen, Goldstein, and Jiang (2009).
11 Using the actual dividend distributions of mutual funds instead of the dividend yields of the holdings
changes the coefficient on the DC ratio from -0.002 to -0.001 and the coefficient becomes insignificantly different from zero. The actual dividend distributions of funds differ from the dividend yields of their holdings primarily because mutual funds commonly subtract expenses from dividend distributions.
Panel B reports the coefficients of Tobit regressions taking into account that dividend and capital gains distributions are censored at zero. Our main conclusions are not affected significantly using this alternative econometric methodology.
3. Changes in Clienteles and Tax Reforms
The results in Tables IV and V do not allow us to determine the causality of the results. The results could be driven by the fact that mutual funds catering to different clienteles follow different investment strategies. An alternative interpretation is that mutual funds follow fixed investment strategies and that different tax clienteles select into different mutual funds according to their predetermined investment strategies. To shed some light on this question, we conduct two additional tests taking advantage of time-series variation in the DC ratio and taking advantage of the 2003 tax reforms, which reduced the taxes on dividends and long-term capital gains substantially.
To investigate whether changes in investor clienteles have an impact on capital gains distributions, we focus on the total capital gains distributions and decompose the DC-ratio into its lagged and changed components, where we meaure the change over one, two, three and four years respectively. That is, we regress total capital gains distributions over the subsequent year on the lagged DC ratio, the subsequent change in the DC ratio, and other potential determinants included in Table V. The results of these regressions are reported in Table VI, where the four different columns correspond to the different lags. For example, column two uses DCt-3 as the lagged DC ratio and DCt-1 – DCt-3 as the
change in the DC ratio. We find that the coefficient on the change in the DC ratio is positive and very similar in magnitude to the coefficient on the lagged DC ratio, which is
consistent with the hypothesis that mutual fund managers adjust their capital gains distributions when their tax clienteles change. It is also important to recognize that the regression specifications include time fixed effects, which control for aggregate time trends in capital gains realizations and DC ratios.
During our sample period a major reform in the tax code with respect to mutual fund investments occurred in 2003, as summarized in Figure 3. The top federal marginal tax rate on dividends was reduced from 38.6 to 15 percent and the top federal long-term capital gains tax rate was reduced from 20 to 15 percent.
The 2003 tax reform provides a useful natural experiment to study whether mutual funds changed their investment behavior depending on their tax clienteles. We expect that the outcomes of investment strategies of those funds held primarily by taxable investors should be affected more by these tax changes than funds held by the non-taxable investors if the managers were responding to the tax preferences of their shareholders.
Table VII reports the average dividend yields and the average short- and long-term capital gains distributions for funds below and above the median DC ratio before and after the 2003 tax reforms, with dividend yield in Panel A, short-term capital gains in Panel B, and long-term capital gains in Panel C. The table also reports the differences-in-differences estimators.
Panel A summarizes the dividend yields based on the equity holdings of funds. We observe that dividend yields generally increased across both groups after the 2003 tax reforms. This is consistent with the Chetty and Saez (2005) finding that a larger number of firms initiated or increased dividend payments after the 2003 tax reform. In support of
our hypothesis that mutual fund managers have changed their investment strategies in response to the tax reforms, we find that the increase in the dividend yield is more pronounced for funds with below median DC assets. Thus, as the tax penalty on dividends was reduced in 2003, mutual funds with taxable clienteles have been more willing to hold stocks paying relatively high dividend yields.
Due to the relatively poor stock market performance since 2003, capital gains distributions were lower over the second sample period, which is reflected in Panels B and C for short and long term distributions. Examining the differences-in-differences estimation, it is not surprising that we do not find a significant time effect between high and low DC funds for short-term capital gains distributions, because short-term capital gains tax rates did not change significantly in 2003, as shown in Figure 3. However, as Panel C shows, we find a significant difference-in-difference for long-term capital gains. The reduction in long-term capital gains distributions has been significantly less pronounced for low DC funds than for high DC funds, which is consistent with a less severe tax penalty on long-term capital gains and with the hypothesis that mutual fund managers take the tax preferences of their shareholders into consideration in making investment decisions.
In summary, our two tests on the direction of influence support the hypothesis that mutual fund managers consider the tax preferences of their shareholders. When the proportion of taxable shareholders changes or the tax laws change, the evidence suggests that mutual fund managers change their investment strategies accordingly.
B. Evidence from Mutual Fund Holdings
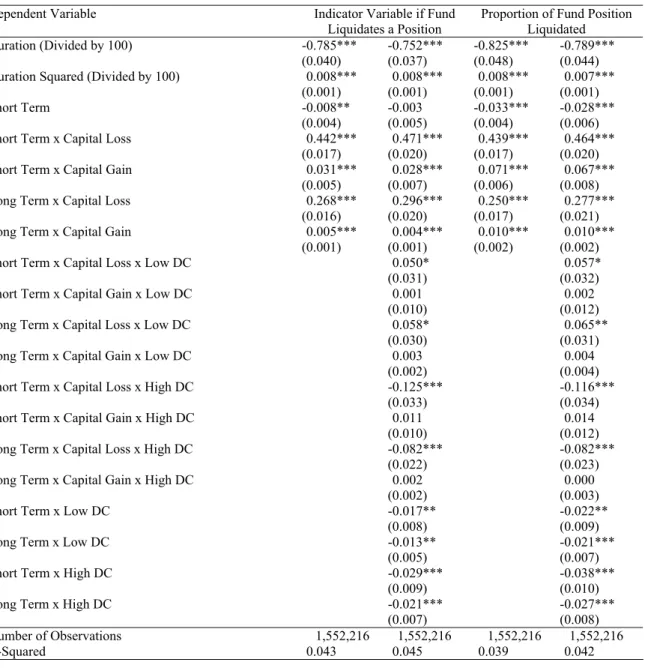
If mutual fund managers make investment decisions considering their tax clienteles, the differences should be reflected in the timing of their investment decisions. Consequently in this section we examine the timing of changes in funds’ holdings using the 1,552,216 position-quarters from the mutual funds with available DC ratios.
Specifically, we test whether differences in liquidation decisions vary between funds with large amounts of DC assets as compared to those with small amounts using a linear probability model. We present the results from the model in Table VIII where the dependent variable in the first two columns is an indicator variable for whether the fund liquidates a position and the dependent variable in the last two columns is the proportion of the fund position liquidated.12
We first examine the unconditional trading in the funds. As the first column of Table VIII shows, the longer a position is held, the less likely the fund is to liquidate that position. However, that relation is convex as the duration squared measure is positive. We find that the interaction terms between the length of the position (short-term or long-term) and the magnitude of the capital loss or gain are generally positive. The first column indicates that mutual funds are more likely to liquidate a position if the capital loss or the capital gain is relatively large. Moreover, the coefficients tend to be significantly larger for capital losses, indicating that mutual funds are more likely to sell a stock with a capital loss than a stock with a similar capital gain. This behavior is consistent with our hypothesis of tax sensitive strategies, which require funds to realize
12 These results are related to several recent papers that investigate the disposition effect of institutional
investors. (See, Frazzini (2005), Ben-David, and Doukas (2006), Cici (2006), and Jin and Scherbina (2006)).
short-term capital losses. However, this result can also be consistent with the momentum strategies followed by funds documented by Grinblatt, Titman, and Wermers (1995). For example, the propensity for a mutual fund to liquidate a position held for less than four quarters increases by 4.42 percent if a position exhibits a ten percentage point larger capital loss. On the other hand, the propensity for a mutual fund to liquidate a position held for less than four quarters increases by 0.31 percent if a position exhibits a ten percentage point larger capital gain. The impact of capital gains or losses on long-term positions on fund liquidations is less sensitive than on short-term positions. Column 3 indicates that the results are very similar if we use the proportion of a position sold in a given quarter as the dependent variable.
The second column tests whether the propensities to liquidate positions with specific capital gains or losses depend on the DC ratio of a fund. We find that funds with low DC ratios (bottom quartile) are more likely to realize short- and long-term capital losses than funds with intermediate DC ratios (middle two quartiles) and that high DC ratio funds (top quartile) are significantly less likely to realize short- and long-term capital losses than funds with medium DC assets. This behavior is consistent with our hypothesis that funds held primarily by participants in DC plans are less sensitive to tax considerations than funds held primarily outside DC plans.
These results based on the portfolio holdings confirm the results based on fund distributions. Mutual funds held widely in defined contribution accounts tend to be less tax-efficient than funds held primarily by taxable investors. However, mutual funds held primarily by taxable investors are not completely tax-efficient. They still have relatively high propensities to realize capital gains, which would be consistent with the tradeoffs
suggested by Barclay, Pearson and Weisbach (1998) that mutual fund managers face between satisfying current versus future shareholders.
IV. Differences in Performance
Mutual fund managers who consider tax efficiency in their investment decisions face a more constrained investment opportunity set than those mutual fund managers who do not consider tax efficiency. The issue that we address in this section is whether tax efficiency activities cause the manager to give up return and consequently lead to lower before-tax performance. If this is the case, we would expect to find systematic differences in returns between funds with substantial levels of DC assets versus those without as the former do not need to be as concerned with the tax efficiency of their portfolio.
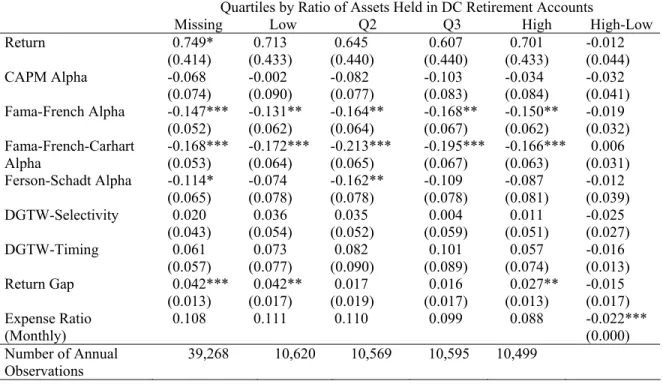
To evaluate these differences, we employ eight different measures of mutual fund return performance. We again divide the mutual funds into quartiles according to their lagged DC ratio and include also the group of mutual funds with missing DC data, giving us five different groups in which we employ each model over the sample period to obtain average performance for the group. The results, based on monthly returns, are summarized in Table IX with the first column showing the return performance measures for the missing DC data group followed by the DC asset quartiles. The last column shows the results from tests of the differences in performance between the lowest and highest DC ratio groups.
Our first return measure is the raw return and we do not find significant differences in performance between the lowest and highest DC group.
We also examine several risk-adjusted measures of return. We first employ the alpha from the Capital Asset Pricing Model:
Ri,t – RF,t= αi + βi,M(RM,t – RF,t) + εi,t (3)
where Ri,t – RF,t and RM,t – RF,t are the monthly excess returns on the fund portfolio and
the market portfolio respectively. We also estimate alphas from the Fama-French (1993) model:
Ri,t – RF,t= αi + βi,M(RM,t – RF,t) + βi,SMBSMBt + βi,HMLHMLt + εi,t (4)
and the Carhart (1997) model:
Ri,t – RF,t= αi + βi,M(RM,t – RF,t) + βi,SMBSMBt + βi,HMLHMLt + βi,UMDUMDt + εi,t (5)
where SMBt , HMLt and UMDt are the monthly size, value and momentum factor returns.
In addition, we use the Ferson and Schadt (1996) conditional model that nests the Carhart model.
Ri,t – RF,t= αi + βi,M(RM,t – RF,t) + βi,SMBSMBt + βi,HMLHMLt + βi,UMDUMDt +
+Σj βi,jMACRO j,t-1(RM,t – RF,t) + εi,t, (6)
where MACROj,t-1 denotes one of five demeaned lagged macro-economic
variables including the Treasury bill yield, the dividend yield of the S&P Composite Index, the Treasury yield spread (long- minus short-term bonds), the quality spread in the corporate bond market (low- minus high-grade bonds), and an indicator variable for the month of January.13
Using these factor-based models, we find that the funds show no significant difference in abnormal performance over the sample period. We also find that all fund
13 The market, size, book-to-market, momentum factors and the risk-free rate are obtained from Ken
French's website (http://mba.tuck.dartmouth.edu/pages/faculty/ken.french/index.html). The dividend yield of the S&P Index is obtained from Shiller's website (http://www.econ.yale.edu/~shiller/data.htm). The bond
groups tend to have significantly negative future alphas when employing the Fama-French or Fama-Fama-French-Carhart models.
To this point our performance measures are based on the monthly returns of the funds and the benchmark portfolios. Alternatively we employ two measures to evaluate the return performance of the funds using their actual holdings. We first use the DGTW selectivity and style timing models (Daniel, Grinblatt, Titman, and Wermers, 1997)
CSi,t = Σk wi,k,t-1 Rk,t– Σk wi,k,t-1 BRk,t(t-1) (7)
CTi,t = Σk wi,k,t-1 BRk,t(t-1) - Σk wi,k,t-5 BRk,t(t-5) (8)
where wi,k,t-1 is the weight of stock k in fund i’s portfolio for period t-1, Rk,t is the return on
stock k for period t and BRk,t(t-s) is the characteristic-based benchmark return for stock k
for period t to which stock j was allocated during quarter t-s according to its size, value, and momentum characteristics.
Finally we estimate the return gap between the actual fund return and the hypothetical return of the most recently disclosed fund positions as developed by Kacperczyk, Sialm, and Zheng (2008):
RGi,t = Ri,t –Σk wi,k,t-1 Rk,t . (9)
Again when employing performance evaluations based on the funds’ holdings rather than their returns, we find no significant differences between the high and low DC ratio funds in any of the return measures.
In Table X we take our analysis further by conducting a more comprehensive test of the hypothesis that engaging in tax efficient strategies constrains a manager’s choices and can lead to lower investment returns. If funds with fewer DC assets have more constrained investment strategies because of the need to engage in tax efficient strategies,
then we should examine whether the funds’ performance is related to lagged characteristics of the fund, including whether the ratio of DC assets to total assets affects the performance. We find that while some fund characteristics affect the performance of the funds, the presence of a large amount of DC assets does not improve the future performance of a fund as one would presume if tax efficient strategies affect the managers’ opportunity sets.
V. Conclusions
In this paper we examine whether the preferences of portfolio managers’ clientele are an important influence on the managers’ investment strategies as reflected in differences across mutual funds with primarily tax-deferred accounts as compared to other mutual funds. Using information on the amount of defined contribution assets in a sample of mutual funds that covers the largest fund families, we develop and test several hypotheses regarding differences across mutual funds.
We first hypothesize that plan sponsors and their participants would be attracted to certain fund characteristics. Consistent with this hypothesis we find significant differences in the characteristics of funds with the highest amount of defined contribution assets as compared to funds with the lowest amount of defined contribution assets. The high DC funds tend to have lower expense ratios, lower or no load fees, have greater assets under management, be part of larger families of funds, and have a larger number of stocks in the portfolio as compared to the low DC funds. These differences imply that plan sponsors are selective in their choice of funds to include on the plan platform.
Our second hypothesis addresses differences in mutual fund investment strategies across funds with different proportions of defined contribution assets. That is, we hypothesize that if managers consider the tax preferences of their shareholders, we should find differences in the investment strategies of mutual funds with high defined contribution assets as compared to those funds with low defined contribution assets and that these differences should reflect the preferences of tax-deferred versus taxable shareholders. Using two types of empirical tests, tests on mutual fund distributions and tests on mutual fund holdings, we document that such differences exist. We find that mutual funds held primarily by retirement account holders tend to be less tax-efficient than other types of funds, presumably held primarily by taxable investors. In particular, we find that long-term capital gain distributions are increasing in the proportion of defined contribution assets in the fund and that mutual funds held primarily by non-taxable investors have lower propensities to realize capital gains. These results suggest that the managers of mutual funds held primarily by taxable investors consider the tax consequences of their investment decisions.
Finally, we hypothesize that maintaining the tax efficiency of a mutual fund may constrain the managers’ investment strategies, resulting in lower returns for the tax efficient funds. We do not find significant performance differences between funds held primarily by retirement accounts versus those held primarily by taxable investors, suggesting that any constraints faced by tax efficient fund managers do not appear to have costs in terms of lower risk-adjusted returns or the fund managers are not practicing tax efficiency to the extent it is affecting their performance.
Overall, our evidence shows that mutual fund managers consider the tax consequences of their actions when they have a smaller component of defined contribution plan shareholders. However, even in this case the tax considerations do not appear to be of first-order importance as one would expect with a diverse clientele. The question that arises is how the tax considerations will evolve as defined contribution plans become the dominant shareholders of mutual funds.
References
Barber, B. and T. Odean, 2004, Are Individual Investors Tax Savvy? Asset Location Evidence from Retail and Discount Brokerage Accounts, Journal of Public
Economics 88, 419-442.
Barber, B., T. Odean, and L. Zheng, 2005, Out of Sight, Out of Mind: The Effects of Expenses on Mutual Fund Flows, Journal of Business 78, 2095-2120..
Barclay, M., N. Pearson, and M. Weisbach, 1998, Open End Mutual Funds and Capital Gains Taxes, Journal of Financial Economics 49, 3-43.
Ben-David, I., and J. Doukas, 2006, Overconfidence, Trading Volume, and the Disposition Effect: Evidence from the Trades of Institutional Investors, Working Paper, University of Chicago and Old Dominion University.
Bennett, J., R. Sias, and L. Starks, 2003, Greener Pastures and the Impact of Dynamic Institutional Preferences, Review of Financial Studies 16, 1203-1238.
Bergstresser, D. and J. Poterba, 2002, Do After-Tax Returns Affect Mutual Fund Inflows? Journal of Financial Economics 63, 381-414.
Bergstresser, D. and J. Poterba, 2004, Asset Allocation and Asset Location: Household Rvidence from the Survey of Consumer Finances, Journal of Public Economics 88, 1893-1915.
Brav, A., J. Graham, C. Harvey, and R. Michaely. 2005, Payout Policy in the 21st Century. Journal of Financial Economics 77(3): 483-527.
Carhart, M., 1997, On Persistence in Mutual Fund Performance, Journal of Finance, 52, 57–82.
Chalmers, J., Edelen, R., and G. Kadlec, 2001, Fund Returns and Trading Expenses: Evidence on the Value of Active Fund Management, Working Paper, University of Oregon.
Chan, H.W.H., R. Faff, D. Gallagher, and A. Looi, 2008, Fund Size, Fund Flow, Transaction Costs and Performance: Size Matters! Forthcoming: Australian Journal of Management.
Chen, Q., I. Goldstein, and W. Jiang, 2009, Payoff Complementarities and Financial Fragility: Evidence from Mutual Fund Outlfows, Working Paper, Duke University, University of Pennsylvania, and Columbia University.
Chetty, R. and E. Saez, 2005, Dividend Taxes and Corporate Behavior: Evidence from the 2003 Dividend Tax Cut, Quarterly Journal of Economics, 120, 791-833.
Christoffersen, S., C. Geczy, D. Musto, and A. Reed, 2006, Cross-border Dividend Taxation and the Preferences of Taxable and Non-taxable Investors: Evidence from Canada, Journal of Financial Economics 78, 121-144.
Christoffersen, S., D. Keim, and D. Musto, 2005, Valuable Information and Costly Liquidity: Evidence from Individual Mutual Fund Trades, Working Paper, McGill University and Wharton.
Cohn, J. B. and S. A. Sikes, 2009, Capital Gains Tax Overhang and Payout Policy, Working Paper, University of Texas at Austin and Duke University.
Cici, G., 2005, The Relation of the Disposition Effect to Mutual Fund Trades and Performance, Working Paper, College of William and Mary.
Dammon, R., C. Spatt, and H. Zhang, 2004, Optimal Asset Location and Allocation with Taxable and Tax-Deferred Investing, Journal of Finance 59, 999-1037.
Daniel, K., M. Grinblatt, S. Titman, and R. Wermers, 1997, Measuring Mutual Fund Performance with Characteristic-Based Benchmarks, Journal of Finance 52, 1035-1058.
Del Guercio, D., 1996, The Distorting Effect of the Prudent-Man Laws on Institutional Equity Investments, Journal of Financial Economics 40, 31-62.
Deli, D., 2002, Mutual Fund Advisory Contracts: An Empirical Investigation, Journal of
Finance 57, 109-133.
Deli, D., and R. Varma, 2002, Contracting in the Investment Management Industry: Evidence from Mutual Funds, Journal of Financial Economics 63, 79-98.
Deloitte Consulting, 2006, Annual 401(k) Benchmarking Survey: 2005/2006 Edition.
Desai, M., and L. Jin, 2008, Institutional Tax Clienteles and Payout Policy, Working Paper, Harvard University.
Dickson, J., and J. Shoven, 1995, Taxation and Mutual Funds: An Investor Perspective,
Tax Policy and the Economy 9, 151-180.
Dickson, J., J. Shoven, and C. Sialm, 2000, Tax Externalities of Equity Mutual Funds,
National Tax Journal 53, 607-628.
Edelen, R., 1999, Investor Flows and the Assessed Performance of Open-End Fund Managers, Journal of Financial Economics 53, 439-466.
Edelen, R., R. Evans, and G. Kadlec, 2007, Scale Effects in Mutual Fund Performance: The Role of Trading Costs,
Evans, R., 2006, Does Alpha Really Matter? Evidence from Mutual Fund Incubation, Termination and Manager Change, Working Paper, Boston College.
Fama, E., and K. French, 1993, Common Risk Factors in the Returns on Stocks and Bonds, Journal of Financial Economics 33, 3–56.
Fama, E., and K. French, 2008, Mutual Fund Performance, Working Paper, University of Chicago and Dartmouth College.
Ferson, W., Schadt, R., 1996, Measuring Fund Strategy and Performance in Changing Economic Conditions, Journal of Finance 51, 425–461.
Fong, K., D. Gallagher, S. Lau, and P. Swan, 2009, Do Active Fund Managers Care About Capital Gains Tax Efficiency? Pacific-Basin Finance Journal 17, 257-270. Foster, D., D. Gallagher, and A. Looi, 2006, Institutional Trading and Share Returns,
Working Paper, University of New South Wales.
Frazzini, A., 2006, The Disposition Effect and Under-Reaction to News, Journal of
Finance 61, 2017-2046.
French, K., 2008, Presidential Address: The Cost of Active Investing, Journal of Finance
Gibson, S., A. Safieddine and S. Titman, 2000, Tax Motivated Trading and Price Pressure: An Analysis of Mutual Fund Holdings, Journal of Financial and
Quantitative Analysis 35, 369–386.
Gompers, P., and A. Metrick, 2001, Institutional Investors and Equity Prices, Quarterly
Journal of Economics 116, 229–259.
Grinblatt, M., S. Titman, and R. Wermers, 1995, Momentum Investment Strategies, Portfolio Performance, and Herding: A Study of Mutual Fund Behavior, American
Economic Review, 1088-1105.
Grinstein, Y. and R. Michaely, 2005, Institutional Holdings and Payout Policy, Journal of
Finance 60, 1389-1426.
Huang, J., 2008, Taxable and Tax-Deferred Investing: A Tax-Arbitrage Approach,
Review of Financial Studies 21, 2173-2207.
Huddart, S., and V. Narayanan, 2002, An Empirical Examination of Tax Factors and Mutual Funds' Stock Sales Decisions, Review of Accounting Studies 7, 319–341. Ivković, Z., J. Poterba, and S. Weisbenner, 2005, Tax Loss Trading by Individual
Investors, American Economic Review 95, 1605-1630.
Ivković, Z. and S. Weisbenner, 2009, Individual Investor Mutual Fund Flows, Journal of
Financial Economics 92, 223-237.
Jin, L., 2006, Capital Gains Tax Overhang and Price Pressure, Journal of Finance 61, 1399-1431.
Jin, L., and A. Scherbina, 2006, Inheriting Losers, Working Paper, Harvard University. Johnson, W., and J. Poterba, 2008, Taxes and Mutual Fund Inflows around Distribution
Dates, working paper, University of Oregon and MIT.
Kacperczyk, M., C. Sialm, and L. Zheng, 2005, On the Industry Concentration of Actively Managed Equity Mutual Funds, Journal of Finance 60, 1983-2011.
Kacperczyk, M., C. Sialm, and L. Zheng, 2008, Unobserved Actions of Mutual Funds,
Review of Financial Studies 21, 2379-2416.
Khorana, A. and H. Servaes, 1999, The Determinants of Mutual Fund Starts, Review of
Financial Studies 12, 1043-1074.
Shoven, J. and C. Sialm, 2003, Asset Location in Tax-Deferred and Conventional Savings Accounts, Journal of Public Economics 88, 23-38.
Sialm, C., 2008, Tax Changes and Asset Pricing, Forthcoming: American Economic Review.
Sikes, S., 2008, The January Effect and Institutional Investors: Tax-Loss-Selling or Window-Dressing? Working Paper, Duke University
Sirri, E., and P. Tufano, 1998, Costly Search and Mutual Fund Flows, Journal of Finance
53, 1589-1622.
Wermers, R., 2000, Mutual Fund Performance: An Empirical Decomposition into Stock-Picking Talent, Style, Transaction Costs, and Expenses, Journal of Finance 55, 1655-1702
Table I: Summary Statistics
This table presents the summary statistics for the sample of equity mutual funds over the period 1997 to 2006.
Mean Median Standard
Deviation DC Ratio (Proportion of Assets held in Defined Contribution Plans) (in %) 23.98 19.18 20.39
Short-Term Capital Gains Yield over Prior Year (in % per year) 1.06 0.00 2.81
Long-Term Capital Gains Yield over Prior Year (in % per year) 3.11 0.23 5.05
Dividend Distributions over Prior Year (in % per year) 0.40 0.03 0.85
Dividend Yield of Holdings (in % per year) 1.14 1.05 0.75
Tax Burden of Fund Distributions (in % per year) 1.25 0.36 1.79
Short Term Capital Gains Overhang (in %) 2.65 1.64 6.45
Long Term Capital Gains Overhang (in %) 10.68 7.68 17.78
Investor Return (in % per month) 0.71 0.97 5.55
Holdings Return (in % per month) 0.82 1.10 5.91
TNA (Total Net Assets) (in Billions) 2.13 0.40 6.40
Family TNA (in Billions) 63.19 20.58 118.81
Age 13.65 9.00 14.50
Expense Ratio (in %) 1.26 1.23 0.44
Total Maximum Load (in %) 2.32 1.28 2.37
Proportion Invested in Stocks (in %) 94.84 96.54 6.42
Proportion Invested in Cash (in %) 3.98 2.70 4.91
Turnover Ratio (in %) 92.30 73.00 80.44
Mean of Prior-Year New Money Growth (in % per month;5% winsorized) 1.40 0.09 4.52
Standard Deviation of Prior-Year New Money Growth (in % per month;
5% winsorized) 4.10 1.93 6.09
Number of Stock Held 121.49 87.00 147.15
Size Score (Score between 1-5 using Size Quintiles) 4.26 4.69 0.88