Accelerated Articles
Anal. Chem.1996,68,3305-3313
Rapid DNA Sequencing of More Than 1000 Bases
per Run by Capillary Electrophoresis Using
Replaceable Linear Polyacrylamide Solutions
Emanuel Carrilho,†Marie C. Ruiz-Martinez,‡Jan Berka, Igor Smirnov,§Wolfgang Goetzinger, Arthur W. Miller, David Brady,⊥and Barry L. Karger*Barnett Institute and Department of Chemistry, Northeastern University, Boston, Massachusetts 02115
The read length for DNA sequencing using capillary electrophoresis and replaceable linear polyacrylamide (LPA) solutions has been extended to more than 1000 bases with a run time of 80 min. This result was successfully achieved through the combined use of cycle sequencing with dye-labeled primers, improved matrix and separation conditions, and enhanced base-calling software. The influences of LPA molecular weight and concentration on separation were investigated. Addition-ally, the separation buffer, column temperature, and electric field were adjusted to increase the number of resolvable DNA fragments per run while maintaining an enhanced separation speed. Using low concentra-tions [2% (w/v)] of high molecular weight LPA polymers (>5.5×10
6Da), elevated column temperature (50°C)
and moderately high field (150 V/cm), rapid sequencing analysis for more than 1000 bases on a model ssM13mp18 template was obtained with 96.8% accuracy.
In recent years, the Human Genome Project has accelerated the development of technologies for high-throughput DNA se-quencing.1 One of the bottlenecks of sequencing using standard slab gel electrophoresis is the rate of separation of DNA frag-ments. While multiple lanes increase the throughput, the slab
gel process is slow and labor intensive, with each separation requiring from 4 to 18 h for completion.2,3
It is likely that the next generation of automated sequencers may utilize enhanced speed electrophoretic approaches such as capillary4-6or ultrathin slab gel electrophoresis.7 Capillary
elec-trophoresis (CE) may be the preferred approach, given the potential for simpler automation and the elimination of gel pouring through the use of replaceable polymer solutions (see below). Significant efforts are thus underway to develop a fully automated multiple capillary array instrument to increase sequencing throughput.8-11
In 1993, our laboratory introduced replaceable polymer solu-tions (i.e., linear polyacrylamide, LPA) for DNA sequencing.4The polymer, reloaded after each run by positive pressure, extended the column lifetime, as well as providing an essentially fresh column for each sequencing run. In our initial work, the focus was on developing a simple instrument with rapid separation. We demonstrated 350 bases sequenced in 0.5 h with high accuracy (99.5%) using a two-color, two-ratio base-calling procedure.
Sub-* To whom correspondence should be addressed. E-mail: bakarger@ lynx.dac.neu.edu.
†On leave from University of Sa˜o Paulo, IQSC/DQFM, 13560-970, Sa˜o Carlos
S. P., Brazil.
‡Department of Energy Human Genome Distinguished Postdoctoral Fellow. §Current address: PerSeptive Biosystems, Framingham, MA 01701. ⊥Electrical and Computer Engineering Department, Northeastern University,
Boston, MA 02115.
(1) Guyer, M. S.; Collins, F. S. Proc. Natl. Acad. Sci. U.S.A.1995, 92, 10841
-10848.
(2) Applied Biosystems/Perkin Elmer Corp., Foster City, CA. Biosystem Reporter; 1995; Vol. 25, pp 7-8.
(3) LI-COR, Inc., Lincoln, NE. LI-COR application note, 1996.
(4) Ruiz-Martinez, M. C.; Berka, J.; Belenkii, A.; Foret, F.; Miller, A. W.; Karger, B. L. Anal. Chem. 1993, 65, 2851-2858.
(5) Best, N.; Arriaga, E.; Chen, D. Y.; Dovichi, N. J. Anal. Chem. 1994, 66, 4063-4067.
(6) Fung, E. N.; Yeung, E. S. Anal. Chem. 1995, 67, 1913-1919.
(7) Mouradian, S.; Brumley, R. L.; Smith, L. M. Electrophoresis 1994, 15, 1084
-1090.
(8) Huang, X. C.; Quesada, M. A.; Mathies, R. A. Anal. Chem. 1992, 64, 2149
-2154.
(9) Ueno, K.; Yeung, E. S. Anal. Chem. 1994, 66, 1424-1431.
(10) Takahashi, S.; Murakami, K.; Anazawa, T.; Kambara, H. Anal. Chem. 1994, 66, 1021-1026.
(11) Dovichi, N.; Zhang, J.-Z.; Yan, J.; Rong, J.; Rong, L.; Bay, S.; Roos, P.; Voss, K.; Dellinger, S., Santa Fe, NM, 1/28/96-2/1/96, U.S. Department of
Energy, 1996; Human Genome Program, Contractor-Grantee Workshop
V, p 35.
A C R e s e a r c h
sequently, sequence reads reached 500-600 bases in 1-2-h analysis time.12,13 Nishikawa and Kambara also demonstrated the separation of sequencing fragments up to 850 bases using a 300-cm capillary and a low electric field, but with an analysis time of 10 h.14
Although these read lengths are useful for many applications, there are a number of reasons to pursue extension of base numbers per run. Long read lengths are required to cross regions of repeat sequences (e.g., Alu repeats), which can extend for up to 1 kilobase or more in human DNA.15 Long read lengths further aid the assembly of sequences and reduce the amount of tedious subcloning, gap closures, and reactions. The decrease in the number of enzymatic reactions also reduces the overall cost of sequencing, which is at present a significant consideration.16 It is important to emphasize that such read lengths must be achieved in fast separation times in order to maintain one of the major advantages of the methodsspeed.
The goal of this work was to extend the sequencing read length per run in CE using fully replaceable matrixes, while maintaining a rapid analysis time. In order to achieve this, a number of factors had to be jointly considered including sequencing chemistry, separation matrix, electrophoretic column conditions, and base-calling software. This paper reports sequencing for at least 1000 bases in 80 min with an accuracy of 96.8% for a ssM13mp18 template. The extended read lengths in combination with the current development of multiple capillary instruments make CE a powerful approach for a new generation of automated DNA sequencers.
EXPERIMENTAL SECTION
Equipment. The basic design of the single-capillary system with laser excitation has been previously described.4 Briefly, the light from a 5-mW multiline argon ion laser (Ion Laser Technolo-gies, Salt Lake City, UT) was passed through an interference filter (Oriel, Stamford, CT) to isolate the 514-nm line. The laser emission was then reflected by a mirror (Newport, Fountain Valley, CA), positioned at 45°relative to the lens. The lens was used to focus the laser light into the capillary. The fused-silica capillary (75 or 100 µm i.d. and 365 µm o.d.) (Polymicro Technologies, Inc., Phoenix, AZ) was maintained horizontal. The buffer reservoirs were positioned at the same height in order to eliminate any pressure differences in the capillary. The column was heated with a solid state unit connected to a temperature controller between 30 and 90(0.5°C.
13
The emission was collected with a 40×microscope objective (numerical aperture 0.65) (Oriel) and focused into a spectrograph (Jarrell-Ash Division/Fisher Scientific Co., Waltham, MA). The light was transmitted through two holographic notch filters (Kaiser Optical Systems, Inc., Ann Arbor, MI) to block the scattered laser light and then reflected in a 600 groove/mm grating (Jarrell-Ash). No spatial filter was necessary to eliminate scatter light. The diffracted image was detected using an intensified photodiode array (Model 1461, E.G.&G. Princeton Applied Research, Princ-eton, NJ), operating at 4°C. The fluorescence spectra of the
labeled sequencing fragments were acquired from 500 to 660 nm. A total of 640 diodes, electronically integrated in 160 groups of four diodes, were employed to collect the emission image. For the separation of single dye-labeled sequencing reaction products, detection was accomplished with a photomultiplier tube instead of the photodiode array.
Two modes of data acquisition were used, full-spectra and real-time monitoring of the signal.17 Full spectral data were acquired using OMA 2000 software (E.G.&G. Princeton Applied Research) and processed with sequencing software developed in-house (see next section). The real-time signal was acquired at a preselected diode through a DT2804 board and processed using Chrom Perfect for Windows (version 3.10) (Justice Innovations, Inc., Mountain View, CA) with an IBM compatible 486 DX-2 personal computer.
Base-Calling Software. The initial full-spectral data was first reduced to four single-dye channels by fitting each spectrum to the four dye-primer spectra by multivariate linear regression.13 Noise was then removed from each dye channel by Wiener filtering.18 Baseline correction was accomplished by subtracting from each point of a filtered channel the minimum value in a window centered on that point. The first base-calling method used a graph-theoretic algorithm to determine a regularly spaced subset from a list of possible peaks, with consideration given to peak height.19 The second method used adaptive equalization, a signal-processing procedure employed in high-speed computer modems to determine a binary sequence from a noisy, distorted signal.20 The first method contained modifications from the published procedure19to avoid the need for prior knowledge of peak shape, base spacing, or dye mobility shifts. A high-quality separation region was initially located by sequencing each 5-min block of data independently, with peaks being determined from maxima in the signal. Because the graph-theoretic algorithm generates each sequence with a quality score, peak spacing and dye mobility shifts for a block were taken as the values that gave the best score. The sequence from the 5-min block with the smallest relative standard deviation in base call spacing was extended in both directions, a few bases at a time. Where separation was poor, peak detection was repeated after improving resolution by constrained deconvolution.21 Following each extension, the expected local values of spacing and mobility shifts were revised to improve the score from the graph algorithm. Base calling was terminated when the signal height changed abruptly.
The second base-calling method used the dye mobility shifts, the sequence starting position, and the initial peak spacing determined from the graph-theoretic algorithm. Adaptive equal-ization was then applied to consecutive time blocks. Each block was filtered to reduce peak overlap by sharpening peaks to a level dependent on noise and the estimated base separation. The filter was updated between blocks to adapt to time-varying signal properties such as peak height. Calls were made from the filter output based on a confidence measure that included signal to noise
(12) Zhang, J.; Fang, Y.; Hou, J. Y.; Ren, H. J.; Jiang, R.; Roos, P.; Dovichi, N. J. Anal. Chem.1995, 67, 4589-4593.
(13) Ruiz-Martinez, M. C.; Carrilho, E.; Berka, J.; Kieleczawa, J.; Miller, A. W.; Foret, F.; Carson, S.; Karger, B. L. Biotechniques 1996, 20, 1058-1069.
(14) Nishikawa, T., Kambara, H. Electrophoresis 1994, 15, 215-220.
(15) Craig, I. W. J. Inherited Metab. Dis. 1994, 17, 391-402.
(16) Marshall, E. Science 1995, 267, 783-784.
(17) Carson, S.; Cohen, A. S.; Belenkii, A.; Ruiz-Martinez, M. C.; Berka, J.; Karger, B. L. Anal. Chem. 1993, 65, 3219-3224.
(18) Press, W. H.; Flannery, B. P.; Teukolsky, S. A.; Vetterling, W. T. Numerical Recipes: The Art of Scientific Computing; Cambridge University Press: Cambridge, England, 1986.
(19) Berno, A. J. Genome Res. 1996, 6, 80-91.
(20) Proakis, J. G. Digital Communications, 3rd ed.; McGraw-Hill: New York, 1995.
(21) Agard, D. A.; Steinberg, R. A.; Stroud, R. M. Anal. Biochem. 1981, 111, 257-268.
levels and spacing uniformity. Full details of this base-calling method, still under development, will be given separately.22
Sequencing Chemistries. Two sequencing labeling chem-istries were used in this work: single dye and four dyes. Single dye-labeled sequencing reactions were performed using FAM-labeled primer (-21) (ABI/Perkin Elmer Corp., Foster City, CA) on a ssM13mp18 DNA template (New England Biolabs, Beverly, MA) with Sequenase version 2.0 (Amersham Life Science, Cleve-land, OH) and terminated with dideoxythymidine triphosphate (ddTTP; Amersham Life Science). The sequencing reactions were performed according to the Amersham Life Science protocol, and the products were purified by ethanol precipitation. For the four dye separations, cycle-sequencing chemistry was used with labeled universal (-21) primers (i.e., FAM, JOE, TAMRA, and ROX) and AmpliTaq-FS (ABI/Perkin Elmer). The temperature-cycling pro-tocol was performed on a PTC100 instrument (MJ Research, Inc., Watertown, MA). The protocol was 15 cycles of 10 s at 95°C, 5 s at 50°C, and 1 min at 70°C, followed by 15 cycles of 10 s at 95 °C and 1 min at 70 °C. ssM13mp18 template (0.10 µg) was employed for the cycle-sequencing samples, and the reaction products were purified by ethanol precipitation. The samples were redissolved in 30 µL of either water or dimethyl sulfoxide. Electrokinetic injection was utilized in all cases, with the specific details listed in the figure captions. Prior to injection the sample was heated to 95°C for 2 min and immediately cooled on ice.
Capillary Columns. The inner walls of the capillary were covalently coated with poly(vinyl alcohol) (PVA). These coated capillaries are available from Beckman Instruments Inc. (Fullerton, CA). For the LPA molecular weight standard solutions, the capillary coating was that described by Hjerte´n.23 The specific column lengths and electrophoretic conditions are listed in the figure captions.
Chemicals. Acrylamide, N,N,N′,N′ -tetramethylethylenedi-amine (TEMED), ammonium persulfate, and urea were obtained from ICN Biomedicals, Inc. (Aurora, OH), and Tris, TAPS, boric acid, and EDTA from Sigma (St. Louis, MO). All chemicals were either electrophoresis or analytical grade, and no further purifica-tions were performed. The water used in all reacpurifica-tions and solutions was deionized (18.2 MΩ) with a Milli-Q water purification system (Millipore, Worcester, MA).
Toxicity. Acrylamide monomer is toxic and should be handled with care; avoid skin contact. Formamide is a teratogenic agent and should also be handled carefully.
LPA Solutions. Linear polyacrylamide molecular weight standards (Polysciences, Inc., Warrington, PA) of 8.0×10⁴, 4.0× 10⁵, 6.0×10⁵, and 1.0×10⁶were dissolved in 1×TBE (100 mM Tris/100 mM boric acid/2 mM EDTA)/3.5 M urea/30% (w/v) formamide buffer at concentrations ranging from 4 to 8% (w/v). All standard polymer solutions were introduced into the capillaries using a gas-tight microsyringe (50-100µL) (Hamilton Co., Reno, NV), connected to the capillary by a short Teflon tube (255µm i.d.). The polymer matrix was replaced from the capillary after each run.
The synthesis of high molecular weight LPA solutions con-sisted of preparing a solution of 4, 6, or 8% (w/v) acrylamide in water or buffer, cooling to 0°C, and purging for at least 30 min with high-purity helium to minimize dissolved oxygen. The polymerization was initiated by the addition of 1µL of 10% (w/v)
ammonium persulfate and 1 µL of 10% (v/v) TEMED/mL of acrylamide solution. The polymerization was allowed to proceed to completion over 24 h at 0°C, without stirring. Urea, concen-trated buffer solutions, and water were added to the stock LPA solution to produce the final separation matrix of proper dilution. A modification of this procedure consisted in purging high-quality helium during the polymerization reaction, along with constant stirring of the solution. The use of this procedure allowed the polymerization of LPA with an average molecular weight in excess of 5.5×10⁶Da (see next section).
Polymer Characterization. In-house LPA solutions were characterized in terms of yield and polymer molecular weight. To determine the yield, the residual acrylamide concentration was quantitated using reversed phase liquid chromatography. An aliquot of 100µL of polymer solution, diluted 100-fold in water, was vortexed and then injected into a Nucleosil RP-C8 column (Keystone Scientific, Bellefonte, PA) in an HPLC system (Model 126, Beckman Instruments). A 95:5 water/methanol (v/v) mobile phase was used, and the residual acrylamide was detected at 254 nm. The molecular weight of LPA was determined by size exclusion liquid chromatography (SEC) (Bischoff, Leonbert, Germany). An Ultrahydrogel 2000 column (Waters, Milford, MA) was used, with a mobile phase of 50 mM sodium sulfate. In order to calibrate the SEC column, a series of LPA molecular weight standards (American Polymer Standards Corp.) were employed. RESULTS AND DISCUSSION
The goal of this work was to extend the read length per run for DNA sequencing using CE and replaceable polymer matrixes. Since our laboratory has had the most success with LPA for DNA sequencing, we decided to focus on the properties of this polymer. After examining the effects of LPA molecular weight and concen-tration using commercially available LPA molecular weight standards, high-purity LPA solutions were produced in-house. Following optimization of separation conditions and with the use of recently developed base-calling software, DNA sequencing up to 1000 bases in 80 min has been achieved.
Separation in CE can be expressed in terms of resolution (Rs) for two adjacent peaks as24
where∆µ is the difference in electrophoretic mobility for two DNA-sequencing fragments,µavis the average mobility between two fragments, and N is the number of theoretical plates. The first term on the right-hand side of eq 1 can be considered the relative band spacing or separation selectivity. The selectivity can be readily determined from the electropherogram using the migration time of two fragments (tm1) and (tm2):
The second term in eq 1 is the efficiency (N) of separation, which can be calculated from
(22) Brady, D. P.; Miller, A. W.; Karger, B. L., in preparation.
(23) Hjerten, S. J. Chromatogr. 1985, 347, 191-198. (24) Giddings, J. C. Sep. Sci. 1969, 4, 181-189.
Rs) 1/ 4| ∆µ µav|N 1/2 (1) |∆µµ av |)2| tm1-t m2 tm2+t m1 | (2)
where w0.5 is the width of the peak at half-height and tmis the migration time for the sequencing peak of interest. In the following discussion, both the selectivity and efficiency are considered in the evaluation of the influence of LPA solution conditions on the separation of DNA-sequencing reaction products by CE.
LPA Molecular Weight Standard Solutions. The use of molecular weight standards allowed the independent study of two fundamental parameters affecting the separation of sequencing reaction productsspolymer molecular weight and solution con-centration. The effect of LPA molecular weight and concentration cannot be individually evaluated from solutions polymerized with varying concentrations of monomer. For example, a change to higher concentrations of acrylamide monomer in the polymeri-zation, with constant levels of radical initiator and catalyst, will produce a simultaneous increase in both the polymer concentra-tion and molecular weight.25
A. Polymer Concentration. A series of solutions, ranging in concentration between 4 and 8% (w/v), were prepared using a 4.0×10⁵Da LPA polymer standard. The relatively low molecular weight of the polymer allowed for homogeneous solutions to be prepared rapidly and reproducibly up to 8% (w/v). These polymer matrixes were used to separate sequencing reaction fragments generated from a single-dye FAM-labeled primer (-21) and one terminator (ddTPP) on ssM13mp18 using Sequenase version 2.0. From the resulting electropherograms, the migration time vs base number at various LPA concentrations was plotted (see inset to Figure 1) with the experimental points being fitted by a third-order polynomial. All fitting functions presented in this work were performed using Microcal Origin 3.73 software (Microcal Software Inc., Northampton, MA). It should be noted that these molecular weight standards were found to contain a large amount of impurities leading to poor signal to noise ratio for laser-induced fluorescence detection, and thus the migration time data for fragments larger than 500 bases could not be easily obtained in all separations.
The polynomial function used to fit the experimental values of migration time vs base number was employed to generate a curve that describes the absolute value of the separation selectivity (eq 2) as a function of base number (see Figure 1). As expected,26 the selectivity for the low base numbers was higher for the more concentrated polymer solutions and decreased with base number for all polymer concentrations. In addition, the rate of change in selectivity with base number was significantly greater for higher concentrations of LPA solutions.
For all columns, the selectivity approached zero for higher molecular weight sequencing fragments. A decrease in slope at high base number in migration time vs base number could be observed, especially for the 6 and 8% (w/v) matrixes (inset, Figure 1). The migration time plateau has been seen by others with cross-linked gels27and polymer solutions28,29and is manifested as a large peak at the end of the electropherogram. The plateau
has been attributed for dsDNA to biased reptation with alignment of the fragments in the electric field.30,31 For any polymer concentration, the efficiency of the peaks was also observed to decrease with high base number (see later); however, there was no significant difference in efficiency for a specific fragment among the various LPA concentrations. Several previous reports (e.g., ref 31) suggested that the number of resolvable DNA fragments per run could be extended by raising the polymer solution concentration. The migration time results in Figure 1, providing a constant column efficiency, however, suggest that the read length per run cannot be increased by simply increasing the polymer concentration.
B. Polymer Molecular Weight. Previous work demon-strated that a higher molecular weight polymer solution at a fixed concentration of 6%T increased the number of resolvable sequenc-ing fragments per run.4 In order to evaluate further the role of molecular weight on the separation, LPA standards of 8.0×10⁴, 4.0 × 10⁵, 6.0× 10⁵, and 1.0 × 10⁶Da were used to prepare
(25) Nossal, R. Macromolecules 1985, 18, 49-54.
(26) Rodbard, D.; Chrambach, A. Proc. Natl. Acad. Sci. U.S.A. 1970, 65, 970
-977.
(27) Luckey, J. A.; Norris, T. B.; Smith, L. M. J. Phys. Chem. 1993, 97, 3067
-3075.
(28) Grossman, P. D. J. Chromatogr. A 1994, 663, 219-227.
(29) Manabe, T.; Chen, N.; Terabe, S.; Yohda, M.; Endo, I. Anal. Chem. 1994, 66, 4243-4252.
(30) Slater, G.; Rousseau, J.; Noolandi, J.; Turmel, C.; Lalande, M. Biopolymers 1988, 27, 509-524.
(31) Viovy, J. L.; Duke, T. Electrophoresis 1993, 14, 322-329.
N)5.5
(
tm w0.5)
2
(3)
Figure 1. Selectivity (∆µ/µav)vs base number using solutions of LPA
standard (4.0× 10⁵Da) with varying polymer concentration of 4
(-‚-), 5 (‚‚‚), 6 (--), and 8% (s) (w/v). The corresponding plots of migration time vs base number for the 4 (9), 5 (b), 6 (2), and 8%
(1) (w/v) LPA solutions are shown in the inset. Conditions: capillary
effective length 30 cm, total length 45 cm, inner diameter 75µm, constant electric field 200 V/cm, running buffer 100 mM Tris/100 mM boric acid/2 mM EDTA/30% (w/v) formamide/3.5M urea, room temperature, and electrokinetic injection from DMSO for 15 s at 200 V/cm. The sample was prepared with FAM-labeled primer (-21) on ssM13mp18 and terminated with ddTTP.
solutions at a fixed concentration of 4% (w/v). LPA polymer standards with molecular weights of 5.0×10⁶and 9.0×10⁶Da were also examined, but reproducible preparation of homogeneous solutions was not readily achieved.
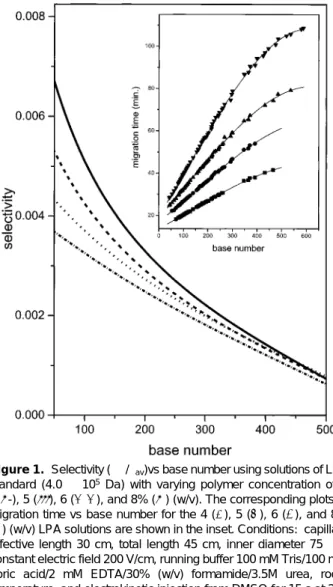
Figure 2 presents a plot of selectivity vs base number with different molecular weight LPA solutions with constant concentra-tion [4% (w/v)]. The inset again shows the original data (migra-tion time vs base number) fitted with a third-order polynomial. While some minor differences exist between Figures 1 and 2, due to different ambient temperatures and batches of polymer stan-dards, the general trend of reduced selectivity with base number is again observed. Up to roughly 500 bases, the selectivity appeared to be somewhat better with higher molecular weight LPA; however, at high base number, the selectivity merged to a common low value for all solutions. The inset in Figure 2, when compared to that of Figure 1, also reveals that the migration time was much more dependent on polymer concentration than molecular weight, an important result in the optimization of separation while maintaining rapid analysis time.
Whereas the separation efficiency was not significantly affected by the concentration of LPA, there was substantial change in efficiency with LPA molecular weight. Figure 3 presents the efficiency (number of theoretical plates per meter) vs base number for the separation of sequencing fragments in polymer solutions with constant concentration and different molecular weight. An 8 ×10⁴Da LPA standard at 4% (w/v) is also included for the purpose of clarity; less points are present in this curve due to the poor separation. The efficiency was calculated for peaks that are
singlets in the electropherogram in order to accurately calculate the width of the peak at half-height (eq 3) when the resolution was less than 1. The data was fitted with a second-order polynomial for the 80 000 Da solution and with a fifth-order polynomial for the other solutions.
For each polymer solution, a maximum in efficiency (Nmax) was observed, and this maximum was linearly shifted to longer DNA fragments with increase in LPA molecular weight (see inset). In addition, the absolute value of Nmax increased with LPA molecular weight. The improvement in efficiency at high base numbers with increasing polymer molecular weight has also been reported by others.6,32
The results in Figures 1-3 suggested that the use of low concentrations [e4% (w/v)] of LPA of high molecular weight (>1.0×10
6Da) could increase the read length per run without substantially raising the analysis time through a significant improvement in separation efficiency (Figure 3) and some enhancement in selectivity (Figure 2). We next decided to explore such high molecular weight polymer solutions in more depth.
Several factors led us to decide to polymerize LPA in-house. The above polymer standards were not made specifically for electrophoresis with laser-induced fluorescence detection and were found to contain significant amounts of impurities, as evidenced by the high background and the presence of spurious spikes in the electropherograms. Furthermore, the solubility of
(32) Wu, C.; Quesada, M. A.; Schneider, D. K.; Farinato, R.; Studier, F. W.; Chu, B. Electrophoresis 1996, 17, 1103-1109.
Figure 2. Selectivity (∆µ/µav) vs base number using 4% (w/v) LPA
solutions with varying molecular weight standards of 4.0×10⁵( s),
6.0×10⁵(--), and 1.0×10⁶Da (‚‚‚). The corresponding plots of migration time vs base number in 4% (w/v) LPA solutions of 4.0× 10⁵(
9), 6.0×10⁵(b), and 1.0×10⁶Da (2) are shown in the inset.
Sample and conditions: see Figure 1.
Figure 3. Number of theoretical plates per meter vs base number using 4% (w/v) LPA solutions prepared with molecular weight standard of 8.0×10⁴(
9), 4.0×10⁵(b), 6.0×10⁵(2), and 1.0×10⁶Da (1)
are presented. The inset presents the linear relation between base number atNmaxand molecular weight of LPA. The separations used
high molecular weight LPA standards (>5.0×10
6Da) was low, and complete homogeneity was not easily achieved, as seen by nonreproducible run to run separations of sequencing products. The lifetimes of the capillary coatings (either PVA or polyacryla-mide) were also found to be significantly reduced by the use of the LPA molecular weight standards (relative to in-house polym-erized LPA). Finally, the synthesis of LPA provided controlled conditions for the optimization of replaceable matrixes for long read lengths. Details on the polymerization of LPA can be found on the Experimental Section.
In-House LPA Solutions. A. Characterization. The po-lymerization reaction yield was determined by quantitation of the residual monomer (acrylamide) using reversed phase liquid chromatography and was found to be higher than 98% for all solutions. High polymerization yield is important to produce reproducible LPA polymers.
SEC was employed to determine the average molecular weight (Mw) of LPA polymers. Three different LPA solutions were prepared in the laboratory to be used for DNA sequencing: (a) 4%T polymerized in buffer and denaturants, (b) 8%T in water, and (c) 6%T in water polymerized with constant helium purging. For the 4 and 8%T polymer solutions, the molecular weight was determined using LPA molecular weight standards for calibration of the SEC column. The average molecular weight (Mw) for the 4%T was found to be 1.0×10⁶Da and for the 8%T was 3.0×10⁶ Da. The 4 and 8%T solutions were used to characterize the effect
of concentration on the separation of sequencing fragments, especially for fragments larger than 600 bases (see next section). A 6%T solution was made in order to increase as much as possible the average molecular weight of LPA. For this purpose the reaction vessel for the polymerization reaction was stirred and constantly purged with helium. (Polymerization with constant helium purging of an 8%T in water resulted in a solution too viscous to handle in the dilution step.) In order to characterize this polymer, a molecular weight standard with Mw)5.5×10
6
Da was used to calibrate the SEC column with the Hamilec approach.33 Unfortunately, although the HPLC column provided the highest exclusion limit available, an accurate calibration of the column could not be achieved. A considerable portion of the LPA standard (5.5×10⁶Da) had a molecular weight beyond the exclusion limit and eluted unresolved with the column dead volume. However, by comparing the SEC results of the 6%T polymer with the molecular weight standard (5.5×10⁶Da), the former was deduced to be somewhat higher than 5.5×10⁶Da. Further work is being conducted in order to characterize the LPA produced by this polymerization.
B. Effect of Polymer Concentration. Throughout the course of this work, it was observed that using low concentrations of LPA in 1 ×TBE buffer, the peaks at the beginning of the
(33) Malwer, E. G.; Montana, A. J. Polym. Sci. 1980, 18, 2303-2305.
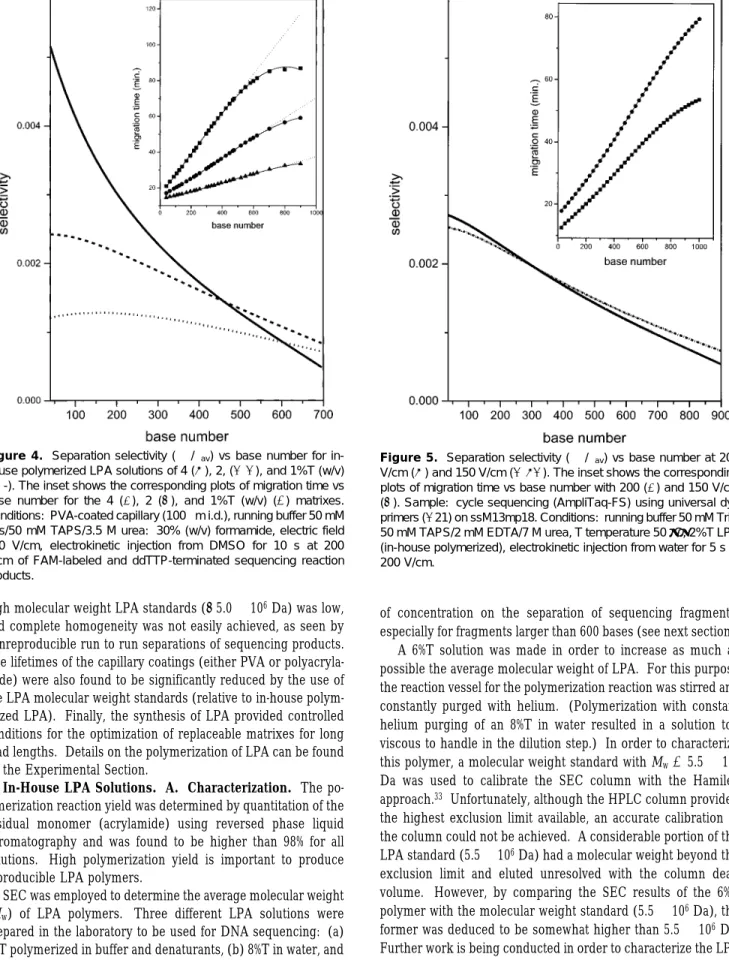
Figure 4. Separation selectivity (∆µ/µav) vs base number for
in-house polymerized LPA solutions of 4 (s), 2, (--), and 1%T (w/v) (- - -). The inset shows the corresponding plots of migration time vs base number for the 4 (9), 2 (b), and 1%T (w/v) (2) matrixes.
Conditions: PVA-coated capillary (100µm i.d.), running buffer 50 mM Tris/50 mM TAPS/3.5 M urea: 30% (w/v) formamide, electric field 200 V/cm, electrokinetic injection from DMSO for 10 s at 200 V/cm of FAM-labeled and ddTTP-terminated sequencing reaction products.
Figure 5. Separation selectivity (∆µ/µav) vs base number at 200
V/cm (s) and 150 V/cm (-‚-). The inset shows the corresponding plots of migration time vs base number with 200 (9) and 150 V/cm
(b). Sample: cycle sequencing (AmpliTaq-FS) using universal dye
primers (-21) on ssM13mp18. Conditions: running buffer 50 mM Tris/ 50 mM TAPS/2 mM EDTA/7 M urea, T temperature 50°C, 2%T LPA (in-house polymerized), electrokinetic injection from water for 5 s at 200 V/cm.
electropherogram were irregular (e.g., gaps, peak distortions) affecting the separation of the first 50-100 fragments. It has been
reported that any residual glycerol, present in many DNA polymerase preparations (e.g., Sequenase version 2.0), could
Figure 6. DNA sequencing using AmpliTaq-FS cycle sequencing and labeled (-21) primers on ssM13mp18. Base-calling errors are marked under the sequence: dash, overcall; base letter, substitution; base letter with dash above it, undercall. Conditions: electric field 150 V/cm; other conditions as in Figure 5.
complex with boric acid found in the separation buffer.34 It was therefore decided to test a buffer consisting of Tris (50 mM)/ TAPS (50 mM)/EDTA (2 mM)/7 M urea, which avoided such glycerol complexation. Gaps or distorted peaks were minimized, and the reliability of sequence was thus improved; therefore, this buffer was adopted for the rest of the work.
The effect of polymer concentration of the in-house material on the separation of DNA sequencing fragments was first explored using the 4%T (Mw)1×10
6Da) and the 8%T stock solution in water (Mw ) 3.0 × 10
6 Da). The latter was diluted with concentrated sequencing buffer and denaturants to 2 and 1% (w/ v) (For the diluted LPA solutions, % (w/v) represents the weight percentage of polymerized LPA solution diluted to a final volume); unfortunately, 4% (w/v) could not be prepared starting from 8%T. Figure 4 shows the relationship of selectivity to base number for three LPA solutions, and the inset presents migration time as a function of base number for the separation of sequencing fragments. The data points were fitted both by a linear regression function and a third-order polynomial. The third-order polynomial fits were performed using all experimental data points from 40 to 1000 bases in length (solid line in the inset Figure 4). This polynomial function was then utilized to generate the separation selectivity function (see Figure 4). Linear regression fits were obtained for a subset of each data: for the 4% (w/v) this subset was 40-550 bases, 2% (w/v) 40-690 bases, and 1% (w/v) 40 -804 bases. As indicated, the linear dependence extended to longer sequencing fragments with lower polymer concentration of higher molecular weight. The slopes of the linear regression fit of the experimental data were, as expected,26linearly proportional to the solution concentration (r2
>0.999).
It can be observed in Figure 4 that a higher selectivity is obtained for the 4%T than for the 2 (w/v) and 1%T (w/v) in the low base number region. While the separation selectivity is poorer with the lower LPA concentrations, the rate of change in selectivity with base number is far less for these polymer solutions, in agreement with that found in Figure 1. Importantly, the selectivity for long base number fragments in the 2% (w/v) solution exceeded that of the 4%T. This result can be further seen in the inset where the 4%T polymer solution tends toward the plateau in migration time at a lower base number (i.e., 550 bases) than the 2% (w/v) solution (i.e., 690 bases). It is to be noted that the 2% (w/v) polymer is 3-fold higher in molecular weight, and this could contribute somewhat to the improved selectivity at high base number. Unfortunately, it was found that the selectivity for the 1% (w/v) polymer solution was too low for improved sequence reading over the 2% (w/v), i.e., the 1% (w/v) solution was too dilute. Nevertheless, reduced polymer concentrations could extend the read length. It is interesting to note that the extension in the number of resolvable DNA fragments with decrease in polymer solution concentration has been also observed by others in the separation of dsDNA in hydroxyethyl cellulose35and for sequencing fragments.29
Another advantage of the low-concentration matrixes, relative to the higher concentrations of earlier work, was that the migration time of the sequencing was faster. Moreover, these matrixes had low viscosity, an important consideration in the automated
replacement of the solution from the capillary columns, especially in a multiple capillary array.
As evidenced in Figures 2-4, increases in LPA molecular weight should elongate the read length by improving both the efficiency and the selectivity of the separation. To obtain very high molecular weight LPA, a modification of the polymerization process was employed. The molecular weight of the 2% (w/v) in-house was enhanced by polymerizing 6%T with constant helium purging and stirring during polymerization (see Experimental Section). The 6%T solution, with a molecular weight in excess of 5.5×10⁶Da, was then diluted to 2% (w/v) and used for DNA sequencing. The solution was diluted to this concentration in order to obtain long read lengths and short analysis times (see Figure 4). Furthermore, the maximum in efficiency for this material using a column temperature of 50°C was obtained at ∼390 bases, consistent with the results shown in Figure 3.
C. Column Temperature and Electric Field. As seen above, the ability to achieve long read lengths in CE is limited by the approach to constancy of migration for large fragments (plateau region), along with a loss in column efficiency. Two important factors that can influence the base number at which the migration plateau forms are the column temperature and electric field. Separately, we have shown that operation of column above ambient temperatures increases the potential of read length by extending the plateau region.36 The higher temperatures also yield faster separations and help to reduce strong secondary structure compressions [e.g., hairpins37]. The improved results with elevated temperature have also been observed by others.12 Experimentally, we have found that 50°C was an effective column temperature for long reads with the 2% (w/v) LPA column and buffer conditions (Tris/TAPS/EDTA/7 M urea).
The influence of electric field was briefly explored (see Figure 5). As expected, the lower field of 150 V/cm extended the read length at 50°C by displacing the plateau region to longer base numbers. Figure 5 plots selectivity as a function of base number for the separation of sequencing fragments at both 200 and 150 V/cm. The selectivity for the separation at 200 V/cm is seen to approach zero at a shorter base number than for the lower electric field. Although small changes in selectivity are observed with electric field strength, these are significant for increasing the read length. For example, for a fragment 796 bases in length, the change in selectivity observed between 150 and 200 V/cm, assuming constant efficiency, resulted in a resolution improvement of∼20%.
The improved selectivity at lower electric fields is also evidenced in the inset of Figure 5, where the migration time vs base number appears to be approaching a plateau in migration time at a lower base number for the 200 V/cm electric field. Nevertheless, the use of 200 V/cm provided for separation up to 800 bases in 45 min with an accuracy of 99.0% (see Table 1 for comparison to 150 V/cm). Thus, higher fields result in faster sequencing at expense of shorter read lengths.
As already noted, the plateau region has been attributed to biased reptation of single-stranded fragments,28in analogy to well-studied dsDNA.30,31 The higher the electric field the shorter shouldbe the base number for which this biased reptation region begins; thus, lower electric fields would be expected to extend
(34) Pisa-Williamson, D.; Fuller, C. W. Comments USB, Lifesci. 1992, 19, 29
-36.
(35) Mitnik, L.; Salome, L.; Viovy, J. L.; Heller, C. J. Chromatogr. A 1995, 710, 309-321.
(36) Kleparnik, K.; Foret, F.; Berka, J.; Goetzinger, W.; Miller, A.; Karger, B. L. Electrophoresis, in press.
(37) Hirao, I.; Nishimura, Y.; Tagawa, Y.-i.; Watanabe, K.; Miura, K.-i. Nucleic Acids Res.1992, 20, 3891-3896.
read length, at the price of analysis time. Additionally, elevated temperature should input thermal energy into the molecule, reducing the extent of field alignment by single-stranded DNA molecules.38 This additional thermal energy would then extend the number of bases at which biased reptation begins.
DNA Sequencing with Long Reads. With the above experi-mental results, 2% (w/v) LPA (g5.5×106Da) solution, column operation at 50°C, and constant electric field of 150 V/cm were selected for DNA sequencing. Figure 6 presents a separation of cycle-sequencing reaction products by CE using AmpliTaq-FS (ABI/Perkin-Elmer) on ssM13mp18 with labeled universal primers (-21). This sequencing chemistry was advantageous due to the higher and more uniform signals obtained for the sequencing fragments in comparison with isothermal chemistries (e.g., Se-quenase version 2.0). An added advantage was that the chemistry used lower amounts of both template and deoxynucleotides, permitting simpler purification than previously.13
The electropherogram shows a sequence for fragments from 17 bases after the primer to∼1100 bases. The sequence in Figure 6 was read by base-calling software described in the Experimental Section, combining a modified version of a graph-theoretic method and adaptive equalization. As can be seen, four errors occurred in the first 28 bases called; no other errors were then found until base 730. Table 1 summarizes the accuracy of base calling on these data by both the combined method (graph-theoretic plus adaptive equalization) and the graph-theoretic method alone. The combined method is seen to extend the read length with 99%
accuracy more than 10% over the graph-theoretic, from 750 to 836 bases. The accuracy of both methods decreased, starting at about base 850; however, the combined method still had an accuracy of 96.8% at 1000 bases. The greater accuracy when equalization was used resulted from fewer errors in determining the correct number of peaks in unresolved peak clusters. Separately, adaptive equalization has been found to increase read lengths for slab gel sequencing. Details of the adaptive equalization base-calling software will be presented elsewhere.22
CONCLUSIONS
The separation and base-calling of sequencing fragments up to∼1000 bases has been demonstrated in 80 min of analysis time. This result is due to the use of new cycle-sequencing chemistry, improved polymer matrix and electrophoretic conditions, and base-calling software. Traditional slab gel instrumentation have achieved similar read lengths; however, the run times are 8-18 h.
2,3 With the advent of a multiple capillary array instrument, the developed methodology could provide at least a 10-fold increase in through-put vs current slab gel methods. Further work is underway to extend even more the sequence reads, to utilize other sequencing chemistries, and to adapt such separation performances to a multiple capillary array instrument.
ACKNOWLEDGMENT
The authors acknowledge the DOE under the Human Genome Project Grant DE-FG02-90ER 60985 and NIH under Project HG01413 for support of this work. Support by DOE does not constitute an endorsement of the views expressed in this article. E.C. thanks Conselho Nacional de Desenvolvimento Cientı´fico e Tecnolo´gico (CNPq), Brazil, for a scholarship. M.C.R.M. thanks the Department of Energy under the Human Genome Project Distinguished Postdoctoral Fellowship Program for their financial support. The authors also thank A. J. Berno for useful discussions regarding the base-calling program and Franta Foret for significant contributions to instrument design. This is contribution No. 673 from the Barnett Institute.
Received for review April 24, 1996. Accepted July 26, 1996.X
AC960411R (38) Lumpkin, O. J.; Dejardin, P.; Zimm, B. H. Biopolymers 1985, 24, 1573
-1593. XAbstract published in Advance ACS Abstracts, September 1, 1996. Table 1. Base-Calling Accuracy for DNA Sequencinga
no. of bases cumulative error (%) graph-theoretic graph-theoretic plus adaptive equalization 1 750 836 2 847 891 3 921 940 4 1017 1050 5 1055 1096
![Figure 2 presents a plot of selectivity vs base number with different molecular weight LPA solutions with constant concentra-tion [4% (w/v)]](https://thumb-us.123doks.com/thumbv2/123dok_us/1615066.2719255/5.918.88.839.61.931/figure-presents-selectivity-different-molecular-solutions-constant-concentra.webp)