SUSTAINED NO-TILL ADOPTION IN THE AGRO-ECOSYSTEMS OF GHANA: A FRAMEWORK FOR FINANCIAL AND RISK MANAGEMENT
OPTIONS
A Thesis by
KWADWO AMPONSAH
Submitted to the Office of Graduate and Professional Studies of Texas A&M University
in partial fulfillment of the requirements for the degree of
MASTER OF SCIENCE
Chair of Committee, Frederick Boadu Co-chair of Committee, Edwin Price Committee Member, Chanda Elbert Head of Department, Parr Rosson
May 2017
Major Subject: Agricultural Economics Copyright 2017 Copyright Kwadwo Amponsah
ii
ABSTRACT
The conservation agricultural practice of no-till is known to improve soil physical and chemical properties through enriching soil organic matter, improving soil moisture conservation, labor saving and the ability to sustain the productivity of land for a long period of time. No-till is considered one practice for sustainable food production in Sub- Saharan African and the rest of the world to meet the food demands of the growing population. Farmers are encouraged to adopt the no-till technology as scientific research has proven the comparative soil improvement potential of the system. However, there is little knowledge on the socio-economic aspects of no-till practice in terms of the profitability of the practice and the financial risks associated with no-till. This paper uses enterprise farm budgets to analyze the labor use, cost and profitability of no-till and conventional tillage in four agro-ecological zones in Ghana and uses these budgets as analytical tools to help farmers manage risk.
Two data sets were used in the study. The first data set was used in building budget models and was based on the daily farm activities of 24 farms located in the 4 agro-ecological zones. Three no-till farmers and three conventional farmers were selected at random from the ecological zones. The second data set is an economic-anthropological survey to track farmers’ farming histories and views on the sustainability of the small farm in Ghana giving the aging population and the lack of youth interest in agriculture as a profession.
iii
The budgets show labor need and cost for no-till and conventional tillage varying in different ecological zones and with different farm activities. Yields of cereals were higher for no-till in all ecological zones. Profits realized from no-till farmers who practiced mono-cropping with maize were higher than conventional farmers. However, mixed cropping was more profitable under each system, particularly when tomatoes were grown. Farm produce prices were lower in the bumper seasons and higher in the lean seasons. The increase in energy prices and removal of subsidies on farm inputs reduced farm profits.
The budgets should be considered as policy and risk management tools in agricultural research institutions such as Ministry of Food and Agriculture Ghana (MOFA) and the No-till Center to help farmers make better decisions in managing risk to increase their profits.
iv
ACKNOWLEDGEMENTS
I would like to thank my committee chair, Dr. Fred Boadu, and my committee members, Dr. Edwin Price, and Dr. Chanda Elbert for their guidance and support throughout the course of this research.
Thanks also go to Mr. Kofi Boa, Director of the Center for No-till
Agriculture for his assistance in the collection of data and supply of other valuable information on no-till agriculture. Again I would like to show my sincere gratitude to the extension officers in the various districts who offered their time and effort in collecting and sending of the data. A big thank you also goes to the 24 farmers across the ecological zones who willingly provided the necessary information needed for the study.
Thanks also go to my friends and colleagues and the department faculty and staff for making my stay at Texas A&M University a great experience. I also want to extend my gratitude to the Center for Conflict and Development, which provided the assistantship and funding for the study.
v
NOMENCLATURE
APPL. Application
AVC Average Variable Cost
CSO Civil Society Organization
DAES Directorate of Agricultural Extension
FAO Food and Agriculture Organization
GDP Gross Domestic Product
GHC Ghana Cedi
GSS Ghana Statistical Service
HR Hour
MOFA Ministry of Food and Agriculture
No. Number
SSA Sub-Saharan Africa
TC Total Cost
TR Total Revenue
USDA United States Department of Agriculture
vi TABLE OF CONTENTS Page ABSTRACT ... ii ACKNOWLEDGEMENTS ... iv NOMENCLATURE ... v TABLE OF CONTENTS ... vi
LIST OF FIGURES ... viii
LIST OF TABLES ... x
1. INTRODUCTION AND LITERATURE REVIEW ... 1
Literature Review... 4
Risk Management in Farming... 4
Farm Budgets ... 5
Reasons for Farm Budgeting ... 8
Cropping Systems in Ghana ... 9
What is No-till? ... 12
Why the Need for No-till ... 13
Economics of No-till ... 13
Role of the Extension System ... 19
2. STUDY AREA, SURVEY, AND DESCRIPTIVE STATISTICS ... 21
Study Area ... 21
Atwima Nwabiagya (Forest Zone) ... 23
Ejura Sekyedumasi (Transition Zone)... 24
Ga West District (Coastal Savannah) ... 25
East Mamprusi (Guinea Savannah) ... 26
Survey ... 28
vii
3. METHODOLOGY ... 35
Method for Building the 72 Crop Budgets ... 35
Financial Futures Budget Building ... 37
4. RESULTS AND DISCUSSION ... 40
Anthropological Survey Report ... 40
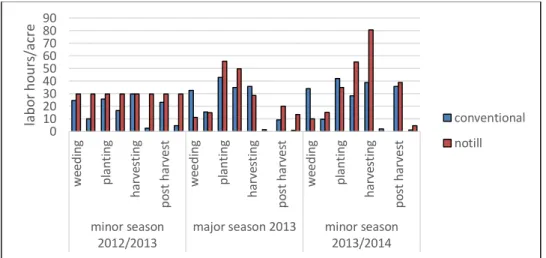
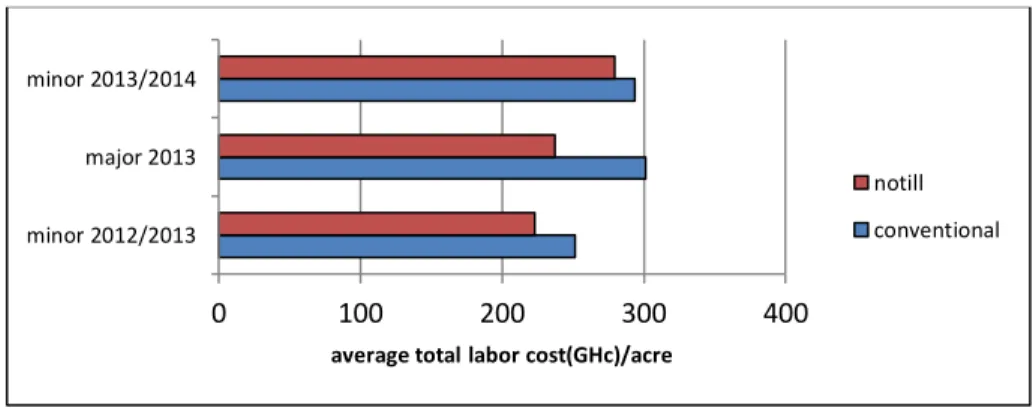
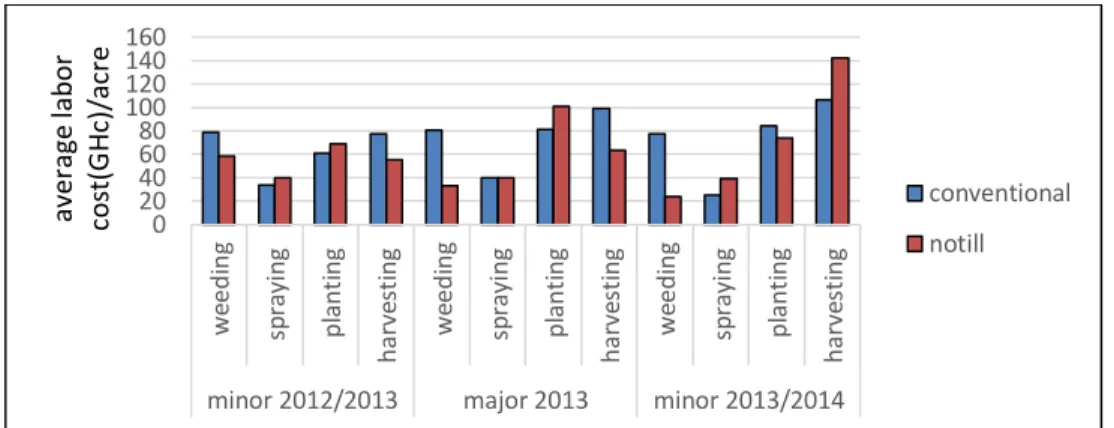
Labor Requirement and Cost of Labor for No-till and Convectional Till ... 43
Forest Zone ... 43
Guinea Savannah Zone ... 46
Transition Zone ... 49
Coastal Savannah Zone ... 52
Labor Cost per Hour Comparison ... 54
Crop Yields and Average Prices of Farm Produce ... 58
Profitability of Farming Systems and Alternative Crop Mix……….. 61
Input Costs and Their Effect on Profits ... 64
Energy Prices and Their Effects on Farm Profits ... 66
5. DISCUSSION AND CONCLUSION ... 68
Discussion... 68
Conclusion ... 73
Study Limitations and Future Research ... 76
REFERENCES ... 77
APPENDIX A ... 86
APPENDIX B ... 90
viii
LIST OF FIGURES
Page Figure 1. Agro-ecological Map of Ghana ... 21 Figure 2. Average Total Labor Hours for each Cropping Season (Forest Zone) .... 44 Figure 3. Labor Requirement for Farming Activities per Acre (Forest Zone) ... 44 Figure 4. Average Total Labor Cost Per Acre (Forest Zone) ... 45 Figure 5. Average Labor Cost for Major Farming Activities (Forest Zone)... 46 Figure 6. Average Total Labor Hours for each Cropping Season
(Guinea Savannah) ... 47 Figure 7. Labor Requirement for Farming Activities per Acre
(Guinea Savannah) ... 47 Figure 8. Average Total Labor Cost Per Acre (Guinea Savannah) ... 48 Figure 9. Average Labor Cost for Major Activities (Guinea Savannah) ... 48 Figure 10. Average Total Labor Hours for each Cropping Season
(Transition Zone) ... 50 Figure 11. Labor Requirement for Farming Activities Per Acre
(Transition Zone) ... 50 Figure 12. Average Total Cost Per Acre (Transition Zone) ... 51 Figure 13. Average Labor Cost for Major Farming Activities (Transition Zone) .. 51 Figure 14. Average Total Labor Hours for each Cropping Season
(Coastal Savannah)... 52 Figure 15.Labor Requirement for Farming Activities per Acre
(Coastal Savannah)... 53 Figure 16. Average Total Labor Cost Per Acre (Coastal Savannah) ... 54
ix
Figure 17. Average Labor Cost for Major Farming Activities
(Coastal Savannah)... 54
Figure 18. Average Labor Cost per Hour Comparison for all Ecological Zones .... 55
Figure 19.Average Labor Cost per Hour for Major Farming Activities ... 57
Figure 20. Average Yield of Maize per Acre ... 59
Figure 21. Average Millet Yields (Guinea Savannah)... 59
Figure 22. Average Price of Maize ... 61
Figure 23. Profit per Acre (Forest Zone) ... 62
Figure 24. Profits per Acre (Guinea Savannah) ... 62
Figure 25. Profits per Acre (Coastal Savannah) ... 63
Figure 26. Profits per Acre (Transition Zone) ... 63
x
LIST OF TABLES
Page
Table 1. Grain Yield of Maize as Influence by Tillage and Mulch Treatments ... 17
Table 2. Descriptive Summary of Study Areas ... 28
Table 3. Age and Gender of Farmers ... 30
Table 4. Educational Levels of Farmers ... 31
Table 5. Average Household Size and Farm Size (Acre) ... 32
Table 6. Type of Crops Grown ... 33
Table 7. Aggregate Average Cost of Labor per Hour in each Ecological Zone ... 55
Table 8. Average Tomato Yields per Acre ... 60
1
1. INTRODUCTION AND LITERATURE REVIEW
Agriculture is the predominant sector in many Sub-Saharan African (SSA) economies and in Ghana accounted for about 22% of the Gross Domestic Product (GDP) in 2013 (Ghana Statistical Services (GSS) 2014). The sector is characterized by small-scale farmers who produce for subsistence as a means of their basic livelihood. According to Rosen and Shapouri (2012) more than 80% of grain supply in SSA is from domestic production. There was an average growth rate of 4.1% per year on grain production in the region between 2000 and 2010 yet there is still an increase in food importation since yield growth still falls short. This
presents the need to increase food production in the Sub-Saharan region, but productivity is still low due to the degradation of the physical, chemical and
biological properties of the soil. According to Conway (1998) there is a greater risk in causing land degradation through intensification of agriculture with the use of inputs, especially when incentives are lacking. Continuous intensification would eventually lead to lose of soil fertility which would impact negatively on food production and economic growth thereby increasing poverty in the Sub-Saharan Region. Agriculture in Ghana is saddled with these myriads of problems found in other SSA countries.
The decline in soil fertility and threats to food security have led to an interest in using agricultural practices that do little damage to the soil in terms of nutrient loss. No-till agriculture has emerged as an alternative to the traditional
2
slash and burn agriculture practiced in Ghana. The challenge is to gain an understanding of how risk, profitability, labor use and other critical factors of production are affected by the choice of crop production technology. “No-till or no-tillage” is described by Friedrich and Kassam (2012) as a cropping system which does not adopt the use of mechanical tillage as a means of crop
establishment in the soil. It is “the planting of crops in previously unprepared soil by opening a narrow slot, trench or band only of sufficient width and depth to obtain proper seed coverage” (Derpsch 1999).There is no performance of extra soil preparation under no-till (Phillips and Young, 1973). Crop residues of the previous cropping season are left on top of the soil.
Farmers in Ghana have to make difficult decisions regarding, what crop to produce, how to produce, where to sell, and in some cases how much to save for home consumption. Farmers face uncertainties due to policy changes that affect input and output prices, production uncertainties since agriculture is primarily rain-fed, and lack of appropriate technologies due to ineffective agriculture extension systems that have failed to deliver relevant information to farmers. Probably, the biggest knowledge gap in farming operations in Ghana is the inability to estimate profits or losses during the farming season because of lack of farming records. In the absence of reliable records, farmers are deprived of an essential management tool that would guide them in making decisions under risk. As Garcia-Parbon (2009) points out, “planning the farm business is a key aspect of the farm
3
a firm footing in farm financial management and farm records, the farm is in jeopardy; you wouldn’t know where you are going and you sure wouldn’t know when you get there!” (Hipp, 2009). Improving the basic business management skills of farmers contributes to the productivity and profitability of farming as farmers realize both the short and long run objectives of their activities. In a broad economic development context, any or all of the factors elaborated can have a multiplier effect on food security, income, nutrition and the environment.
The overall objective of this thesis is to assemble case studies of farmers in different cropping system/agro-ecological zones of Ghana to determine how the choice of farming practice influences incomes, profitability, and farm input use, especially labor. Specifically, the research will:
1. Develop a computerized decision support system that can be used in risk analysis and in simulating financial future of an agricultural production firm/business in Ghana.
2. Use the model to develop representative farm budget modules (12 no-till farms and 12 conventional farms) from 4 agro-ecological regions in Ghana. 3. Use the representative farm budgets to determine farm income levels, labor
use, alternative tillage systems; cash costs, and the profitability of alternative systems.
4. Use the representative farm budgets to determine the impacts of alternative risk scenarios such as changes in yields due to stochastic rainfall pattern,
4
policy impacts such as input, output, and energy price changes, and optimal crop mixes.
5. Recommend a roadmap for integrating the budget modules into the training programs at the No-Till Center in Ghana, and also share with extension personnel to improve farm management practices in Ghana.
Literature Review
Risk Management in Farming
Agriculture in Ghana is heavily dependent on circumstances that are unpredictable such as the weather, fluctuation in prices, diseases and pest, and also government policies. These unpredictable circumstances or factors are classified as a risk which has major repercussions on financial incomes of a farming business. According to Patrick (1992), farmers do not invest in a farming business which is risky except they have a chance of making money. “…higher profits are typically associated with higher risks. It is to their advantage that these risky but potentially profitable situations be managed as carefully as possible”. The higher risk makes decision-making the predominant activity of farm management (Kahan 2013). One way of managing risk is by predicting the difficulties likely to be faced and having the forethought of minimizing the outcome of such risk (Patrick, 1992).
Farmers may have different attitudes in dealing with risk. A risk loving farmer has the tendency to invest in more risky circumstances in the farming business whiles a risk-averse farmer would try his or her possible best to avoid risky scenarios. However, access to detailed and resourceful information is
5
essential if good risk management decisions are to be made. “Good information can help a farmer make rational risk management decisions” (Kahan 2013).
Farm Budgets
Farm budgets are risk management tools used by farmers to help assess the performance of a farm business. Farmers always face challenges on how best to organize their business in a manner that is consistent with their goals and objectives. Budgeting provides tangible information which helps answer and provide solutions to farmers’ challenging questions when they are properly used. Farmers or farm managers have the responsibility to organize resources and skills to achieve the maximum economic returns of the farm enterprise. According to the Oklahoma Cooperative Extension Factsheet1, budgets help farmers and farm managers to answer questions such as:
1. How may the available resources best be used?
2. What enterprises (crops and/or livestock) can be produced and which will contribute most to returns to owned resources?
3. How much of the controlled land should be devoted to each enterprise? 4. What equipment and machinery will be needed to produce the potential
enterprises?
5. What production practices should be used to produce each of the enterprises?
1 Oklahoma Cooperative Extention Factsheet (Web source:
http://osufacts.okstate.edu/docushare/dsweb/Get/Document-1682/AGEC-139web.pdf) (Viewed:
6
6. How much labor (both family and hired) will be needed on the farm? 7. What are the capital requirements?
Three types of budgets are commonly used in a farm business decision-making process. The whole-farm budget, enterprise budget, and the partial budget.
Thewhole-farm budget is used to project the anticipated returns of an entire farm’s production by taking into consideration the profitable goals and objectives of the farmer. It provides comprehensive abstracts of the major physical assets and financial components of the farm and how they are related to each other. In other words, it provides an aggregate of the projected total income and expenditure of the whole farm venture. In developing a whole-farm budget; farmers need to profile the entire production process by incorporating into the profile the type and volume of production, identify resources needed for production and project the expected expenditure and gains from each section of the plan. When these factors are well organized into a detailed projection, the result is a whole-farm budget (Oklahoma Cooperative Extension Factsheet).
An enterprise budget provides projections on the income and expenses per unit of the production farm enterprise. It estimates the cost and returns from producing a particular commodity. An enterprise as used in this context refers to a singles crop (such as cocoa, maize, millet, tomato, etc.) or livestock (such as cattle, sheep, goat, pigs, etc.) that produces a sellable product. It consists of basically three components:
7 2. Variable/operational expenses 3. Fixed expenses.
An Enterprise Budget can be developed for each single enterprise to estimate its profitability by taking into consideration anticipated expenses and income. It helps farmers to make decisions on which particular enterprise is more profitable for their investments and those that should be eliminated or shut down. An Enterprise budget developed for different cropping systems can provide farmers with insights regarding which system is much profitable by comparing the
profitability of the two techniques or systems. For instance no-till versus
conventional till (Oklahoma Cooperative Extension Factsheet; Harper et al. 2013). Apartial budget is a budget that projects and analyzes the net change in income or expenditure as a result of certain changes in the production process or farm management changes. It focuses mainly on the changes in returns which arise as a result of changes in production alternatives and ignores profits earned by unchanging resources or production alternatives or decisions on the farm. It helps farmers plan and make decisions based on the cost and returns of alternatives they face in running the farm business. Partial budgets help to decide how a particular decision would affect the whole farm of its profitability when instituted. In developing a partial budget the farm needs to:
1. Outline the changes on the farm which need to be analyzed
2. Gather all the necessary information on the aspect of the farming business that is supposed to be affected by the change
8
3. Categorize all the impacts that occur, such as, increase or decrease in cost or revenue.
When the change is expected to increase net returns or decrease the cost of the production process it is referred to as a positive economic effect while an increase in the cost or decrease in returns is termed as negative economic effect.
Reasons for Farm Budgeting
According to Sahs (1998) budgets, whether they are whole-farm, enterprise, or partial, are a management tool that is invaluable when evaluating the profit potential of the farming business. Although managers lack the information needed to make perfect decisions, they are forced to make decisions on the basis of information available and must accept the risk associated with those decisions. Knowledge of budgeting and the ability to use them will help them make the right decisions.
Senyolo (2011) reported that, in making a decision about a business investment or future strategic choice, farmers have to consider such questions as: what future activity gross margins is realistic to use in farm planning? Will the present subsidy scheme change in the future, and if so how? When borrowing money, will there be any changes in the interest rates over the next few years? What about the labor requirement for different activities - how many hours will be required per unit? Will there be a need to hire labor, and if so, how much? What price might be obtainable if quota could be sold in the future? Answers to these
9
questions are critically dependent on how well a farm budget reflects the actual performance of a farm enterprise.
Moschini and Hennessy (2001) emphasized the complexity in decision-making as a result of the interplay between physical and economic forces on agriculture. The author emphasizes the need to understand the nature of risk and uncertainty to gather appropriate information to understand them.
Farmers in Ghana do not have the relevant information and the technical expertise to make proper financial decisions about their farming operations. This could be attributed partly to the high illiteracy rate of farmers and the weak nature of the agricultural extension service in the country. Extension agents in Ghana lack the necessary skills and technical ability to develop financial management tools for assessing farm risk and decision-making on behalf of farmers in Ghana.
Cropping Systems in Ghana
A cropping system is defined as crops and crop sequence and management techniques used on a particular field over a period of years (Nafziger 2009). It refers to "...the crop production activity of a farm. It comprises all cropping patterns grown on the farm and their interaction with farm resources, other household
enterprises and the physical, biological, technological and sociological factors or environments" (IRRI 1978). The cropping system in Ghana has evolved from an extensive to a more intensive system over the years. According to Boserup (1965) cropping systems have historically evolved from the extensive stages of the forest, bush and short fallow to an intensive stage of continues annual cultivation. The
10
West African region is located in the tropical zone and over the years farmers adapted the long-fallow system as a way of conserving and rejuvenating soil fertility. In addition, it served as a way of adapting to special climatic conditions in the tropical region. Tropical soils were not favorable for other systems of
cultivation such as intensive cultivation. Therefore, the fallow systems were seen as the most convenient method. The fallow system was easy to implement and adapt then because settlements were scattered and there was less concentration of people dwelling in specific areas at a time. This made it easy for extensive cultivation with fallow. Gourou (1974) published in his book The Tropical Word that “most of the tropics is sparsely populated because the land is unable to support cultivation for more than one year out of twenty and, therefore, unable to support a numerous population” however the “number of people in the tropics has grown to what the territory can carry, and that additional population must largely be accommodated by means of industrialization and reliance on foreign trade.”
The increase in population, demand for food and the high demand of land for other alternative purposes have led to the transition from an extensive cropping system to a more intensive cultivation. Fallow has gradually been eliminated and slashing and burning is not currently a sustainable method of crop production as it was before. Manure is currently not sufficient in quality and quantity to sustain soil fertility due to continues cropping on small land areas. 60 persons per square kilometers was the sustainable population density level for bush fallow in Ghana, but the fallow period kept decreasing with subsequent increase in the country’s
11
population which tend to cause harm to the soil (Boateng 1962). According to Guyslain et al. (2011) there is a positive correlation between the density of the population and farm intensification in Ghana.
Though bush fallowing and shifting cultivation are rarely practiced today, the old farming system (traditional system) has not changed. Farmers still practice slash and burn method of farming and in the absence of fallowing and this causes major damage to the soil’s physical and chemical properties through erosion and degradation. The outcome is a general reduction in the nutrients in the soil and its inability to sustain plant growth. Modern day agriculture in the tropics needs new soil management practices that can help adopt sustainable intensification in crop production. The conventional system of farming is not a practical answer to the growing food problem if environmental and social resources have to bear the cost of the system. A group of government policy leaders, agricultural experts and development partners produced what is known as the Montpellier Panel Report (2013), recommended that Governments in the developed countries and in Africa – in partnerships with the private sector, Civil Society Organizations and
Non-Governmental Organizations (NGOs) – recognize and act on the paradigm of sustainable intensification through, 1. Adoption of policies and plans that combine intensification with sustainable solutions and a focus on the food security needs of people, 2. Increased financial support for global and domestic research and
innovation to develop and identify suitable technologies and processes, 3. Scaling up and out of appropriate and effective technologies and processes, 4. Increased
12
investment in rural agricultural market systems and linkages that support the spread and demand for Sustainable Intensification, 5. Greater emphasis on ensuring that inputs and credit are accessible and that rights to land and water are secure for African smallholder farmers and 6. Building on and sharing the expertise of African smallholder farmers in the practice of Sustainable Intensification.
The Montpellier Panel recommendations suggest that addressing the food security problems facing SSA’s would require a broader framework for instituting sustainable conservation agricultural practices as well as proper farm management techniques to generate income and profits. There is a need for proper agricultural extension training to help educate farmers on how best to adopt the new paradigm. What is No-till?
There is confusion in defining some agricultural terms such as no-tillage (Fredrich and Kassam 2012). Generally, any farming system that reduces the magnitude of extreme tillage (that is, completely turning upside down the soil with a plow) is categories as a “reduced or minimum tillage” practice. With minimum tillage, there is little disturbance to the soil whereas the soil is not to be disturbed under pure no-till as claimed by hardcore no-tillers. However, both techniques are classified under conservation tillage which The United States Department of Agriculture (USDA) defines as any method of farming that leaves at least 30% of the soil surface covered with the previous year’s crop residue before planting. No-till thus fits under the broader definition of conservation agriculture as defined by USDA.
13 Why the Need for No-till
A major problem facing agriculture in the tropics is the steady decline in soil fertility, which is closely correlated with the duration of soil use (Derpsch and Moriya 1998). In order to maintain and improve soil fertility and achieve a
sustainable agriculture in the tropics and subtropics, it is necessary to stop mechanical soil preparation and keep a permanent cover of the soil (Derpsch, Florentín and Moriya 2006) as soil erosion and loss of organic matter are associated with conventional tillage practices that leave the soil bare and unprotected in times of heavy rainfall and heat (Derpsch and Moriya 1998).The sustainability of agriculture in the tropics cannot be achieved with intensive
mechanical soil preparation. There is always the need to take into consideration the law of diminishing productivity of the soil in relation to agricultural production because to disrespect these laws is to promote soil degradation and loss of soil fertility. Sustainable agriculture cannot be achieved if the law of diminishing productivity of the soil is neglected (Derpsch et al. 2010). This according to Derpsch, Florentín, and Moriya (2006) makes no-till with manure cover instituted in a crop rotational system an authentic sustainable production system in most forms of tropical and subtropical agriculture.
Economics of No-till Labor Use:
Labor saving is considered to be one of the most important advantages of no-till. The total amount of time used in preparing the field by tillage is reduced
14
when substituted with no-till2. A survey conducted by USDA which compared the time used for soybean and maize crops report a range of 0.4 hours to 0.6 hours per acre spent in conventional tillage systems with only 0.1 to 0.3 per acre in no-till (Bull and Sandretto, 1995).
A study conducted at the University of Missouri estimated labor cost to decrease by $2.09 per acre with no-till use than conventional tillage under corn production (Massey, 1997). However, the reduction in the cost of labor is realized when labor is hired on an hourly basis, therefore workers work fewer hours and are able to do other activities that provide income since they are using no-till. In the context of the farmer, the time saving is the result of using that time for other profitable activities or using the supplementary labor to execute other activities on the farm such as increasing farm size, finding a market for produce or purchasing inputs and implements for the farm.
According to Ekboir et al. (2002) farm lands are cleared at the beginning of every cropping season with simple tools such as cutlasses and hoes in Ghana. The land preparation activity demands a considerable amount of labor hours and effort. However, the amount of labor needed for this operation depends on whether the land to be cultivated was left to fallow or is already under cultivation. Less labor is required when preparing a field already in cultivation since it has just grasses and simple broadleaf weeds as compared to a land left to fallow. Under the traditional
2 No-Till and Conservation Buffers in the Midwest, (Web Source:
15
system, a fallowed land can sustain efficient crop production for about three years after which it has to be left to fallow and new land needs to be cleared. No-till saves the extra labor needed in clearing a new fallowed land as soil nutrients are maintained and conserved under no-till and the same field can be planted over an unspecified period of time. Nevertheless, fertilizer use should be a complement of the intensification system under no-till in order to compensate for the increase proportionate take out of soil nutrients.
A study conducted by the University of Arkansas on the benefits of no-till in a rice-soybean rotation (Hignight et al. 2009) also found no-till reduces the cost of labor. Specifically, the study reported the estimated cost of labor of an acre no-till rice and soybean as US$ 12.26 and US$ 6.45 respectively whereas the cost of labor for an acre rice and soybean was estimated at US$ 17.29 and US$ 11.60 under conventional tillage.
Although most no-till literature regards the technology to be labor saving there are instances where this savings is offset by an increase in the use of herbicide and their cost of application. According to (Vogel, 1994, Vogel, 1995 and Kayode and Ademiluyi, 2004) the soil is not tilled under no-till, and with no soil till there is an increase in the pressure of weeds. Weeding, therefore, would require a high amount of labor and this counterbalance the labor savings gained by not plowing unless weedicides are applied. Continues maize cultivation in North America led to the emergence of perennial weeds although weedicides were applied in reduced tillage practices (Locke et al., 2002). The basic method of weeding with cutlasses
16
and hoes are not the best control measure to combat perennial weeds that emerge due to reduced tillage practices if herbicides are not used (Vogel 1995). However the cost expenditure in herbicide use and the ineffective chain of supply in regions such as SSA makes implementing a productive technology like no-till quite
problematic although it has the tendency to increase the productivity of smallholder farmers (Giller et al., 2009).
Crop Yield:
Toliver (2010) has explained that different crops and different soil types respond to no-till in several different ways when crop yields are put into
consideration. Silty soils reduce crop productivity when no-till is practiced. Though there are several instances where no-till does not contribute to increased yield or might even lead to yield reduction, no-till and conservational agriculture advocates assert that it is better yielding and has the tendency of stabilizing crop yields (African Conservation Tillage Network, 2008).
Research conducted by (Gill and Aulakn 1990) reported the importance of crop residue to wheat yield. In conclusion, no-till with mulch (crop residue) was found to increase wheat yield in Zambia whereas the absence of crop residue led to a lower yield. The mean yield of no-till after the 3-year experiment was 1688 kg ha -1 whiles conventional yielded 1285 kg ha-1. The only importance specified for tilling is to help control weeds.
According to Mbagwu (1990) water transmissivity was decreased by 79% for a tilled unmulched field whiles that of a no-till field was decreased by just 22%.
17
Likewise, maize yields were observed to be higher on untilled-mulched fields than tilled-unmulched fields within each season (Table 1).
Table 1. Grain Yield of Maize as Influence by Tillage and Mulch Treatments
Treatments 1982 1983 1984
1st season 2nd season 1st season 2nd season 1st season 2nd season
UM 5.06 3.75 5.71 4.46 5.42 4.27
TU 4.72 2.59 4.30 2.37 4.53 2.29
Note: UM = untilled-mulched; TU = tilled-mulched Source: Mbagwu (1990)
Again Lal (1991) reported in his paper “Tillage and agricultural
sustainability” which focused on two studies for a period of 8 years and concluded with the findings that maize yields under no-till with mulch were higher than plough-based systems. There are other instances where no-till may lead to less yield. In southwestern Nigeria, the yield of cowpea was higher with ridge tillage than no-tillage (Akinyemi et al., 2003). Also in the highlands of Ethiopia, farmers prefer traditional till because it enhances filtration, decreases run-off and reduces evaporation (Temesgen et al., 2008). Nicou et al. (1993) have argued that in the semi-arid regions of West Africa, soil tillage is an excellent technique of improving soil physical properties and crop yield in the early years of crop production.
The literature part to variations between the long run yield outcomes and the short-run yield outcomes under no-till. In the short run, crop yield under no-till is found to be inconsistent. According to (Giller et al., 2009) the introduction of no-till has a long run effect on crop yield but in the short run there are possibilities
18
of reduced yield or no benefits in yield which can be up to 10years. Thus, there are suggestions for further studies to research and identify the observed yield decrease with no-till in the short run and how it could be solved.
Profitability of No-till versus Conventional Tillage:
According to (Ribera et al., 2004) it is easier to identify the agronomic benefits of no-till agriculture than its economic benefits. No-till is proven to be labor saving, cost efficient in fuel use, machinery repairs, and depreciation, but there are instances where herbicide use offsets the benefits. Several studies have been conducted to compare the net income of no-till and conventional tillage and the results have been conflicting. In the studies by (Harman et al., 1996 and Haack and Haskins 1999) which were conducted on sorghum-corn-wheat rotation in Blackland Prairie, Texas and on winter wheat and corn in Ontario, Canada respectively, no-till had lower yields than conventional but the variable cost of production for no-till was highly significant in some cases.
Bremer et al., (2001) found no-till to be more profitable than traditional tillage based on a study on cotton and sorghum conducted in Refugio County, Texas. This is similar to (Ekboir et al. 2002) in which 87% of the participating farmers reported higher income with no-till adoption in three different ecological zones of Ghana.
The common threat in the studies discussed above is that they only compare the average net incomes realized from no-till and conventional tillage whiles omitting the profit which is economically the most important factor as it has an
19
effect on the risk of the farm enterprise. “The effect of alternative production systems on mean net income and variation in net income need to be considered when comparing production systems” (Ribera et al., 2004).
Role of the Extension System
Agriculture extension was introduced “to enlarge and improve the abilities of farm people to adopt more appropriate and often new practices and to adjust to changing conditions and societal needs” (Jones and Garforth 1997). Traditional agricultural extension helps farmers through education for better agricultural systems and procedures, expanding the efficiency of output and income, adopting a more sustainable farming system, raising living standards in both social and
educational aspects of rural life’s (FAO 1984; Rasmussen 1989). In Ghana, the Directorate of Agricultural Extension Services (DAES) is responsible for managing and educating farmers on various agricultural practices and technologies. The primary objective of the service is to “establish an efficient and demand-driven extension service in a decentralized system through a partnership between the government and the private sector for the provision of quality service to our clients” (MOFA 2015)3. The extension service follows the decentralization policy of the government so that all regions and districts in Ghana have access to
agricultural management information. Direct collaboration at the regional and district levels of administration are established to ensure that extension services contribute efficiently and effectively towards the social and economic development
20
of the country. The idea is for the service to contribute to the improvement of general farmer welfare and to strengthen their ability to adopt innovative ideas and to improve performance.
21
2. STUDY AREA, SURVEY, AND DESCRIPTIVE STATISTICS
Study Area
Figure 1. Agro-ecological Map of Ghana
Source: Germer and Saureborn (2008)
The study was conducted in the four major agro-ecological zones of Ghana (Figure 1). Ghana is located along the coast of West Africa and shares boundaries with Burkina Faso in the north, Cote d’Ivoire in the west, Togo in the east and the Gulf of Guinea and Atlantic Ocean in the south. The recent population and housing
22
census in 2010 estimated the population of Ghana to be 24.7 million with an annual growth rate of 2.4 percent (Ghana Statistical Service (GSS) 2012)
Agriculture in Ghana is dominated by small-scale farmers. Although there are larger rubber, oil palm, cocoa and maize plantations, about 90% of farm sizes are less than 5acres (GMOFA 2010). The traditional system of farming still dominates with the use of simple farm implements such as hoes and cutlasses.
The estimated total land area of the country is 23 million hectares of which 57 percent of the area is under cultivation (GMOFA 2010). Ghana is a
constitutional democracy and is divided into ten administrative regions.
Ecologically, the country can broadly be divided into four ecological zones namely: The Forest Zone (Rain Forest and Deciduous Forest), Transition Zone, Coastal Savannah zone and The Northern Savannah (Guinea and Sudan Savannah) as shown in figure 1 (GMOFA 2010). The Northern Savannah vegetation occupies the three Northern Regions of the country with the coast characterized by the Coastal savannah vegetation. In the middle lies the Forest Vegetation with the Transition Zone lying between the Forest and Guinea Savannah Zones.
Four districts were selected; one from each ecological zone where the case studies were undertaken. The districts were Atwima Nwabiagya in the Forest Zone, Ejura Sekyedumasi in the Transition Zone, Ga West District in the Coastal
Savannah Zone and East Manprusi in the Guinea Savannah Zone. Details about the districts were taken based on information from GhanaDistricts.com.
23 Atwima Nwabiagya (Forest Zone)
Atwima Nwabiagya District is located in the Ashanti Region of Ghana and has Nkawie as its capital. The semi-deciduous forest kind of vegetation is the most dominant in this area. Rainfall distribution in the district is bimodal with double maximum rainfall ranging between 1700mm-1850mm. There are two cropping seasons, namely the major season (mid-March – July) and the minor season
(September – November). Rainfall is not distributed throughout the whole year and this makes rain-fed agriculture unreliable in the district.
The total population of the district is 149,025 with 77,077 (51.7%) being female and 71,948 male (48.3%) (GSS, Population and Housing Census2010). The total number of people employed in the district is 56,553. According to the 2010 census figures, about 31.5% of the total population lives in the rural area. The district is a few miles from Kumasi, which is the capital of the Ashanti Region and is a major avenue for marketing agricultural produce such as fruits and vegetables. However, the proximity of the district to the Kumasi Metropolis puts pressure on agricultural lands as they are being converted to the housing to accommodate an expanding population and urbanization. The loss of agricultural lands leads mostly to unemployment of unskilled labor since most of the unskilled labor force is into agriculture. Again, the prevalence of illegal gold mining “galamsey” in the area creates a labor constraint for agriculture. Most of the eligible youth find these mining activities generally attractive since they earn more income than working on a farm.
24 Ejura Sekyedumasi (Transition Zone)
Ejura-Sekyedumasi is a municipal assembly located in the Ashanti Region of Ghana. The district lies between the Forest and Guinea Savannah zone which implies experiencing the climatic conditions of both ecologies. It has a semi-deciduous forest in the south and savannah vegetation in the north. There are two rainfall patterns in the district owing to its location. It experiences a bi-modal rainfall pattern in the south and a uni-modal in the north. The rainy season for the area is between April and November with April to August as the major season and August to November as the minor. Annual rainfall in the district ranges between 1,200mm to 1,500mm. Likewise, rainfall is unreliable for crop production.
The total population of the district is 85,446 with 50.2% as male and 49.8% as female (Ghana Statistical Service, Population and Housing Census 2010). Out of the total population, 50.3% live in urban centers whiles 49.7% are in rural
communities. There has been a gradual transition of the district from a rural to an urban community since the year 2000. The total population of the labor force in the district is 34,389 (Ghana Statistical Service, Population and Housing Census 2010). The structure of the district’s economy is dominated by the primary sector. This makes the economy agrarian and it absorbs about 68.2% of the labor force in the district. Farmers in the district practice both mono-cropping and mix cropping. Most crops are grown for subsistence use with the surplus offered for sale. Maize is the most dominant crop cultivated in the area. About 68.2% of the farmers in the district have access to extension service.
25
The district is a major marketing center for food crops especially for maize and yams and it provides a source of ready market for the farmers. About 62.4% of the farmers in the district have a ready market for their produce.
Ga West District (Coastal Savannah)
Ga West Municipal was created in 2004 with Amasaman as the capital. The coastal savannah vegetation is the type of vegetation found in this area and it is characterized by clusters of shrubs and small trees. The rainfall pattern in this area is bi-modal with the average annual rainfall ranging between 750mm-810mm.
The total population of the district is 262,742 (Ghana Statistical Service, Population and Housing Census 2010). Male and female represent 49% and 51% of the total population of the district respectively. 114,478 represent the number of people between the ages of 15 and 64 who constitute the labor force of the district. The municipality is predominantly urban. About 69% of its inhabitants live in urban centers. Agriculture, industry and commerce represent the major economic activities in the district with agriculture absorbing about 55% of the total working population who are into farming, fishing and livestock development. Most of the farms in the district are small scale with a few large scale farms. Fruits and vegetables are the most common crops grown in this area coupled with some root and tuber crops. Crops like a pineapple, pawpaw, chili paper and other vegetables are produced commercially whiles cassava is one of the common root crops grown in this area.
26
Access to land for farming is limited due to the high demand for land for estate development, sand winning, and quarrying. This is one of the factors that caused farm sizes to be very small in this area. These lands are being over-exploited and they lack proper soil improvement practices.
Although there is a huge market for farm produce and foodstuffs, farmers still do not get appreciable prices for their produce since they lack information from the market and are mostly exploited by middlemen and women. The farmers find it difficult to enter the market because of the market power the middle men and women already have presented in the market.
East Mamprusi (Guinea Savannah)
The East Mamprusi District is located in the north-eastern part of the Northern Region of Ghana. The district shares borders with Talensi-Nabdam, Bawku West and Garu-Tempane District in the north, Bunkpurugu-Yunyoo District in the east, boarded in the west by West Mamprusi and Gusheigu District in the south. The capital of the district is Gambaga. East Mamprusi occupies a total land area of 1660 sq. km and is about 2.2% the total area of the Northern Region. The size of the land is environmentally conducive for animal rearing and farming. The district lies in the interior woodland savannah vegetation zone and is characterized by grasses growing in tussocks which are mainly three or more meters tall with drought resistant trees such as Shea nut, Baobab and Acacia cluttered around. The district experiences just a single rainfall season which last between April to
27
the other districts in the three northern regions, is drier than its southern
counterparts. This is due to the Harmattan winds that blow from the Sahara during the dry season (November to April).
The district has a total population of 121,009 out of which 49.1% are male and 50.9% are female (GSS, Population and Housing Census 2010). The total labor force of the economically active population is 45,889 which represent about 37.9% of the total population. The district is mainly rural. About 67.6% of the total
population of the district lives in the rural communities.
The major occupation of the adults in the district is agriculture. The
agricultural sector employs about 90% of the total labor force in the district. Farms in the district are small in scale and production is mainly on a subsistence basis and is labor intensive. Lands in this district are mainly family owned and is inherited from generation to generation. Crops commonly grown in the district include cereals such as maize, millet, rice, sorghum; legumes such as cowpea, groundnut, soya bean; root and tuber crops like yam, cassava, potatoes; vegetables like tomatoes, pepper, onions; and export crops like cotton and cashew.
28
Table 2. Descriptive Summary of Study Areas
DISTRICTS Total Populati on
% < 15
years %16-64 years % years > 65 % Agric Labor Force
Forest 149025 43.2 50.65 6.2 60373 Transition 85448 40 53 7 35313 Coastal Savannah. 262742 34.8 62.2 3 55 122402 Northern Savannah 121009 54 47 4.5 90 45889
Source: Ghana Statistical Service, Population and Housing Census 2010.
Survey
The data for the study was categorized into two sections. Firstly, an
economic-anthropological survey following the work of Polly Hill (1963), Migrant Cocoa Farmers of Southern Ghana was undertaken. This was a face-to-face
interview of farmers. The objective was to gain insights into farmers’ daily lives and vision of the future for agriculture in the region of study. The interview was structured in a way to make farmers narrate a story about their life from infancy to present and their reasons for farming. It also explores farmers’ reasons for adopting the farming methods they currently are using and why they are not using the
alternative method. The survey explored the farmers’ views on the current
generation following their footsteps and becoming farmers as well. The structure of the interview is presented in appendix A. This effort was to address the
sustainability of the effort devoted to the training and education of farmers in the study area. We obtained very valuable information about farmers’ expectations and visions of the future. The information is valuable in assessing the recruitment of
29
the youth into agriculture and the nature of policy interventions needed to accomplish this objective. The results of this survey are presented in the first section of chapter four.
The second set of data used in the study consist of a daily record of all farm activities was collected from September 2012 to September 2014 by local extension agents visiting farmers each week within the data collection period to collect data on their daily activities for the week. Data collectors were professional field agricultural officers who are employees of the Ministry of Food and Agriculture in the survey areas. The records included hours of labor use for each crop operation, type of farm operation performed, the number of people undertaking the operation and the cost associated with them. This information was used to develop farm budgets to examine labor use in alternative tillage systems, cash costs of alternative systems and the profitability of alternative systems. Activities such as land
preparation, planting, weed control and harvesting were compared between no-till and conventional in and across various ecological zones.
Descriptive Statistics
Data on 24 farmers was collected over approximately two years. 12 of the 24 farmers selected at random used the no-till farming technology and the other 12 farmers used the conventional technology. Each district under the study had 6 farmers of which 3 were no-till farmers and the other 3 were conventional farmers. Out of the 24 farmers, 2 were female and 22 were males. The gender of farmers in the survey is consistent with the distribution of farm ownership by gender in Ghana
30
(FAO 2012) which reported that men hold 3.2 times more of the total farms than women, and 8.1 times more of the medium and large-sized farms (of 5 acres or more). All the female farmers practiced the conventional system. 8 male farmers practiced conventional and 12 male farmers practiced no-till agriculture (Table 3).
Table 3. Age and Gender of Farmers
Atwima
Nwabiagya Ga West Sekyedumasi Ejura- East Mamprusi
C N C N C N C N
1 40 (F) 45 (M) 51 (M) 47 (M) 64 (M) 53 (M) 52 (M) 28 (M) 2 40 (M) 43 (M) 52 (M) 57 (M) 47 (F) 48 (M) 58 (M) 60 (M) 3 45 (M) 51 (M) 42 (M) 45 (M) 54 (M) 50 (M) 40 (M) 42 (M)
Average 44 49 53 47
Average of all 24 farmers: 48
Note: C=Conventional, F=Female, M=Male, N=No-till.
The average age of the 24 farmers in the case study was 48 years with the
minimum age of 28 years and the maximum of 64 years. Ejura-Sekyeduramsi was the district with the oldest farmers on average of 53-year whiles Atwima
Nwabiagya had the youngest farmers with an average of 44 years (Table 3). The immediate implication of the observed age structure is the sustainability of no-till in the future. This is consistent with the observation in the Ghana Country report which states that; agriculture in Ghana is threatened since it is dominated by the aged (MIPAA 2007). Five out of the 24 farmers had no education; however, 8 had a basic primary education with just one farmer having a university degree. 79 percent of the farmers have had a basic primary education (Table 4). Currently, a
31
large number of the youth in Ghana are pursuing higher education. The educational trend is positive to encourage the youth to engage in agriculture so long as policies and programs are introduced to emphasize the “agribusiness” opportunity available to individuals who wish to bring modern management skills to the sector. Yet the age structure of the farmers in the survey shows that the youth is not interested in farming. The youth of Ghana is less interested in farming as their main occupation since they recognize it as a low income generating job and a job for the rural poor and uneducated (MOFA 2011).
Table 4. Educational Levels of Farmers
Educational level No. of
Farmers No. of years in
school
No education 5 0
Primary level 8 6
Junior Secondary level 5 9
Senior Secondary level 5 12
University/Tertiary level 1 16
Total 24
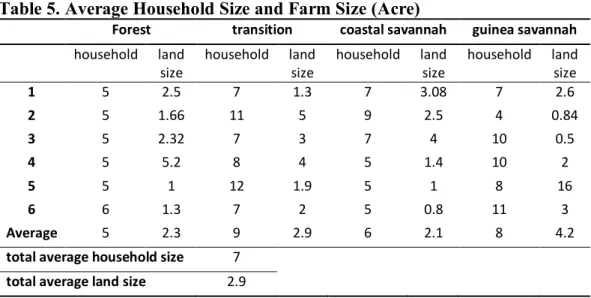
The average size of farms in the survey was 2.9 acres. The farms in the guinea savannah zone were larger with an average land size of 4.2 acres whiles the farms in the coastal savannah zone were the smallest with an average of 2.1 acres (Table 5). The larger land size in the north can be attributed to the availability and less scarcity of land in the three northern regions of Ghana for farming purposes as
32
compared to the scarcity of land resource in the coastal and forest areas which are predominantly peri-urban. Land can be put to alternative uses such as estate
construction and for sand winning at the expense of farming. Household sizes were larger on average in the transition and guinea savannah area 9 and 10 respectively than the forest and coastal regions 5 and 6 respectively. There was a positive relationship between average farm sizes and average household sizes. Larger average farm sizes in the transition and guinea savannah corresponded to the larger average household sizes in those areas (Table 5).
Table 5. Average Household Size and Farm Size (Acre)
Forest transition coastal savannah guinea savannah
household land size household land size household land size household land size 1 5 2.5 7 1.3 7 3.08 7 2.6 2 5 1.66 11 5 9 2.5 4 0.84 3 5 2.32 7 3 7 4 10 0.5 4 5 5.2 8 4 5 1.4 10 2 5 5 1 12 1.9 5 1 8 16 6 6 1.3 7 2 5 0.8 11 3 Average 5 2.3 9 2.9 6 2.1 8 4.2
total average household size 7
total average land size 2.9
The survey shows that farmers grow a variety of crops such as maize, cowpea, millet, groundnut, plantain and also vegetables (tomato, pepper, cabbage). However, maize is the most widely cultivated crop. All the 24 farmers cultivated maize at least for a season within the two-year study period. Mixed cropping of
33
cereal crops, legumes, root and tuber crops, and vegetables was common in all study areas except the farmers in the transition zone who practiced mono-cropping with maize (Table 6). The variety of crops is positive for the future of no-till farming since it opens the door to exploiting a growing urban market, and the possibility of supplying to institutional buyers, including restaurants, schools, hospitals, and exporters.
Table 6. Type of Crops Grown
Atwima Nwabiagya. Ga West
Ejura-Sekyedumasi
East Mamprusi Crops
grown
C N C N C N C N
1 M,C,P M,C,Pe,C M,Pe M,C,Pe M M M,Mi,Co M,Mi
2 M,C,P,Co,G M M,T,Pe M,C M M M,Mi,Gn M,T,Co
3 M,T,Pe,Ca M,C,Co M,C M,C,S M M M,Mi,Gn M,Mi,Se, Note: M=Maize; C=Cassava; Ca=Cabbage; P=Plantain; Co=Cowpea; G=Ginger, T=Tomato; Pe=Pepper; Mi=Millet; Gn=Groundnut; Se=Sesame.
Equipment use is rare in the area of study. All the farmers in the survey use simple farm implements such as hoe, cutlass, garden lines and the knapsack
sprayer. With the exception of conventional farmers in the forest area who only burn their land in the land preparation process, all the other conventional farmers in the other three zones plow or till their land with a tractor pulled plow or bullocks. Only one farmer in the coastal savannah area had an irrigation system.
Labor is seen as the most important factor of production in the survey. It comprised of family labor and hired labor. Mostly, labor was hired for activities
34
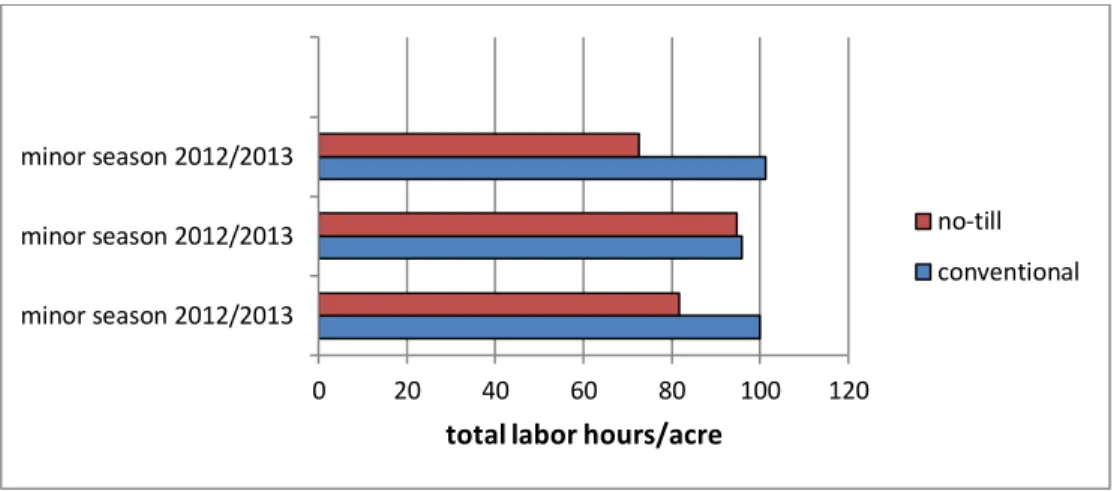
such as planting, weeding, fertilizer application, and harvesting. These activities were seen to be more tedious for farmers whose family labor source comprised of their wife and kids. Therefore, labor was hired and paid a daily rate which is known as “by day” or sometimes contracted to perform specific activities on the farm for a fee charged mostly on an acre basis. The daily rate paid to laborers varied between activities and also across ecological zones. There was not much uniformity in the rates of payment even within the same ecological zone. Within the same cropping season, different laborers are paid different rates for the same activity (appendix B). However, it could be observed from the Atwima Nwabiagya district that the daily wage rate for activities such as weeding, planting and harvesting increased from the 2012/2013 minor seasonal rate of GHc7 to GHc8 and GHc10 for the 2013 major season and 2013/2014 minor season respectively. However, contracted charges were based on the bargaining power of laborers and farmers as rates differed significantly from one activity to the other.
35
3. METHODOLOGY
Labor and cost information from the daily dataset was used to develop 72 enterprise budgets models. Three budgets were developed for each farmer for the minor season of 2012/2013, major season of 2013 and minor season of 2013/2014 with the exception of farmers in the guinea savannah region where one budget was built each year for 2012, 2013 and 2014 cropping seasons due to the single
cropping season in the northern part of the country. Secondly, a general budget model was developed using Simetar tools to estimate the future cost and revenue of a crop farm enterprise. This budget tool is to help analyze risk and estimate
financial characteristics of a farm enterprise.
Method for Building the 72 Crop Budgets
The information collected from the daily data was categorized into the major labor activities performed on the farm field on a daily basis. The activities included weeding, planting, spraying, harvesting, post-harvest, plowing, nursery bed preparation, burning and fire belt maintenance as well as other minor activities that were performed individually by farmers or activities that were area specific. This was the information that was used in calculating the labor cost of all activities.
Labor cost and wages paid for labor activities were not charged on an hourly base. Wages are paid on labor activities on a daily basis, not on the number of hours worked. A fixed among of money is charged by a laborer performing a particular labor activity. This form of payment for labor is referred to as “by day”.
36
In this study, the main focus was to determine the average cost of labor per hour. This was essential because it was used to compare the cost of performing each activity and which zones had the least or highest cost of labor. To be able to analyze and compare the cost advantages and disadvantages of implementing machinery use in agriculture, labor cost had to be on an hourly basis since the equipment is measured as cost per machine hours. The formula for calculating the average cost of labor per hour was:
(1) Average Cost/hour = No. of hours x Cost/worker No. of hours worked
Input cost was calculated by adding the cost of all farm inputs used within a particular cropping season that was reported in the daily data. Inputs such as
weedicide, insecticide, fertilizers and manure were the most commonly reported input being used across all ecological zones. Input cost was added to the total cost of labor to derive the total variable cost of production.
(2) Total Variable Cost of Production (TVCP) = Labor Cost + Input Cost Total revenue (TR) was calculated by summing up all the sales of farm products within a particular cropping season. Profits were then calculated by subtracting the TVCP from the TR.
(3) Profit (P) = Total Revenue (TR) – Total Variable Cost of Production (TVCP)
72 farm budgets were built using actual data gathered from the farmer’s field (Appendix B), but for uniformity in the analysis all cost, profits, and revenue were calculated on per acre basis. This was to facilitate comparison between
37
different practices and to determine which ecological zone is well suited for a particular farming system.
Scenarios such as the effect of fertilizer subsidy removal and the effect of fuel price changes on the cost and profit of a farm enterprise were analyzed with selected farm budgets. This was to illustrate how farm budgets could help evaluate the effects of the risk events on the profitability of a farm enterprise. Farmers could, however, predict their cost and returns in advance based on the current situation of the economy or the agricultural sector.
Financial Futures Budget Building
A general budget was built to forecast the financial future of farm business using the spreadsheet Add-in simulation package built into Microsoft Excel known as Simetar (Appendix E). Simetar with its risk analysis tool is known to efficiently develop statistical risk solutions. An Economic analysis based on deterministic variables do not take into consideration risk and only report point estimates of key output variables (KOV’s) instead of determining the probability distributions that discloses the chances of failure and success (Hardaker et al., 2004). With
deterministic variables, decisions are only made based on strategies that are most suitable in risk-free scenarios. However, in making a decision in a risky
environment such as making a decision on the farm, a single rule of calculating a non-random deterministic value is not feasible since economic return for each alternative is a distribution of returns rather than a single value. According to
38
(Pouliquen 1970) Monte Carlo Simulation4 gives managers and economists random values of important KOV’s and their possible chances weighted for both favorable and unfavorable results.Simetar allows the researcher simulate different risky alternatives to estimate their distributions so as to make important economic decisions based on the simulated results.
In building this budget, the average number of hours and the average cost per hour for performing different activities and the input cost were estimated using the uniform distribution function. Uniform distribution is also a closed distribution with two parameters (minimum and maximum) of variable X and every equal length interval of the variable X over the minimum and maximum range has an equal probability of being observed and the domain include all real numbers (Richardson 2005). The uniform distribution was used because the distribution of the variables was unknown.
(4) UNIFORM = (Max, Min)
The expected value for labor hours and cost of the various labor activities from the uniform distribution were used to estimate the average labor cost that can be realized. In addition, average expected value for the quantity of inputs needed and the cost of these inputs were also used in calculating the average input cost. The uniform distribution was also used to estimate the expected yield value based on the minimum and maximum yield values that are likely to be obtained and the
4 Monte Carlo simulation is a type of simulation that relies on repeated random sampling and
statistical analysis to compute the results. This method of simulation is very closely related to random experiments, experiments for which the specific result is not known in advance.
39
expected price for selling a unit of the product and this was used to estimate the expected revenue from product sales. Profit is then calculated by addition the expected labor cost and the expected cost of input and subtracting the expected total cost of production from the expected total revenue figure.
One major reason why the uniform distribution is favorable in estimating the expected values is because farmers in Ghana can only predict the range of what the price of farm produce, the yield of farm produce and cost of particular labor activities would be. This budget would give farmers an overview of what the economic returns on their farm enterprise would likely be and would help them adjust and make good decisions.
40
4. RESULTS AND DISCUSSION
The first section of this chapter presents the finding from the
anthropological survey conducted in the December of 2013. The second section analyzes the no-till and conventional budgets and compares the labor usage, cost and profitability of both systems in the various ecological regions of the study.
Anthropological Survey Report
With the exception of one farmer in the Ga West district who had a university education and a professional career in dairy farming, 5 of the farmers had no education and 18 farmers had some form of education but dropped out of school at an early stage. Farmers reported that they got into farming mainly because there was no financial support to help them continue their education and their inability to find alternative jobs that required less technical skills and knowledge led them to become farmers.
The conventional farming practice was the farming system adopted by farmers at the initial stage of their farming careers. Farmers generally learned the practice from parents and close relatives who already used the practice since it was handed over from generation to generation. However, currently some of the farmers have converted to the use of the no-till system. When asked how no-till farmers got to know of the no-till technology, farmers claimed they got to know and learn the technology from the agricultural extension agents in their respective areas. Extension agencies organized field days and established demonstration field to
41
teach farmers the system. This was a way of helping farmers to experience and appreciate no-till agriculture which is more environmentally friendly and sustainable.
Farmers who still used the conventional system knew of the no-till system and its scientific advantages. Others had practiced no-till before but stopped using it whiles others were willing to adopt the system the following cropping season. The majority of the conventional farmers reported that although they know of the soil and environmental improvement qualities of no-till, the system is not easy to adopt. Farmers claimed it was difficult to adopt no-till in areas and on fields which are weedier. Again, they concluded that crop residue left on top of the soil to serve as mulch serves as habitats for particular insect species which cause harm to germinating plants. This they said reduced crop population. Lastly, in the guinea savannah zone a farmer who tilled the soil claimed that the soils in the area were compact and for better aeration and water absorption the land needed to be tilled.
Farmers preferred their children going to school to acquire skills and
knowledge that would help them obtain professional and skilled jobs in government or private business than becoming a farmer. Farmers in the north preferred children going to school and having mini-farms as part-time jobs since they felt that could provide them with a double income. Farmers consider education and professional career jobs to be better-paying since it provides higher income and a better living standard as opposed to farming which highly depends on manual labor.