Working Paper 106
Active Ghosts:
Nil-filing in Rwanda
Giulia Mascagni, Fabrizio Santoro, Denis Mukama, John Karangwa
and Napthal Hakizimana
May 2020
IDS_Master Logo
ICTD Working Paper 106
Active Ghosts: Nil-filing in Rwanda
Giulia Mascagni, Fabrizio Santoro, Denis Mukama, John
Karangwa and Napthal Hakizimana
Active Ghosts: Nil-filing in Rwanda
Giulia Mascagni, Fabrizio Santoro, Denis Mukama, John Karangwa and Napthal Hakizimana
ICTD Working Paper 106
First published by the Institute of Development Studies in May 2020 © Institute of Development Studies 2020
ISBN: 978-1-78118-642-8
This is an Open Access paper distributed under the terms of the Creative Commons Attribution Non Commercial 4.0 International license, which permits downloading and sharing provided the original authors and source are credited – but the work is not used for commercial purposes. http://creativecommons.org/licenses/by-nc/4.0/legalcode
Available from:
The International Centre for Tax and Development at the Institute of Development Studies, Brighton BN1 9RE, UK Tel: +44 (0) 1273 606261
Email: info@ictd.ac Web: www.ictd.ac/publication
IDS is a charitable company limited by guarantee and registered in England Charity Registration Number 306371
Active Ghosts: Nil-filing in Rwanda
Giulia Mascagni, Fabrizio Santoro, Denis Mukama, John Karangwa and Napthal
Hakizimana
Summary
Nil-filing refers to taxpayers who report zero on all fields of their tax declaration. It is a largely ignored phenomenon in the tax literature, despite being well known to tax administrators. There is almost no evidence on the characteristics of nil-filers and the reasons for their apparently puzzling behaviour. This paper sheds light on this issue in Rwanda, using a descriptive analysis of administrative data, a randomised controlled trial (RCT), and qualitative interviews with taxpayers and tax officials. We argue that evasion is part of the explanation for nil-filing, but it seems to play a relatively small role. Instead, a major reason for nil-filing lies at the interaction between aggressive recruitment campaigns by the Rwanda Revenue Authority (RRA), and taxpayers’ response to a complex and often confusing tax system.
Keywords: tax compliance; tax administration; RCT; nil-filing; taxpayer behaviour.
Giulia Mascagni is a Research Fellow at the Institute of Development Studies (IDS) and Research Director of the International Centre for Tax and Development (ICTD).
Fabrizio Santoro is a Research Officer at the Institute of Development Studies and PhD student in Economics at the University of Sussex.
Denis Mukama is the Head of Research and Policy Analysis at the Rwanda Revenue Authority.
John Karangwa is Manager for Research and Policy Analysis at the Rwanda Revenue Authority.
Napthal Hakizimana is Research and Policy Analysis Officer at the Rwanda Revenue Authority.
Contents
Summary 3
Acknowledgements 6
Acronyms 6
1 Introduction 7
2 Context and data 9
2.1 Taxation in Rwanda 9
2.2 Previous research on compliance in Rwanda 10 2.3 Overview of data and methods 11
3 Anatomy of active ghosts in Rwanda 12
4 RCT: nudging nil-filers 16
4.1 RCT design 17
4.2 Results 18
5 Quantitative analysis: investigating active ghosts 20
5.1 Nil-filing is a conscious behaviour 20 5.2 Nil-filing may be an unintended consequence of RRA campaigns 22 5.3 Taxpayer confusion, compliance costs and administrative complexity 23
5.4 Evasion 25
6 Concluding discussions and policy recommendations 26
Appendix 29
References 39
Tables
Table 1 Treatment messages 17
Table 2 Treatment effects on nil-filing and deregistration – any SMS 19 Table 3 Treatment effects on nil-filing and deregistration 19 Table 4 Summary of explanations for nil-filing behaviour 27 Appendix Table A1 Predictors of nil-returns 2013-2017 29 Appendix Table A2 Nil-filing by sector, 5-year average 30 Appendix Table A3 Nil-filing by number of years with filing 30 Appendix Table A4 Communication strategies by RRA office 31 Appendix Table B1 Summary of samples used in the follow-up experiment 32 Appendix Table B2 Balance tests for 2016 trial sample (p-values) 33 Appendix Table B3 Balance tests for additional sample (p-values) 33 Appendix Table B4 Balance tests for nudge sample after removing TPs who
already declared (p-values) 33 Appendix Table C1 Treatment effects on nil-filing – heterogeneity 34 Appendix Table C2 Treatment effects of any T on nil-filing – heterogeneity 34 Appendix Table C3 Treatment effects on deregistrations – heterogeneity 34 Appendix Table C4 Treatment effects of any T on deregistering – heterogeneity 34
Figures
Figure 1 Nil-filing rate over the period 2013-2017 13 Appendix Figure A1 New registered taxpayers 2005-2017 35 Appendix Figure A2 CIT nil-filing by location and year 35 Appendix Figure A3 PIT nil-filing by location and year 36 Appendix Figure A4 CIT nil-filing by size and year 36 Appendix Figure A5 PIT nil-filing by size and year 37 Appendix Figure A6 Trend of deregistrations from RRA 37 Appendix Figure A7 Explanatory picture on nil-filing tweeted by RRA on
22 March 2018 38
Acknowledgements
This paper was prepared with the support of the International Centre for Tax and Development and the Rwanda Revenue Authority. We are grateful to RRA officials who supported this study, and especially the implementation of the RCT. We are particularly grateful to RRA’s Commissioner General, Deputy Commissioner General, and other members of the Senior Management Team for their feedback. This paper was improved thanks to comments received by Mick Moore and anonymous peer reviewers. All remaining errors are our own.
Acronyms
CIT Corporate income tax DTD Domestic Tax Department ITT Intention-to-treat
PAYE Pay as you earn PIT Personal income tax RCT Randomised controlled trial RDB Rwanda Development Board RRA Rwanda Revenue Authority TIN Tax identification number TOT Treatment-on-the-treated VAT Value added tax
1 Introduction
Policymakers and researchers working on tax compliance have typically been concerned with two kinds of taxpayers: those who file a declaration but under-report their true tax liability, and those who do not even file declarations and thus pay no tax at all. There is, however, a third category that is much less talked about: nil-filers. These are taxpayers who are registered with the tax authority, file declarations, but report zero on all dimensions of the tax declaration, including income and tax. Nil-filers can be seen as ‘active ghosts’, as they produce no revenue, report essentially no information to the revenue authority, and yet actively file declarations, often persistently. They can be related to two other types of ‘tax ghosts’: (i) those who trade in the informal sector and are not registered for tax purposes; and (ii) those who are registered but fail to file a declaration – non-filers. Importantly, nil-filing is widespread across Africa. In Rwanda, nil-filers amounted to over half of all corporate income tax (CIT) declarations in 2017, and about a quarter of personal income tax (PIT) ones. Other studies have documented similar figures in Uganda, Eswatini and Ethiopia, showing that this issue is relevant well beyond the specific context of our analysis (Almunia et al. 2017; Mascagni and Mengistu 2016; Santoro and Mdluli 2019).
While this issue is well known amongst tax administrators, there is still no evidence in the public finance literature as to its reasons. On the one hand, if one were to take
nil-declarations as true, the natural question would be: why do these businesses even exist, if they make no income at all? On the other hand, if this issue is due to evasion, why do these taxpayers register at all, if the intention is to evade all tax anyway? In this paper, we quantify nil-filing in Rwanda and aim to shed light on the reasons behind this apparently puzzling behaviour. To that aim, we use a mix of descriptive analysis of administrative data, a
randomised controlled trial (RCT), and qualitative information collected from tax officials and taxpayers. By doing this, we show that nil-filing, and its reasons, are a lot more complex than one might expect, and deeply intertwined with the practice of tax administration and
taxpayers’ strategies to cope with the tax system. Through the lens of nil-filing, we illustrate how some common challenges of tax-raising in low-income countries unfold in practice, such as the pressure on revenue authorities to collect increasing revenue, administrative
complexity, including divergence between law and practice, taxpayers’ poor understanding of the tax system, and their pragmatic responses to cope with it.
Filling the knowledge gap on nil-filers is important both for research and for policy. We argue that nil-filing is symptomatic of underlying compliance issues, and analysing it provides insights into taxpayers’ difficulties to cope with the tax system (e.g. complex procedures, misunderstanding of the tax process). These issues, in turn, may affect the way tax policy pans out in practice, in the interaction between the practical application of tax rules and taxpayers’ behaviour. From a policy perspective, there are also important implications related to the taxpayer registry, which is often used as a measure of performance in the revenue administration’s efforts to expand the tax base. If nil-filers are inactive taxpayers and should not, in fact, be in the tax registry at all, their presence simply generates an administrative burden and confusion, for example about the total number of actual taxpayers in the country. That, in turn, has implications for research – especially for studies that use administrative data from revenue authorities, which would benefit from more clarity on whether nil-filers should be considered as part of the taxpayer population or not. Most studies concerned with tax compliance currently seem to ignore the issue of nil-filing, or dismiss it by focussing on taxpayers with positive tax liabilities. Finally, if nil-filing is related to non-compliance, then addressing it seems important in the context of fighting tax evasion – even if policymakers should not necessarily expect large revenue gains from addressing this issue, as we argue that most nil-filers are, at most, small taxpayers.
Our paper fills this knowledge gap in two ways. First, we document and quantify the problem of nil-filers in Rwanda, in a literature where there is basically no evidence on the
characteristics of nil-filers (with the exception of Santoro and Mdluli 2019).1 We do so by
using administrative data from RRA’s tax records, described in section 2.3. We show that a large portion of all declarations in Rwanda are nil, and that this issue is of greater concern for corporate taxpayers, over half of which file nil regularly (section 3). Second, we explore some possible explanations for this phenomenon, using both an RCT and qualitative interviews with tax officials and taxpayers. The RCT tests two possible explanations for nil-filing, emerging from our extensive consultations with tax officials (section 4). The first one is that nil-filing is related to tax evasion. The second one is related to complex procedures to deregister as a taxpayer, which means that many prefer to keep filing even if their business is no longer operating. While our analysis lends some support to both hypotheses, neither explains this behaviour in an exhaustive way. Our qualitative evidence complements the RCT results to offer a more comprehensive picture (section 5). A plausible explanation emerging from this analysis lies at the interaction between the practical implementation of tax policy and taxpayers’ strategies to cope with the tax system. On the one hand, the RRA has been conducting campaigns to recruit taxpayers and to encourage them to file, even though it is not always clear that registration is in fact needed. On the other hand, firms cope with their difficulties in taxpaying by finding ways to reduce their compliance burden, while also trying to minimise the probability of being caught and fined. It is this implicit calculation that may lead them to nil-file.
Our analysis relates to the literature on the other tax ghosts mentioned above: non-filers, who are registered but fail to make tax declarations, and informal firms, who are not even registered with the tax authority. Despite the lack of evidence on nil-filers (or active ghosts), these two other types of ghosts have attracted much higher attention amongst researchers. The literature on informal firms is particularly vast and has been reviewed, for example, by La Porta and Schleifer (2014). The informal sector is typically defined as all market-based production of legal goods and services that are deliberately concealed from public authorities for tax purposes, although it must be recognised that informality can exist within formal firms, as well as referring to fully informal firms. According to Schneider and Williams (2013), informality in 2005 ranged from 18 per cent to 61 per cent of the total official GDP of sub-Saharan African countries, much higher than in OECD countries (13%).2 The same authors
report that the burden of tax and social security contributions is by far the most important single determinant of the size of the shadow economy, followed by poor tax morale and quality of state institutions. Informality has severe consequences on the economy. Most importantly, it limits total tax collection (Bird and Zolt 2008), especially in terms of direct income taxes (Besley and Persson 2013; Kleven et al. 2016; Jensen 2019), with negative impacts on the equity of the tax system and tax morale of the taxpaying population. It also leads to inefficient allocation of resources and unfair competition (Hsieh and Klenow 2009), as well as being positively correlated with inflation (Mahzar and Méon 2017).
In comparison to the literature on informality, studies on non-filers are both fewer and more recent. The available evidence shows that non-filing is widespread in high-income countries, for example nearing 50 per cent for local taxes in Detroit, USA (Meiselman 2018). Other studies from the US have confirmed that the share of non-filers for the US federal individual income tax is about 7 per cent for the period 2000-2012 (Erard et al. 2014). Similar findings are available for Latin America, where non-filing is also widespread: in Guatemala, the share of non-filers of income tax in 2013 is 39 per cent (Kettle et al. 2016); in Costa Rica, 50 per cent of tax-liable firms failed to file their income tax declaration for the period 2006-2014
1 Analysing CIT return data over a period of 5 years, Santoro and Mdluli (2019) show that about 30% of returns are nil every year, and that a nil-filer in Eswatini has two-thirds probability of persistently filing nil over time.
(Brockmeyer et al. 2019); in Venezuela, the non-filing rate for the municipal income tax is 20 per cent (Ortega and Scartascini 2016). While there is no specific study assessing the differences in the causes of non-filing between high-income, and low- and middle-income, countries, it is fair to believe that non-filing rates are larger in the latter for a number of concurring reasons: weaker enforcement strategies from less experienced (and motivated, see Khan et al. 2016) revenue authorities, who, for instance, have not yet the capacity to exploit information from third-party reporting (Pomeranz 2015); lack of tax education and taxpayers’ awareness (Mascagni et al. 2019), accompanied by poor assistance from tax officials; worse compliance attitudes and, specifically in Africa, trust in the tax agency (Isbell 2017). By analysing the anatomy of nil-filers, and reasons for their behaviour, we contribute to this literature by adding new evidence on a category of tax ghosts that has largely been ignored so far.
Our work is also related to the growing literature using administrative data for research (Kleven et al. 2011), and particularly studies using behavioural nudges to shape compliance (reviewed in Mascagni 2018). There is abundant evidence that messages sent to taxpayers around the time of declaration have the potential to nudge them to comply – at least in the short term. For example, research from high-income economies suggests that letters containing an implicit or explicit threat of audit increase tax payments (Coleman 1996; Blumenthal et al. 2001, Meiselman 2018; Hasseldine et al. 2007; Hallsworth et al. 2017; Ariel, 2012; Kleven et al. 2011; Fellner et al. 2013; Hernandez et al. 2017; Castro and Scartascini 2015; Pomeranz 2015). However, scholars also highlight the limitations of deterrent nudges in low-enforcement environments (Carrillo et al. 2016), where threats of audit cannot be followed up with actual checks by the revenue authority. Softer, less aggressive messages can be effective too (Kettle et al. 2016), but the impacts vary by context (Ariel 2012). While there is very little evidence from Africa, a previous study from Rwanda seems to confirm the validity of softer approaches in a context where threats are not credible, and may even backfire (Mascagni et al. 2017).3 This study also showed that generic
nudges have only very limited effects on nil-filers (more details in section 2). This prompted us to explore this issue further, by designing a nudge that is specifically targeted at this group. By doing so, we contribute to the experimental literature on tax compliance in two ways. First, we present novel evidence on the effect of nudges on nil-filers. Second, and perhaps most importantly, we provide some guidance on how this group should be treated in future research using administrative data, where nil-filers are a reality.
2 Context and data
2.1 Taxation in Rwanda
Rwanda’s tax-to-GDP ratio stood at about 16 per cent in 2018, with a relatively large proportion of the tax take coming from direct taxes (over 40%).4 Despite being largely a tax
success story, the country faces many of the typical challenges of low-income countries, such as constraints in administrative capacity, informality and a poor taxpaying culture. In this paper we focus particularly on income taxation for businesses, but we also use value added tax (VAT) data to cross-check and complement some of our results on income taxes. Within the broad category of income taxes, there are three main kinds of taxes in Rwanda: personal income tax (PIT), corporate income tax (CIT), and pay as you earn (PAYE). We focus on taxes levied on businesses (CIT and PIT) rather than employees (PAYE), who typically have fewer opportunities to evade (Kleven et al. 2011). Both CIT and PIT liabilities
3 Other relevant studies from Africa are Shimeles et al. (2017) in Ethiopia, and Almunia et al. (2017) in Uganda. 4 Source: ICTD/UNU-WIDER Government Revenue Dataset.
are self-assessed annually through tax declarations filed between 1 January and 31 March, which refer to the year that ended the previous 31 December. Relatively large PIT taxpayers are subject to a progressive tax schedule and have to submit full books of accounts, while smaller ones can benefit from looser reporting requirements under two simplified declaration regimes (the lump sum and flat amount regimes).5 CIT is instead levied at a flat rate of 30
per cent, with some reductions available for specific groups.6 CIT taxpayers are typically
larger than PIT ones, being generally more sophisticated organisations that rely less on one individual. However, simplified regimes are also available for CIT taxpayers, although there are relatively few corporations small enough to qualify for them.
CIT and PIT, together, accounted for about 16.9 per cent of total tax revenue in Rwanda in 2016 (ICTD Government Revenue Dataset). Of the 50,346 income tax declarations received by RRA in 2017, 44 per cent related to PIT and the rest to CIT. However, CIT raised over 86 per cent of total revenue for those two taxes, as corporate taxpayers (CIT) are typically much larger than unincorporated ones (PIT).7 The location of taxpayers is relevant too: while over
half of all declaring taxpayers are registered in the province of Kigali, the capital city, they account for 94 per cent of the tax take, while taxpayers based elsewhere in the country contribute the remainder. At the same time, most tax revenue is raised from the largest taxpayers. The 10 per cent richest CIT taxpayers in Rwanda (i.e. the top decile) contributed 94 per cent of the total CIT tax take, while the corresponding figure for PIT is 82 per cent.8
2.2 Previous research on compliance in Rwanda
While tax compliance research is relatively scarce in African countries, Rwanda is somewhat an exception. Our study is particularly linked to a previous RCT (Mascagni et al. 2017), which tested a nudging strategy to encourage taxpayers to comply more with income tax (CIT and PIT). This section briefly reviews this study because it has deeply affected our research design, as well as representing a key motivation for this paper, as we explain below. The 2017 RCT aimed to understand the drivers of compliance in Rwanda, and the best way to reach out to taxpayers with personalised messages. More specifically, it involved nine treatments that included one of three message contents (deterrence, fiscal exchange or reminder), which were sent through one of three delivery methods (letter, email or SMS). While a full discussion of the experiment and its results is available in Mascagni et al. (2017), it is worth mentioning here two main results that are particularly relevant to our study. First, friendly approaches, and especially simple reminders, seem to be more effective than deterrence to boost compliance in Rwanda. Second, non-traditional ways to communicate to taxpayers, such as SMS and email, were shown to be highly effective in increasing declared taxes, compared to letters. We take these two results directly into consideration in the design of our RCT on nil-filers (see section 4).
However, the 2017 study leaves an open puzzle about nil-filers. None of the experimental treatments led to much change in their behaviour. Most of them continued to be nil-filers. Most of the observed response to the 2017 RCT came from those taxpayers who already had a positive tax liability in the baseline year. This finding represented a key motivation for us to design a follow-up experiment that specifically targets nil-filers, to test whether
5 The progressive tax schedule is: income below RWF 360,000 is exempted; between RWF 360,001 and RWF 1,200,000 is taxed at 20%; incomes above the latter threshold are taxed at 30%. Firms with turnover between RWF 12 million and RWF 50 million are subject to a lump-sum tax of 3% of turnover. Microenterprises generating a turnover of more than RWF 2 million (the exempt threshold) and less than RWF 12 million pay a flat amount between RWF 60,000 and RWF 300,000, depending on income (RRA 2017: Articles 11 and 12).
6 e.g. some reductions exist for new businesses and those employing Rwandan nationals (RRA 2017: Articles 41 to 43). 7 The latter reported an annual average income of RWF 16 million (US$17,720), versus RWF 144 million (US $161,645) declared by CIT taxpayers. The amount of tax payable declared is also different in magnitude, with PIT averaging RWF 325,000 (US $360), while the same figure for CIT is about RWF 2.3 million (US $2,600).
messages that are more specific to their situation may induce a higher response (more details in section 4). At the same time, we build on the lessons learned in the 2017 RCT, and remain in line with the best practice in the behavioural nudges literature (more details in section 4). As in the previous study, we use the RRA platform to send personalised
messages that include taxpayers’ names. Learning from the results on delivery methods, we chose to focus on SMS only in this study, as they are highly effective and much cheaper and easier to deliver than letters.9 Considerations on cost-effectiveness are particularly important
in contexts like Rwanda, where resources are limited, and keeping in mind that RRA might adopt interventions like the one we are testing here more routinely in the future.
2.3 Overview of data and methods
In this section we provide an overview of our data and methods jointly, highlighting how each source of data is used with which specific method. We also report more details on our
empirical framework, for the RCT and the qualitative interviews respectively, in sections 4 and 5.
Before delving into our data and methods, it is useful to note at the outset that this study benefited immensely from extensive consultations with tax officials from relevant RRA departments (e.g. corporate risk, taxpayer services, small taxpayers’ office, large taxpayers’ office, IT and auditors). These consultations have been highly iterative in nature and were carried out over an extended period of more than five years. They allowed us to do two things. First, to formulate hypotheses, to be tested in the RCT, informed by the wealth of experience developed by officials in their frequent interactions with taxpayers. Second, to collect information and anecdotal evidence that we could then explore in more detail in our qualitative interviews with taxpayers and tax officials.
As far as data is concerned, we use two main sources of information: administrative data from RRA’s database, and interviews with taxpayers and tax officials carried out in February 2018.
The first one is a rich set of administrative data from tax returns, compiled by RRA. This data allows us to observe actual compliance behaviour, as it captures what taxpayers reported in their declarations and hence the basis on which they are taxed. More specifically, we use three main administrative datasets from RRA: the tax registry, income tax returns and deregistrations.10 The tax registry contains all taxpayers who registered from 2005 to 2017,
including information on their location, sector and date of registration. The tax returns dataset contains all CIT/PIT declarations from 2013 to 2017. All data is at the taxpayer level. They include mostly financial variables used to calculate taxes (e.g. total sales and taxable
income), as well as some taxpayer characteristics, such as sector and geographical location. Lastly, we have a detailed dataset on those taxpayers who deregistered from the RRA between 2015 to 2017. The most recent data used in this study was collected in July 2017. This means that we have information on all taxpayers who had deregistered by 18 July 2017. We use this administrative data for the descriptive analysis of section 3 and for the RCT, reported in section 4. The descriptive analysis provides an anatomy of nil-filers, using data for all available years. Here, we simply describe their characteristics and trends over time. For example, we check whether nil-filing is more prevalent within Kigali province or
elsewhere in the country, and whether it is a greater concern for corporate (CIT) or
9 A more detailed discussion of delivery methods in the context of Rwanda is available in Mascagni et al. (2017). 10 We also look at additional tax returns datasets: VAT declarations from 2013 to 2017 and data on payments of patente
(trading licence) over the same period. These datasets are used to cross-check VAT filing behaviour and patente payments of income tax nil-filers (section 4.1).
unincorporated (PIT) taxpayers. This information provides a guide for policymakers and researchers to understand this phenomenon and identify the main groups affected. The RCT focuses particularly on data for the tax year 2015 (corresponding to declarations filed in the period January-March 2016, before the intervention) and 2016 (corresponding to
declarations filed in the period January-March 2017, after the intervention). We provide a lot more details on the design and methods used in the RCT in section 4.
The second source of data comes from qualitative interviews with a random sample of 30 nil-filers and 24 RRA officials. The latter are more formal interviews than the consultations mentioned above, and are based on a standard questionnaire. While the number of qualitative interviews with taxpayers is limited, our interviews with auditors bring a broader perspective from their close experience with hundreds of taxpayers. The research team at RRA implemented the qualitative data collection. Interviewees were, however, informed that this was part of an independent study and their responses would be used for research purposes only and not for any other RRA-related activities. Interviews of nil-filers were deliberately brief and focussed on three objectives. First, the interviewer asked whether respondents were aware of their nil-filing status, and whether RRA records were correct. Second, they investigated the reasons for nil-filing. Finally, an open-ended part of the
questionnaire involved a follow-up discussion related to the reasons taxpayers gave for their behaviour. So, for example, interviewers enquired about the status of the business, whether they plan to deregister, or whether they are actually active at all. All interviews happened by phone. Interviews to tax officials were carried out face-to-face with staff from the domestic tax department (DTD), IT and compliance units. The questionnaire included general
questions on their awareness of the nil-filing issue, any measures that RRA (and specifically their department) had taken to tackle this issue, as well as more targeted questions for specific departments. For example, we asked DTD officials details about recruitment campaigns, as these emerged from consultations as a potential reason for the widespread presence of nil-filers. With officials from the IT department we explored the possibility of mistakes in the data, or confusion between nil-filers and non-filers.
The qualitative data was elaborated by the authors to distil some key themes and
explanations for nil-filing. These themes have been identified primarily thought the qualitative data, but also in light of their experience on tax research in Rwanda and the extensive consultations mentioned above.11
3 Anatomy of active ghosts in Rwanda
Based on the administrative data described in section 2.3, we start by providing an anatomy of nil-filers, using descriptive statistics. We are able to map the extent of active ghosts over the 5-year period 2013-2017, both for CIT and PIT payers, and explore the heterogeneity within this population. In doing so, we keep in mind our question on the reasons why taxpayers nil-file, and start looking for evidence of possible explanations.
Our descriptive analysis confirms that filing nil is a common practice in Rwanda: the five-year average rate of nil returns over the total number of returns lodged is 53 per cent and 17 per cent respectively for CIT and PIT payers. Nil-filing seems to be common practice in the life of a taxpayer, especially for corporations: out of a population of 45,941 CIT taxpayers who filed at least once in the period under study, 70 per cent filed nil at least once, while the same figure is 18 per cent for PIT (out of 68,342 filing individuals). In order to provide a visual
11 Three of the authors of this paper are officials from RRA’s Research Team, and the others have worked extensively on tax in Rwanda, beyond this specific project.
exposition of the nil-filing behaviour, Figure 1 plots the nil-filing rate over time and allows us to make two initial considerations.
Figure 1 Nil-filing rate over the period 2013-2017
Source: authors’ computation based on RRA data.
First, CIT payers are consistently more likely to file nil than PIT ones. Every year more than half CIT payers file nil, while this behaviour is less pronounced for PIT ones, who are, in turn, more likely to not file at all. There is indeed quantitative and anecdotal evidence that non-filing is extremely common for PIT payers. A recent study on newly registered income tax payers in Rwanda found that just 35 per cent of PIT taxpayers who registered in 2015
actually filed a return in the same year, compared to 47 per cent of CIT ones (Mascagni et al. 2019). The same pattern repeats one year later (2016), with 68 per cent of PIT payers filing versus 88 per cent of CIT payers. These figures might suggest that the higher extent of nil-filing among CIT payers may be related to their higher probability of nil-filing in the first place. It could well be that CIT payers are more able to use nil-filing to navigate the tax system (e.g. thanks to the assistance of tax advisers) and avoid the high penalties for failure to file that are levied in Rwanda. A similar pattern of behaviour has been found recently in Eswatini (Santoro and Mdluli 2019): there, too, CIT payers are more likely to nil-file, while PIT payers are more likely to fail to file at all.
A second consideration relates to the sharp increase in nil-filing around 2014. As the qualitative evidence summarised in section 5 explains, this could be a natural consequence of the large increase in registrations reported in recent years.12 With the Revenue Authority
pushing to register taxpayers, often unnecessarily (see section 5), the probability of nil-filing may increase, since many of the new taxpayers are recruited without even having actually started a business and therefore are unlikely to generate any income. Indeed, Appendix Figure A1 shows that registrations of new taxpayers peak in 2014 with more than 23,000 taxpayers entering the system, representing an increase of 66 per cent with respect to the year before. After 2014 the number of registrations rapidly decreases and stabilises around an average of 18,000 in 2015-2017.13 We discuss in more detail the relation between
nil-filing and registration campaigns in section 5.
The next question we ask is whether taxpayers nil-file persistently over time or move in and out of nil-filing. Our data reveals that perpetually nil-filing taxpayers (perpetuals) are
12 Internal discussions with RRA showed a second explanation for this increase may be related to the simplification of the declaration process via online declaration. However, we do not have any evidence to support this claim.
13 The peak of registrations in 2014 is not affected by the incident of mass registrations of over 40,000 taxpayers with patentes (see section 5.2). That isolated incident took place in October 2016. Also, all those extra registrations have been removed from the analysis.
widespread. More specifically, two-thirds (67%) of CIT payers who nil-file at least once are perpetual nil-filers over the data period – they file nil every time they file. This amounts to 21,615 unique perpetually nil-filing taxpayers, or almost half (47%) of all CIT payers filing in the period. Importantly, a very similar figure is found in Eswatini (Santoro and Mdluli 2019), where 66 per cent of CIT nil-filers are perpetuals – confirming that this issue is not confined to the Rwandan case. As far as PIT is concerned, about 60 per cent of taxpayers who nil-file at least once are perpetuals, consisting of 7,551 individuals (11% of the total filing
population).14
A closer inspection of the data provides a more detailed picture of nil-filing across some relevant taxpayer characteristics. We summarise our main findings below. Appendix Table A1 reports the coefficient of a linear probability model in which the dependent variable is an indicator variable for a nil return in a given year, regressed over the set of taxpayers’ characteristics discussed below.
Business size
Although by definition we have no income information for nil-filers (they report zero), we can still classify them as small, medium or large according to the categorisation available in the taxpayer registry.15 As expected, nil-filers are typically small taxpayers: amongst CIT payers
in 2017, nil-filers represent 55 per cent of small taxpayers, and only 3 per cent of medium and large ones, while the same figures for PIT are 25 per cent and 5 per cent. The figures for small taxpayers are alarming, as over half of those registered for CIT file nil, possibly
meaning that most small businesses are either inactive or unproductive.16 However, it is also
concerning that a share, albeit small, of large corporations files nil.17 Appendix Figures A2
and A3 display the frequency of nil returns by business size for both CIT and PIT, over time. In addition, we consider another indicator about size – the business income reported – to explain movements in and out of nil-filing. More specifically, we compare taxpayers who never filed nil with those that did so at least once over the period.18 As expected, those
taxpayers moving in and out of nil-filing are much smaller in size: on average, CIT (PIT) taxpayers declare 69 (14) million RWF, compared to 406 (17) million RWF declared by CIT (PIT) taxpayers never nil-filing. The difference is highly statistically significant.19
Location
Second, nil-filers are more likely to be based in Kigali. Of all CIT declarations for 2017, 58 per cent of those in Kigali were nil, while this figure was 52 per cent outside of Kigali (the figures for PIT are 36% in Kigali and 14% out of Kigali). Appendix Figures A4 and A5 show the distribution of both CIT and PIT nil-filers in and out of Kigali, over time. Nil-filers being more common in Kigali can be explained by the fact that more business opportunities can be
14 Considering a taxpayer-level [0-1] nil-filing share, built as the fraction of the number of years with nil returns over the total number of years with filing, CIT payers show a nil-filing share of 58%, while it is much lower (14%) for PIT. CIT payers file on average 3.7 years over the 5-year period, while PIT file on average 3.2 years.
15 Size here does not refer to actual turnover, but to an administrative process through which RRA categorises all taxpayers.
16 Note that, to be classified as a nil-filer, a firm needs to declare zero in all fields. Our definition, therefore, does not capture firms that make a loss, as long as they declare values of income and expenses that are different from zero. 17 For CIT, all the 59 large nil-filers are from Kigali, while 92% of the 239 medium nil-filers are from the capital. Also, 96%
and 92% of large and medium nil-filers are private corporations, respectively. The most common sector for large (medium) are services, 26% (31%) and general commerce, 24% (43%), while for 24% (11%) sector is not specified. For PIT, all 4 large and 117 medium nil-filers are based in Kigali and running individual enterprises, while 30% of both large and medium are in general commerce (sector not available for 43%).
18 We exclude persistent nil-filers.
found in the capital. This can arguably translate into more, often unnecessary, registrations with the tax authority, and, consequently, more nil-returns (see section 5). At the same time, tax avoidance mechanisms, such as nil-filing, are usually more common in more
sophisticated settings such as urban areas.
Sector
If we consider the business sector, CIT nil-filing is more common in construction (64%), energy, oil, mining (60%) and telecommunications (52%), while it is less relevant in
professional activities (36%), finance (41%) and tourism (42%). While it may seem puzzling that nil-filing is more prevalent in sectors that typically have very large firms, it should be noted that these same sectors also have a number of small players, in addition to the very large ones, who may well be more prone to issues like nil-filing. For PIT payers, as many as 91 per cent in finance are filing nil, followed by construction (48%), professional activities (21%), while sectors as transport (3%), trade (14%) and tourism (14%) show a much lower incidence of nil returns (see Appendix Table A2 for a summary of the results).
Real vs. simplified regimes
As an additional layer of heterogeneity, we now focus on the differences across the tax regimes described in section 2.1. Our data shows that nil-filing is more prevalent in the real regime (the standard regime of tax in Rwanda) than in simplified ones: as many as 57 per cent of CIT payers in the real regime filed nil on average over the period, versus only 11 per cent of those with simplified regimes. The same holds true for PIT payers: 25 per cent in the real regime filed nil, versus only 5 per cent of those with simplified regimes. This finding can be explained by the fact that taxpayers in simplified regimes have much lower compliance costs and know exactly the tax amount due, as opposed to taxpayers in real regimes who have to provide full business records. In this scenario, nil-filing can be an immediate solution to an excessive filing burden for real regime taxpayers: by filing zero they can save time and effort, while still avoiding penalties for non-filing or filing late. In fact, if nil-filing reflected true declarations, it would be rather counter-intuitive to find less nil-filing among taxpayers in the simplified regimes, since they are in principle more likely to be unproductive and have zero turnover. The hypothesis that nil-filing is related to compliance costs is discussed in more detail in section 5.
Timing and frequency of filing
Furthermore, we investigate whether nil-filing correlates with the timing and frequency of filing. First, it can be noted that CIT (PIT) nil-filers are much more likely to be filing late: 71 per cent (57%) of late filers are filing nil, versus 49 per cent (12%) of on-time filers. This finding is highly consistent with RRA campaigns pushing taxpayers to file a tax return even with nothing to declare: in order to avoid penalties for failure to file, taxpayers who did not generate any income or did not trade at all in the year are encouraged to file nil (more details on these campaigns in section 5). Second, for CIT payers, nil-filing seem to be inversely correlated with the number of years of filing, ranging from 68 per cent of nil returns among taxpayers who filed only once, to 34 per cent among those who filed five times – every year in the period. Taking the number of years with filing as a proxy for the life of the business, this relation might point to the fact that many businesses are short-lived in low-income countries (McKenzie and Paffahusen 2017), or that it usually takes years for a new company to start generating any taxable income. In this case, the probability of filing nil drops sizably after the fourth year of filing. However, this inverse linear relation does no hold for PIT payers (see Appendix Table A3). Third, and relatedly, if we consider the year of registration
payers who are in their first year of filing in 2017 file nil, as opposed to 53 per cent of those who, in 2017, were in their second to fifth year of declarations. However, again PIT payers do not show the same pattern, with 19.5 per cent of those in their first year filing nil, vis à vis 20.6 per cent of those in their second or higher year. We get back to some of these issues, such as the age of the business and on-time filing, in section 5.
In sum, the typical nil-filer in Rwanda is a rather small and young business, based in Kigali, mostly working in construction or energy and mining, and has a consistent habit of filing late. While this evidence is purely descriptive, it helps to cast some light on a largely unknown issue, and starts providing some guidance for policymakers who might want to tackle it. As for our question on the reasons for nil-filing, this descriptive evidence is certainly only indicative, though it points to a possible relation with compliance costs and evasion, as well as unsuccessful businesses. We discuss these possible explanations in more detail in the next two sections.
4 RCT: nudging nil-filers
We use an RCT to nudge taxpayers with messages specific to nil-filers and to test whether such treatments may affect their behaviour, as opposed to the more general compliance messages of the previous experiment, which did not yield much of a reaction from nil-filers (see section 2.2). In particular, we test two hypotheses, which emerged repeatedly from our consultations with RRA officials and from the descriptive analysis of section 3.
Hypothesis 1: nil-filers are evaders
The first one is that nil-filing is, in fact, related to evasion. These taxpayers should declare some income, but decide instead to declare nil to avoid paying any tax at all. Of course, this would be quite a puzzling evasion strategy, since if one intended to evade all tax they could simply avoid registering and remain completely under the radar. However, officials
repeatedly suggested that it may be preferable for taxpayers to register and have a tax identification number (TIN), but then pay no tax, rather than being completely underground. We therefore decided to include a deterrence message in our RCT, as this would elicit a response if nil-filing is due to evasion and, of course, taxpayers find our message credible.
Hypothesis 2: nil-filers should deregister, but fail to do so
The second hypothesis relates to the suggestion that nil-filers are not active taxpayers and they should, in fact, not even be registered at all. This hypothesis also emerged from our consultations with RRA and is consistent with to other bits of evidence: 1) that most nil-filers are perpetual nil-filers (see section 3); and 2) that procedures for deregistering a business were quite complicated up to the end of the fiscal year ending in December 2016 – right before our intervention. Before the policy change, a taxpayer who wished to deregister had to gain approval from four separate offices: the local RRA branch, the local branch of the
private sector federation, the local government village office where the business is located, and the RRA office (regional or head office). At each step, they were required to get
paperwork signed, with possible delays and opportunities for illicit transactions. This
paperwork then needed to be returned to the RRA office in the tax centre where a taxpayer had his/her tax registration. Recognising this complexity, the RRA changed the procedure in early 2017, and moved to a much quicker, one-step procedure that could be entirely
credible explanation for nil-filing, and included a message aimed at nudging taxpayers to deregister.
4.1 RCT design
Our treatments target a group of taxpayers who nil-filed for the fiscal year 2015 and who we could reach with an SMS (i.e. for whom a phone number is available). We include both new taxpayers who registered in 2015 and older ones who registered in 2013 and 2014. The latter group also includes taxpayers who already received a nudge in the 2017 experiment. As our analysis will show, relatively newer and older taxpayers behave differently, and this distinction helps us in exploring the reasons why active ghosts nil-file. More details on our sample and its relationship with the 2017 RCT can be found, respectively, in Mascagni et al. (2017) and in Appendix B.
As in the 2017 RCT, as well as the tax experiments literature more broadly, our messages are sent through RRA’s official channels, directly from the tax authority, and address taxpayers using their name. Also in line with the literature and best practice in tax
experiments, we include a neutral control message in addition to our treatments. To tailor these specifically to nil-filers we include a brief sentence highlighting the fact that the RRA knows that they are filing nil. Table 1 reports the three messages that are part of our intervention: a reminder, a deterrence message (related to hypothesis 1 above) and a deregistration message (related to hypothesis 2 above). The SMS contents were developed in close collaboration with the RRA to make sure that they are both relevant to the Rwandan context and in line with existing laws, regulations and practices. All treatment effects are to be compared with a control group that received no message. Depending on the effectiveness of each treatment, we can therefore draw conclusions as to the validity of our hypotheses.
Table 1 Treatment messages
T1:
Deterrence Last year you declared zero income for CIT. If you under-report your income, you can be fined! Avoid penalties. For info: www.rra.gov.rw. T2:
Deregistration Last year you reported zero income in your CIT declaration. Do you need to deregister? It can only take 3 days! For info: www.rra.gov.rw. T3:
Reminder RRA would like to inform you that your CIT tax return is due by 31/3/16. For info, visit www.rra.gov.rw. C No message
Each taxpayer received only one of the messages above, based on their random allocation to one of three groups – or the control group, which constituted a fourth group. More details on the randomisation process are available in Appendix B, as well as balance tests
confirming that randomisation was successful. That means that the treatment groups are comparable to each other, and, consequently, any treatment effect on the outcomes of interest can be attributed to the treatment and not to pre-existing differences across groups. The RRA implemented the whole intervention in full accordance with their normal
procedures. SMS were sent through the official RRA platform, to keep our study as aligned as possible with the RRA standard communication strategy, where the RRA is the
implementing actor.20 Therefore, taxpayers were not aware of the research component of
this study, which also serves as an evaluation of RRA’s communication strategy and the related procedures.
All taxpayers allocated to a treatment group received messages during the filing period relative to fiscal year 2016, for which declarations were due between 1 January and 31 March 2017. They received the same message twice: the first time between 13 and 15 February, and the second time between 21 and 22 March. While we know who are the taxpayers allocated to receive our treatments, we do not have delivery reports. That means we can only estimate intention-to-treat (ITT) effects, and not treatment-on-the-treated (TOT) effects that would take into account the actual delivery of the treatment. While this is a limitation, ITT effects are normally considered to be more policy relevant since policymakers cannot usually mandate treatments. In this case, for example, they cannot force taxpayers to receive and read the messages sent by RRA.
Once we received all post-treatment data, from the declarations filed by 31 March, we evaluated the effectiveness of our intervention on two outcomes: the probability of switching out of nil-filing, and the probability to deregister. As far as the former is concerned, the expected impact would be a reduction in the incidence of active ghosts – which would confirm that nil-filing is linked to evasion. While reminders proved to be effective in the previous RCT (Mascagni et al. 2017) as well as in other developing economies (Del Carpio 2013; Ortega and Scartascini 2017), a stronger impact is expected from the deterrence SMS, in line with the empirical evidence on the traditional approaches to tax compliance (see e.g. Carrillo et al. 2017). At the same time, a deterrent tone might not have an impact if the
message is not considered to be credible, or if it is crowding out intrinsic motivation to comply (Frey and Feld 2002). As far as deregistration is concerned, we expect an increase in
deregistrations after receiving the corresponding nudge, while we are agnostic about the effects of the reminder and the deterrence nudges on this outcome.
All descriptive tests and regressions are only based on those taxpayers who submitted tax declarations after having received the treatment. There were about 670 taxpayers (6.2%), who were part of the nil-filers group at baseline, who did not declare at all for fiscal year 2016 – of which about 300 appear as having deregistered by June 2017.21 Of those who declared,
23 per cent (or 2,344 taxpayers) did so before the treatment and are therefore excluded from the analysis. Appendix Table B4 shows that the balance is still achieved once we remove early filers, except for one category (PIT in real regime). As a result, the descriptive and regression analysis focuses on a restricted sample of 6,935 taxpayers.22
4.2 Results
Using our sample of 6,935 nil-filers,23 Tables 2 and 3 report results from probit regression
analysis where the binary outcome variables are nil-filing (columns 1 and 2), and whether taxpayers deregistered after the treatment (columns 3 and 4).24 Note that for the latter
outcome we can use a larger sample size because we do not drop those nil-filers who did not file or filed before the treatment, since in principle they could have deregistered even in such cases. Therefore, in estimating the impact of the deregistration SMS, we want to include these taxpayers as well. Table 2 displays the overall impact of being assigned to receive any type of nudge, compared to the control group that received no message, while Table 3
21 These nil-filers failing to file are balanced across treatment arms. 22 Equal to 10,792 – 670 (fail to file) – 2,344 (file before SMS).
23 These are divided into four groups of similar size - about 2,450 taxpayers each (i.e. deterrence, deregistration, reminder and control).
24 We also perform a more descriptive Mann-Whitney test for equal means across groups. The results are very similar to those in the regression analysis, so we omit them for brevity.
shows the impact disaggregated by each type of SMS. In both tables, regressions in columns 1 and 3 include only the treatment variables as explanatory factors, with the control group being the excluded category. Columns 2 and 4 add four relevant control variables, all of which are binary, namely: whether the taxpayer is subject to CIT or PIT (CIT), whether they are a newly registered taxpayers or not (OLD), whether they are subject to the real regime in the baseline year (real regime 2015), and whether they are classified as large or top medium taxpayer for administrative purposes (large). All regressions are estimated using a probit model, with the table reporting marginal effects measured at the means of the controls. Standard errors are clustered at the tax centre level. All regressions provide results on the intention-to-treat (ITT), as discussed in section 4.1.
Table 2 Treatment effects on nil-filing and deregistration - any SMS
Nil-filing Nil-filing Deregistration Deregistration
(1) (2) (3) (4)
Any treatment -0.022*** -0.014** 0.005*** 0.004*** (0.007) (0.007) (0.002) (0.002)
Controls No Yes No Yes
Control mean 0.864 0.864 0.01 0.01
Observations 6935 6935 9809 9809
*p < 0.10, **p < 0.05, ***p < 0.01. Standard errors in parentheses. Nil-filing and Deregistration are dummy variables with value 1 if the taxpayers filed nil and deregistered, respectively. Coefficients are marginal effects from probit regressions evaluated at mean. The control group consists of taxpayers who did not receive any SMS nudge.
Table 3 Treatment effects on nil-filing and deregistration
Nil-filing Nil-filing Deregistration Deregistration
(1) (2) (3) (4) Reminder -0.024*** -0.015** 0.000 -0.002 (0.006) (0.006) (0.002) (0.002) Deterrence -0.02*** -0.012 0.003 0.002 (0.007) (0.007) (0.003) (0.002) Deregistration -0.023** -0.015 0.009*** 0.009*** (0.01) (0.01) (0.003) (0.003)
Controls No Yes No Yes
Control mean 0.864 0.864 0.010 0.010
Observations 6935 6935 9809 9809
*p < 0.10, **p < 0.05, ***p < 0.01. Standard errors in parentheses. Nil-filing and Deregistration are dummy variables with value 1 if the taxpayers filed nil and deregistered, respectively. Coefficients are marginal effects from probit regressions evaluated at mean. The control group consists of taxpayers who did not receive any SMS nudge.
Treatment effects on the probability to nil-file
The results are largely consistent with the descriptive tests. For what concerns the impact on nil-filing, receiving any treatment significantly reduces the probability to file nil by 2.2
percentage points (Table 3). This corresponds to a 2.5 per cent increase compared to the average in the control group (86%), reported at the bottom of Table 2. Looking at
disaggregated treatments, Table 3 shows that the reminder is the most effective nudge in decreasing the probability of nil-filing, with a coefficient of -0.024, significant at the 1 per cent level without controls, and of -0.015 significant at the 5 per cent level when controls are added. This result is consistent with the findings of the previous RCT (Mascagni et al. 2017), both from a qualitative perspective and in terms of the magnitude of the coefficient. Also in line with the results from the previous trial, the deterrence nudge seems less effective in reducing the incidence of nil-filing, as its coefficient is smaller than the reminder in column 1 (Table 3) and non-significant in column 2. A somewhat surprising result is the significant impact of the deregistration message on the likelihood to file nil, which however turns
insignificant when controls are added. This result could be explained by the fact that this treatment can be seen as a form of friendly deterrence. However, it must be noted that the coefficients on our disaggregated treatment variables are not statistically different from each other. It therefore seems that taxpayers react similarly to any message from the revenue authority.
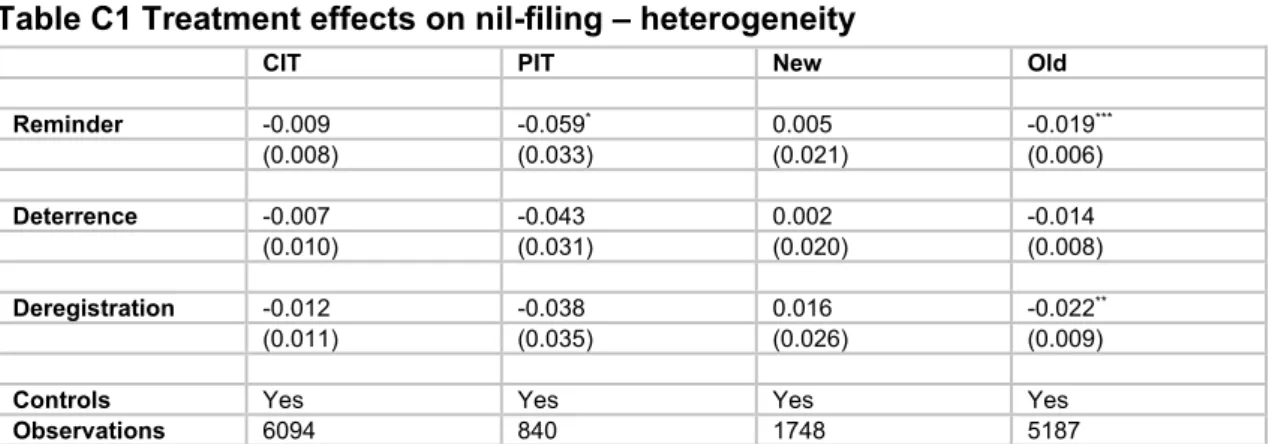
Looking at the heterogeneity of impacts, Appendix Table C1 reports the results for sub-samples of CIT versus PIT taxpayers, and ‘new’ versus ‘old’ nil-filers. These results are weaker than those looking at the full sample, especially for sub-groups with smaller sample sizes, such as PIT taxpayers. Nonetheless, they provide two sets of useful insights. First, as far as nil-filing is concerned, the treatment (especially the reminder) is more effective for PIT and old taxpayers. This may suggest that nil-filing might be used more as an evasion
strategy for PIT taxpayers, compared to CIT ones. Similarly, old taxpayers might be more likely to hide income through nil-filing, while new ones may genuinely be inoperative and have zero income to declare.25
Treatment effects on deregistration
For deregistrations, while the effect of receiving any treatment is significant in nudging taxpayers to deregister (Table 2), only the deregistration message remains highly significant once we look at disaggregated treatments (Table 3), with or without controls (columns 3 and 4). The deregistration message leads to a 1 percentage point increase in deregistrations, which implies a doubling of deregistrations compared to the control group average of 1 per cent. Appendix Figure A6 maps the extent of deregistrations from August 2016 to June 2017, three months after the trial. It shows that deregistrations peak in February and March 2017, the two months of the trial implementation, which can be interpreted as further confirmation of the significant finding from Table 3.
This finding is of course expected, as the deregistration message was specifically designed to communicate the new simplified procedure for deregistering adopted by RRA just a few months before our intervention. In terms of our hypotheses, it suggests that there is some truth in the suggestion that nil-filers are filing true amounts (i.e. zero) and that they should not be in the registry – rather than them being evaders. Telling them about simplified procedures, combined with a signal of enforcement capacity, pushes them to deregister from the system. In terms of policy, this result highlights the importance of communicating policy changes clearly so that taxpayers can take them up.
As far as heterogeneous effects are concerned, Appendix Table C3 shows that the treatments are more effective for CIT taxpayers and for new taxpayers.26 The latter is
consistent with the results on nil-filing and with the idea that some new businesses are, in fact, inactive and have perhaps been pushed to register prematurely by RRA’s mass registration campaigns (more details in section 5). A very similar finding comes from a separate study on tax training programmes for new registered taxpayers (Mascagni et al. 2019), where a large portion of new taxpayers expressed willingness to deregister from the authority, despite being in the very first year after registration.
In sum, while some of our treatments are effective, particularly reminders, the effects’ magnitude is quite small. The great majority of nil-filers in our sample, about 85 per cent, do not react to our nudge and continue to file nil after the experiment. Therefore, while the explanations linked to evasion and the need to deregister are part of the story, they are not
25 In addition, in Appendix Table C2 we also report impacts by groups, but looking at ‘any treatment’ only: sub-groups are larger now and we are more confident about the significance of the results.
fully exhaustive. The next section will add some qualitative evidence in order to better unpack the reasons for nil-filing, in light of the lack of strong impacts in the RCT.
5 Qualitative analysis: investigating active
ghosts
The results of the RCT leave the question of why active ghosts exist largely unanswered – despite an indication that evasion and the complexity of deregistration are a part of the explanation. We therefore use the qualitative interviews to investigate other explanations that we could not capture with the RCT, and to explore further some insights emerging from our data analysis (sections 3 and 4). While the main source of information in this section is the qualitative data collected through interviews (see section 2.3), we also go back to the
administrative data, when relevant, to check for the plausibility of the explanations discussed here and to provide additional tests. The next four sub-sections discuss the inter-related findings emerging from our qualitative analysis, which provide a more complete picture on the practice nil-filing and its reasons.
5.1 Nil-filing is a conscious behaviour
During our interviews we checked whether taxpayers are aware of their nil-filing status. We asked this question to confirm that nil-filing is not due to any kind of error in the data, but instead it is indeed a conscious behaviour. To the same aim, we also interviewed officials from RRA’s IT department. Our interviews with both officials and taxpayers overwhelmingly confirm that nil-filing is indeed a conscious behaviour, rather than a data issue. All
interviewed taxpayers said they are aware of their status and confirmed their nil return for the year 2016 (the last year before interviews). The majority (57%) of them also know they have filed nil declarations consistently in the last three years, while 20 per cent reported that they have declared nil twice in the last three years. RRA officials in the IT department also
confirmed that nil-filing is due to taxpayers actively filing zero, while other instances, such as non-filing or missing variables, are distinguishable from nil-filing in the data.These responses give us confidence on the accuracy of the declaration data contained in the RRA system, and allow us to rule out simple data mistakes as a key explanation.
When asked about the reasons for nil-filing, the majority of active ghosts (73%) reported that they registered a business that, however, never actually operated. Also, survey data recently collected in the context of a separate study shows that 72 per cent of the interviewed
taxpayers registered with RRA before starting operations.27 The fact that many nil-filers are
in fact not in operation is consistent with the results of the RCT, where most taxpayers did not respond to the nudge by switching to declaring positive amounts – possibly because they are genuinely making no income. As for the reasons for being inactive, 30 per cent said they were still waiting for tenders to come through, 17 per cent had either got another job or did not have enough capital to start operations, while 13 per cent were waiting to get approval by the regulatory agency to start business. Some interviewees (13%) said they were in the process of getting deregistered, but in most cases the process was still underway. For those who did not request to deregister, we asked why that was the case. The main reasons here were related to waiting to get a tender or other opportunities (30% and 7%, respectively), submission of documents required for deregistration but no final action taken by RRA yet
27 The survey data has been collected from a sample of 1,000 newly registered income taxpayers, both in urban and rural areas. For more information on the survey, see Mascagni et al. (2019)
(27%), or because of penalties and fear of audits (23%).28 These responses point to a
seemingly large number of ‘hopeful’ businesspeople who register with the tax authority in the hope of having opportunities that have however not yet materialised. The concept of hope emerged multiple times in our consultations with RRA. Consistently, survey data from Mascagni et al. (2019) reports that the top two reasons why businesses register with RRA in Rwanda are: to obey the law (69%) and to have better opportunities to grow (30%). Both reasons are highly consistent both with RRA’s encouragement to recruit new taxpayers and with the prevalence of hopeful businesses, both in the context of the broader government push for entrepreneurship. Most probably, the exceptionally positive GDP growth trend in Rwanda (ATAF 2018) helps explain the fact that Rwandans, mostly young people,29 start
registering with the authority as they expect a new business opportunity to arise. As we discuss in more detail below, this is also related to the government’s campaigns to encourage entrepreneurship and register new taxpayers.
5.2 Nil-filing may be an unintended consequence of RRA campaigns
The fact that so many taxpayers have registered their businesses even before having started operations may be due to a recent push towards facilitating entrepreneurship, for example through simplified registration procedures, as well as more specific campaigns run by RRA to recruit new taxpayers. In 2008, the Rwanda Development Board (RDB) introduced simplified procedures for business registration, to facilitate the creation of new businesses in Rwanda. After simplifying procedures, the time for registering a business reduced from 16 days to 6 hours. Further evidence on the reduction in the length of the registration process comes from the survey data in Mascagni et al. (2019): for 61 per cent of the sample registering took one day or less, for 83 per cent at most two days, while for 98 per cent it took a week. At the same time, the same picture emerges from the World Bank Doing Business report (World Bank 2018), according to which Rwanda ranks fifty-first worldwide and third in sub-Saharan Africa (SSA) for the ease of starting a business. Simplification in registration, with a score of 91.4, is much higher than the average for SSA, 78.5.30 Simplified procedures have been
accompanied by a wider campaign in the country, encouraging people to open businesses to reach economic self-sufficiency. New businesses were particularly encouraged to register as companies (i.e. CIT payers), which is consistent with the higher incidence of nil-filers
amongst these taxpayers. An unintended consequence of this campaign may have been to encourage the generation of businesses that may never take off or remain inactive for a long time – thus fuelling the pool of nil-filers.
Against this background, RRA has been very active in recruiting new taxpayers, many of which come from the RDB channel, sometimes quite aggressively. Mass registration campaigns are likely to rope new taxpayers into the system before they have started a profitable business. For example, under the decentralised offices or bloc management units, RRA carries out door-to-door recruitment campaigns for taxpayers. These campaigns seem to have little consideration for taxpayers’ actual ability to generate any income. Our
interviews with tax officials reveal that they are more focussed on increasing the number of taxpayers than providing any guidance to new recruits about what they should do next or why they were registered. For example, when new taxpayers are registered for income tax,
28 In order to deregister from the authority, a taxpayer has to clear all outstanding liabilities and pay any remaining penalties.
29 Over 50% of the population of Rwanda was between 15 and 54 years of age in 2018. It also results that the nil-filers in the survey sample of Mascagni et al. (2019) are about 3 years younger than active taxpayers, 32.9 versus 35.6. The difference is highly statistically significant.
30 According to World Bank (2018), online company registration has become mandatory as of 17 February 2014. It is free of charge. Entrepreneurs need to check the uniqueness of their company name first, then they can submit the company documents and obtain an electronic copy of the registration certificate online, as well as an electronic copy of their notification on tax duties and obligations. The dossier is subsequently transferred to the RRA and all relevant entities' representatives to assign the new company with identification numbers.