Universidade de São Paulo
2016-10
Network construction and applications for
semi-supervised learning
Conference on Graphics, Patterns and Images, XXIX; Workshop of Theses and Dissertations, 2016,
São José dos Campos.
http://www.producao.usp.br/handle/BDPI/51047
Downloaded from: Biblioteca Digital da Produção Intelectual - BDPI, Universidade de São Paulo
Biblioteca Digital da Produção Intelectual - BDPI
Network Construction and Applications for
Semi-Supervised Learning
Lilian Berton, Alneu de Andrade Lopes
Department of Computer Science - ICMC - University of S˜ao Paulo C.P. 668, CEP 13560-970, S˜ao Carlos, SP, Brazil
Email:{lberton,alneu}@icmc.usp.br
Abstract—The influence of network construction on graph-based semi-supervised learning (SSL) and their related appli-cations have only received limited study despite its critical impact on accuracy. We introduce four variants for network construction for SSL that adopt different network topology: 1) S-kNN (Sequentialk-Nearest Neighbors) that generates regular networks; 2) GBILI (Graph Based on the informativeness of Labeled Instances) and 3) RGCLI (Robust Graph that Considers Labeled Instances), which exploit the labels available generating scale-free networks; 4) GBLP (Graph Based on Link Prediction), which are based on link prediction measures and creates small-world networks. Comprehensive experimental results using sev-eral benchmark datasets show that it can achieve or outperform existing state-of-the-art results. Furthermore, it is confirmed to be more effective in running time.
I. INTRODUCTION1
Graph-based methods have been used in a lot of appli-cations, such as protein classification [12], data clustering [8], video recommendation [1], etc. Furthermore, the graph-based methods have a strong theoretical basis [2]. Graph-based methods operate on a network2 represented by G =
(V, E, W) where V is a set of vertices that correspond to the data instance. E is a set of edges that correspond to the similarity between pair of vertices and the edges can be weighted generating the weight matrixW. The graph on which learning is performed is a key part of any graph-based learning method, however, the literature lacks comprehensive studies that show the influence that graph construction methods have in classification performance and how the topology of graph acts on the graph-based algorithms.
In most of the real-world domains, the data has a natural structure in a network format, which describes a similarity relationship between the elements. Examples of real networks are social networks, information networks, biological networks and technological networks. Graph-based methods are a natu-ral fit in these domains. However, for a lot of learning tasks, the data instances are assumed to be independent and identically distributed (i.i.d.). In such cases, there is no explicit graph structure to start with. To apply algorithms based on graphs on these i.i.d. data it is necessary to construct a network in the first step and to apply one of the graph-based learning algorithm on the constructed graph in the second step.
1This work relates to a Ph.D. thesis.
2Throughout this paper, the notions of graph and network are used
inter-changeably.
The most popular method for network construction is the
k-nearest neighbors (kNN), which connects each example i
to its k nearest neighbors based on some similarity measure. [10] argue the presence of hubs (vertices with high degree) in the data space generates hubs in the kNN network which degenerates the classification accuracy. These authors propose to use mutual kNN (M-kNN) that makes fewer hubs. In the M-kNN network a vertex i connects to a neighbor j only if they belong to the mutual neighborhood. [7] argue that regular networks, in which all vertices have the same degree, are more suitable for SSL and proposed to useb-matching for generate regular networks. However, the generation of a regular network can be computationally expensive. Although many methods for network construction have been proposed, this research area is still with many open questions and deserves investigation.
Our overall objective was to analyze network construction methods from literature and develop new approaches consider-ing unexplored properties, processconsider-ing time and desirable topo-logical characteristics, especially for semi-supervised learning (SSL). Usually, a lot of unlabeled data are available with few labeled data which stimulates the use of SSL. Moreover, as the SSL requires less human effort and produces results with high accuracy, it has been an area of great interest and study. We proposed four methods for network construction with different topologies: i) S-kNN (Sequential kNN) which generates regular networks and can be applied in general contexts; ii) GBILI (Graph Based on the Informativeness of Labeled Instances) and iii) RGCLI (Robust Graph that Considers Labeled Instances), which exploit the prior labels available in SSL and generates scale-free networks. These methods can be applied to interactive tasks where we have trustful labels; iv) GBLP (Graph Based on Link Prediction), which are based on link prediction measures and generates networks with small-world properties, this approach can be used to improve an existing network.
The remainder of the paper is organized as follows: Section II presents the proposed methods for network construction; Section III reports experiments on SSL classification and applications on music genre classification, image classification and image segmentation that evidences the ability of the proposed methods in different scenarios; Section IV sum-marizes the concluding remarks and Section V presents the publications generated trhough the Ph.D.
II. PROPOSED METHODS FOR NETWORK CONSTRUCTION
This section presents a summary of the proposed methods for graph construction. Section II-A presents the Sequential
kNN (S-kNN) [14]. Section II-B present the methods Graph Based on the Informativeness of Labeled Instances(GBILI) [3] andRobust Graph that Considers Labeled Instances(RGCLI), respectively. Section II-C presents the Graph Based on Link Prediction(GBLP) [4].
A. Sequential k-Nearest Neighbor
The k-nearest neighbors (kNN) is the most employed method to construct the network [5] however, it may return graphs in which the vertices have more than k neighbors. In the supervised context, the nearest neighbor classification does not work properly in multi-dimensional spaces. Some authors argue this is due to the existence of points near many other points in space, these points are called hubs. This argument can be extended to graphs and a hub in the data space will result in a hub in thekNN network, which can deteriorate the classifica-tion accuracy [10]. To generate regular networks, [7] proposed a strategy called b-matching, which ensures that all vertices have b neighbors. Some authors point out a regular network gets better results, however, the construction of a b-matching network is computationally expensive and impractical for large databases [10]. As an alternative to theb-matching method, we proposed a new method for the construction of almost regular networks, i.e., the network is not total regular but approaches one. The method is called Sequential kNN (S-kNN) [14].
S-kNN connects nearest neighbors sequentially, fromk = 1to a maximum pre-defined valuekmax. The vertices are selected
to establish a connection by the inverse of closeness measure. It is has less computational time thanb-matching and achieves good accuracy in the experiments.
B. Graph Based on the Informativeness of Labeled Instances Most methods for network construction in SSL does not use the labels information on the network construction step. As the labeled data is a prior information and can also be useful to improve the network construction, we propose a method that considers the labeled data. This method is called Graph Based on the Informativeness of Labeled Instances (GBILI) [3]. In GBILI, each vertex establishes only one connection to akmutual neighbor, so the time complexity is quadratic. This connection prioritizes a vertex that is closer to a labeled vertex. The labeled vertices become hubs, especially when the value of k increases. GBILI presents the following advantages: i) the GBILI method has good accuracy in SSL classification, achieving better results than kNN, moreover GBILI is stable withk >10; ii) when the parameterkincreases, the number of edges connecting vertices with different labels also increases in the kNN networks, resulting in wrong label propagation, which does not happens in GBILI, since its average degree is always close to 2; iii) GBILI method turns the prior labeled vertices into hubs that facilitates the label propagation process, however the prior labels need to be trustful. The network
topology is similar to a scale-free network, where few vertices have high degree and most vertices have small degree.
Although the method GBILI be efficient for the SSL classi-fication it has a limitation on the time complexity, which may restrict its use in large databases. For example, an image with
320×480 size has 153600 pixels. If each pixel represents a vertex and a 10NN network is created, this result into a network with more than1,5×106 edges. Based on this, we
developed an optimized version of GBILI algorithm, called Robust Graph that Considers Labeled Instances(RGCLI) that has O(nklogn) time execution. It has been proven mathe-matically that GBILI and RGCLI methods follow the SSL assumptions. Furthermore, RGCLI was applied in interactive image segmentation and the method performs better segmen-tation that kNN since it uses the prior labeled vertices for network construction.
C. Graph Based on Link Prediction
Link prediction (LP) has been used in various relational domains to predict which elements are related to each other and which can be the type of these relations. The structure of links in a network has been used, for example, to classify the importance of documents in scientific publications and to predict future friendships in social networks. Few studies use LP for network construction in the classification context. We consider LP as a mechanism to evolve a sparse initial network and proposed the method Graph Based on Link Prediction(GBLP) [4]. Initially, a basic structure and sparse network is built from a traditional method, such as kNN, mutual kNN (M-kNN), minimum and maximum spanning tree (Min/MaxST). From this network, LP measures, such as common neighbors (c), weighted common neighbors (w) and Katz (k) are calculated estimating new edges in the network. So, the final network has a topology next to small-world networks, with high clustering coefficient and average of the shortest path relatively low. SSL classification obtained a better accuracy when LP networks are considered compared to the methodskNN, M-kNN and Min/MaxST.
III. EXPERIMENTAL RESULTS
This section presents the evaluation of the proposed meth-ods. Section III-A presents the application of S-kNN in music genre classification. Section III-B presents the application of GBILI method on image classification. Section III-C presents the result of RGCLI on image segmentation. Finally, the Section III-D presents the application of GBLP method on image classification.
A. S-kNN applied on music genre classification
We proposed to use relational classifiers algorithms for music genre classification [13] and evaluate the S-kNN method for the network construction task. The collection of songs considered consists of 919 audio tracks in MIDI format classified into four genres: classical, Brazilian sertanejo, jazz and pop rock. The classes are unbalanced, as can be seen in Table I.
TABLE I
MUSIC GENRE DATASET[13]. Genre No of tracks classic 31 sertanejo 243 pop rock 550 jazz 95 Total 919
We explored three music characteristics: moments measured by the Euclidean distance, histogram and structure measured by dynamic time warping (DTW) function. After we extracted the musical features three types of networks was considered:
kNN, M-kNN and S-kNN. For each technique, the param-eter k was ranged between 1 and 15. For the classification process, we applied traditional and relational approaches. Traditional algorithms were: decision tree (J48), Naive Bayes (NB), multilayer perceptron with backpropagation (MLP) and support vector machine (SMO) available in Weka with the standard configuration. Relational classifiers algorithms used were weighted-vote-relational-neighbor (wvrn), network-only-Bayes (no-network-only-Bayes), probabilistic-relational-neighbor (prn) and network-only-link-based (no-lb) available in Netkit-SRLwith standard configuration. For classifiers network-only-link-based was used: mode-link (in-lb-mode), count-link (no-lb-count), binary-link binary) and class-distribution-link (no-lb-distrib). In all cases, we used10-fold cross validation.
To evaluate the results we considered the AUC (area under the receiver operating characteristic curve). Table II contains the average AUC for traditional classifiers, and Tables III con-tains the average AUC for the relational classifiers considering
kNN, M-kNN and S-kNN networks respectively. In all tables, the best results for each classifier appears in bold.
TABLE II
AUCFOR TRADICIONAL CLASSIFIERS[13].
J48 NB MLP SMO
histogram 0.62 0.60 0.66 0.50 moments 0.70 0.75 0.77 0.58 structure 0.73 0.92 0.81 0.72
About the music characteristics, all classifiers got a better result on the structure. To determine the better classifier we run the Nemenyi post-hoc test [6] considering the two best traditional (MLP and NB) and the two best relational classifiers (no-lb-distrib e wrn) applied on S-kNN networks. According to the Nemenyi statistics, the critical value for comparing the average ranking of two different algorithms at 95 percentile is 2.71. The analysis is shown in Figure 1. The critical difference (CD) is on the top, and the average ranks of measures are at the axis of the diagram. The lowest (best) ranks are on the left side, where we note that relational classifiers are better ranked. The methods analyzed have no significant difference, therefore, they are connected by a black line in the diagram.
TABLE III
AUCFOR RELATIONAL CLASSIFIERS CONSIDERINGkNN, M-kNNAND S-kNNNETWORKS[13]. Feature Method kNN M-kNN S-kNN histogram no-lb-mode 0.57 0.62 0.61 no-lb-count 0.72 0.71 0.72 no-lb-binary 0.62 0.62 0.61 no-lb-distrib 0.71 0.73 0.73 wvrn 0.71 0.72 0.73 no-Bayes 0.51 0.55 0.54 prn 0.53 0.57 0.55 moments no-lb-mode 0.54 0.57 0.57 no-lb-count 0.63 0.65 0.65 no-lb-binary 0.57 0.59 0.57 no-lb-distrib 0.64 0.63 0.62 wvrn 0.64 0.63 0.62 no-Bayes 0.56 0.58 0.56 prn 0.57 0.57 0.56 structure no-lb-mode 0.83 0.86 0.90 no-lb-count 0.94 0.95 0.95 no-lb-binary 0.85 0.82 0.82 no-lb-distrib 0.94 0.96 0.96 wvrn 0.93 0.96 0.96 no-Bayes 0.92 0.91 0.92 prn 0.90 0.90 0.90
To determine the better method for graph construction, we also applied the Nemenyi post-hoc test. According to the Nemenyi statistics, the critical value for comparing the average ranking of two different algorithms at 95 percentile is 1.25. The analysis is shown in Figure 2. The methods analyzed have no significant difference, however, S-kNN is better ranked.
Fig. 1. Comparison of best results from traditional and relational classifiers applied to music genre classification with the Nemenyi test [13].
Fig. 2. Comparison ofkNN, M-kNN and S-kNN networks applied to music genre classification with the Nemenyi test [13].
B. GBILI evaluation
To evaluate the GBILI method, we apply it in SSL classifica-tion on datasets from Figure 3. The first three were artificially created in order to relate the performance of the algorithms to SSL assumptions. The other two datasets were derived from real data. To prevent the experimenters from using domain knowledge Chapelle [5] obscure structure in the data (e.g. by shuffling the pixels in the images). Also, the datasets have the
(a) (b)
(c) (d)
Fig. 3. Chapelle datasets [5]: (a) g241c e g241n. (b) digit1. (c) coil. (d) USPS.
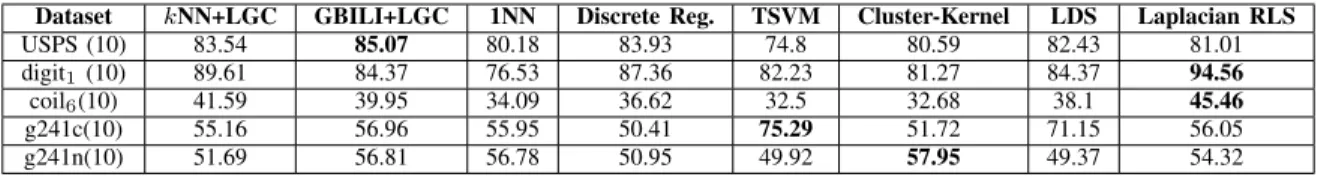
TABLE IV
AVERAGE ACCURACY FORkNN+LGCANDGBILI+LGCCOMPARED TO OTHER CLASSIFIERS[3].
Dataset kNN+LGC GBILI+LGC 1NN Discrete Reg. TSVM Cluster-Kernel LDS Laplacian RLS
USPS (10) 83.54 85.07 80.18 83.93 74.8 80.59 82.43 81.01 digit1(10) 89.61 84.37 76.53 87.36 82.23 81.27 84.37 94.56
coil6(10) 41.59 39.95 34.09 36.62 32.5 32.68 38.1 45.46
g241c(10) 55.16 56.96 55.95 50.41 75.29 51.72 71.15 56.05 g241n(10) 51.69 56.81 56.78 50.95 49.92 57.95 49.37 54.32
same number of dimensions (241) and points (1500) in the same attempt to obscure the origin of the data and in order to increase the comparability of the results.
The results are showed on Table IV. We compared the results with kNN network construction method and others literature methods presented by [5]: 1NN, Discrete Reg., Transductive SVM, Cluster Kernel, Low-Density Separation (LDS), Laplacian Regularized Least Squares (RLS). The first column in this table are the datasets and the number of labeled examples considered, the subsequent columns are the results of each classification method. Classification experiments for
kNN and GBILI combined with Local and Global Consistency (LGC) [15] were executed 30 times for each k, and this parameter values were ranged from 1 to50.
We also run the Nemenyi post-hoc test [6] to verify if it is possible to detect significant differences among algorithms from the results of Table IV. According to the Nemenyi statistics, the critical value for comparing the average ranking of two different algorithms at 95 percentile is 2.36. The analysis is shown in Figure 4. The methods analyzed have no significant difference, therefore, they are connected by a black line in the diagram. GBILI is better ranked.
C. RGCLI evaluation
Sometimes a segmentation strategy needs to be developed in such a way that allows users to specify what they want. In this case, we have a semi-automatic and interactive image segmentation, in which some pixels of each object are marked
Fig. 4. Comparison of all classifiers against each other with the Nemenyi test.
by the user and an algorithm classify other pixels. We applied the RGCLI in interactive image segmentation and verified the method performs better segmentation compared to kNN that does not use the labels in the construction of networks.
The datasets used are images of Berkeley Segmentation Dataset [9] whose size is320×480, which generates a network with153600vertices. From the image, the user provides some labeled vertices by selecting the objects to be recognized. The RGCLI,kNN and M-kNN methods were used to construct a network from an image. For the construction of RGCLI net-work,ke= 500(number ofkNN neighbors) was used because
high values of ke favor a better choice of connections. We
ranged the parameterki (number of connections established)
from 5 to 50, adding 5. To construct the kNN network we ranged the parameterkfrom10to500, adding10. After that, the algorithm Community Label Propagation (PLC) [11] was used to spread the labels and segment the images.
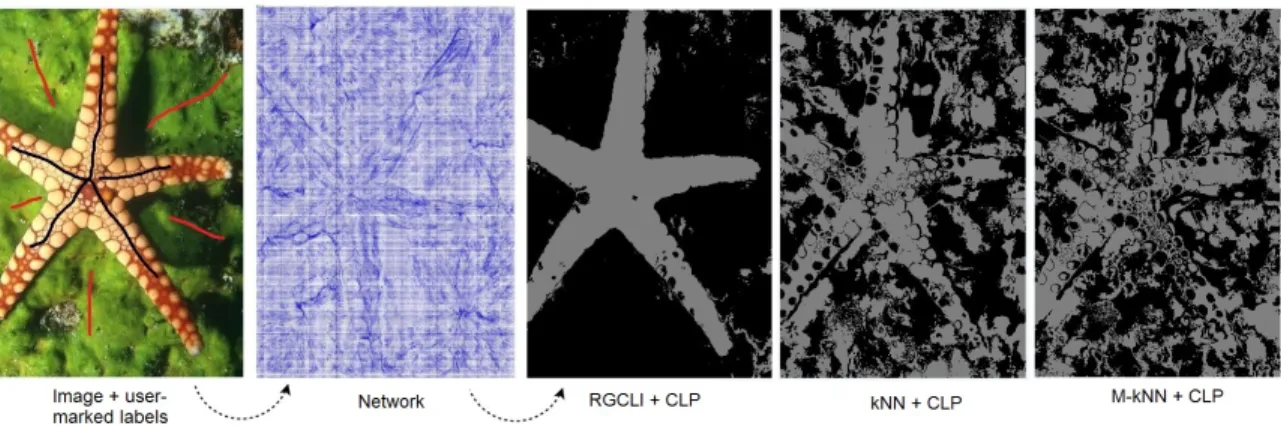
Fig. 5. Image segmentation process and the result of apply GBILI,kNN and M-kNN network construction.
The process are showed in Figure 5. The RGCLI result is a good delineation of the image for any value ofki considered.
However, regardless of the value tested in thekfor kNN and M-kNN methods, it was not possible to separate the objects. These results indicate that the network plays a key role in SSL classification, and a network that uses the prior labeled vertices can perform better in interactive tasks.
D. GBLP evaluation
We also evaluated GBLP on the datasets from Figure 3. The results are shown in Table V. In the first column are the datasets considered, in the second column are the methods for graph construction and in the third and fourth columns, respectively, are the classification results using 10 and 100
labeled vertices, besides a parameter (in brackets). For kNN and M-kNN this parameter is the number of neighbors k
(1. . .20). For our proposal, the parameter is the value of
k (1, . . . ,5), the method of LP used (c, w or k) and the percentage of top links selected (10, . . . ,100). The highest accuracy for each labeled configuration in each dataset is in bold. The LP networks improve the accuracy especially when few labeled points are considered, in this case, less than 1%. From Table V, the Nemenyi post-hoc test [6] was executed to verify the possibility of detecting differences among the network construction methods. The results are shown in Figure 6. According to the Nemenyi statistics, the critical value for comparing the average ranking of two different algorithms at 95 percentile is 3.32. Note that all methods improved the accuracy when combined with LP measures except M-kNN.
Fig. 6. Comparison ofkNN, M-kNN, MinST, MaxST and GBLP networks against each other with the Nemenyi test [4].
TABLE V
SEMI-SUPERVISED CLASSIFICATION RESULTS FORGBLP [4].
BD Method LGC(10) LGC(100) g241c kNN 0.54 (1) 0.58 (1) M-kNN 0.51 (4) 0.60 (2) MinST 0.50 0.50 MaxST 0.50 0.50 kNN+LP 0.58 (1, c-10) 0.59 (1, c-40) M-kNN+LP 0.57 (2, k-50) 0.62 (2, c-40) MinST+LP 0.53 (c-40) 0.59 (c-40) MaxST+LP 0.51 (c-60) 0.53 (c-70) g241n kNN 0.52 (4) 0.57 (4) M-kNN 0.51 (11) 0.57 (12) MinST 0.50 0.50 MaxST 0.50 0.50 kNN+LP 0.52 (4, c-10) 0.57 (1, c-20) M-kNN+LP 0.51 (5, c-10) 0.54 (5, c-30) MinST+LP 0.51 (k-70) 0.57 (c-10) MaxST+LP 0.50 (c-60) 0.50 (c-90) digit1 kNN 0.89 (3) 0.97 (4) M-kNN 0.89 (7) 0.97 (10) MinST 0.50 0.50 MaxST 0.50 0.50 kNN+LP 0.90 (3, k-10) 0.96 (5, w-30) M-kNN+LP 0.90 (5, c-40) 0.95 (5, w-60) MinST+LP 0.91 (w-40) 0.94 (w-50) MaxST+LP 0.59 (c-90) 0.71 (w-80) USPS kNN 0.84 (3) 0.89 (2) M-kNN 0.84 (12) 0.91 (9) MinST 0.71 0.74 MaxST 0.71 0.65 kNN+LP 0.84 (3, k-10) 0.89 (2, c-20) M-kNN+LP 0.80 (5, w-80) 0.90 (5, w-60) MinST+LP 0.84 (k-20) 0.93 (w-50) MaxST+LP 0.79 (c-80) 0.80 (c-70) coil2 kNN 0.65 (3) 0.97 (3) M-kNN 0.65 (7) 0.96 (7) MinST 0.50 0.50 MaxST 0.50 0.50 kNN+LP 0.68 (5, k-60) 0.95 (3, w-80) M-kNN+LP 0.65 (5, k-90) 0.95 (5, c-30) MinST+LP 0.64 (w-80) 0.90 (w-60) MaxST+LP 0.52 (c-90) 0.56 (c-100) IV. CONCLUSION
Many techniques for graph-based SSL have been proposed, however, studies about the influence of the network in such al-gorithms as well as new techniques for networks construction, have still received little attention. We investigated these
as-pects and proposed four new network construction techniques especially for SSL. The proposed methods have quadratic or less time complexity and explored different graph topologies, such as regular, scale-free and small-world. Moreover, we apply the networks in various contexts, such as music genre classification, image classification and image segmentation and the SSL accuracy was improved. Each proposed method is indicated for a different scenario: S-kNN can be applied in general contexts, while GBILI and RGCLI can be applied to interactive tasks where we have trustful labels and GBLP can be used to improve an existing network.
V. PUBLICATIONS
The generated and submitted publications throughout the Lilian Berton (Berton, L.) Ph.D. are presented below.
1) Berton, L.; Vega-Oliveros, D.; Rodrigues, F. A. e Lopes A. A.
Robustness analysis of graph construction methods for semi-supervised learning. ACM TKDD. (under review).
2) Berton, L.; Faleiros, T. P.; Valejo, A.; Valverde-Rebaza J. e Lopes, A. A.RGCLI: Robust Graph that Considers Labeled Instances. Neurocomputing. (under review).
3) Berton, L. e Lopes, A. A. Neighborhood Graph Construction for Semi-Supervised Learning. AI MATTERS, may 2016, v. 2, n. 3, to appear.
4) Berton, L. e Lopes, A. A. Graph construction for semi-supervised learning. In Doctoral Consortium. International Joint Conference on Artificial Intelligence (IJCAI 2015), pp. 4343-4344. Buenos Aires, Argentina 2015.
5) Berton, L., Valverde-Rebaza, J. e Lopes, A. A. Link predic-tion in graph construcpredic-tion for supervised and semi-supervised learning. In Proceedings of The International Joint Conference on Neural Networks (IJCNN 2015), pp. 1-8. Killarney, Ireland 2015.
6) Berton, L. e Lopes, A. A. Graph Construction Based on Labeled Instances for Semi-Supervised Learning. In Proceed-ings of International Conference on Pattern Recognition (ICPR 2015), pp. 2477-2482, Stockholm, Sweden 2014.
7) Valverde-Rebaza, J.; Valejo, A.; Berton, L.; Faleiros, T. P. e Lopes, A. A.A na¨ıve bayes model based on overlapping groups for link prediction in online social networks. In Proceedings of The 30th ACM/SIGAPP Symposium On Applied Computing (SAC 2015), pp. 1136-1141. Salamanca, Spain, 2015. 8) Vega-Oliveros, D.; Berton, L.; Lopes, A. A. e Rodrigues, F.
Influence maximization based on the least influential spreaders. In Workshop on Social Influence Analysis (SocInf 2015). International Joint Conference on Artificial Intelligence (IJCAI 2015), pp. 03-08. Buenos Aires, Argentina 2015.
9) Vega-Oliveros, D. e Berton, L. Spreader Selection by Com-munity to Maximize Information Diffusion in Social Networks. In Track on Web and Text Intelligence (WTI 2015). Interna-tional Symposium on Information Management and Big Data (SIMBig 2015), pp. 73-82. Cusco, Peru 2015.
10) Valverde-Rebaza, J.; Soriano, A.; Berton, L.; Oliveira, M. C. F. e Lopes, A. A.Music genre classification using traditional and relational approaches. In Proceedings of 2014 Brazillian Conference on Intelligent Systems (BRACIS 2014), pp. 259-264. Sao Carlos, Brazil 2014.
11) Vega-Oliveros, D.; Berton, L.; Eberle, A. M.; Lopes, A. A. e Zhao, L. Regular Graph Construction for Semi-supervised Learning. Journal of Physics: Conference Series (Online), 490, pp. 012022-1-012022-4, 2014.
12) Assirati, L.; Silva, N. R.; Berton, L.; Lopes, A. A. e Bruno, O. M.Performing edge detection by Difference of Gaussians using q-Gaussian kernels. Journal of Physics. Conference Series (Online), v. 490, pp. 012020-1-012020-4, 2014.
13) Berton, L. e Lopes, A. A. Informativity-based Graph: Ex-ploring Mutual kNN and Labeled Vertices for Semi-supervised Learning. In Proceedings of Fourth International Conference on Computational Aspects of Social Networks (CASoN 2012), pp. 14-19. Sao Carlos, Brazil 2012.
14) Llerena, N. E. M; Berton, L. e Lopes, A. A. Graph-based Cross-validated Committees Ensembles. In Proceedings of Fourth International Conference on Computational Aspects of Social Networks (CASoN 2012), pp. 75-80, Sao Carlos, Brazil 2012.
15) Faleiros, T. P.; Berton, L. e Lopes, A. A. Exploring Data Classification with K-associated Network. In: 4th International Workshop on Web and Text Intelligence (WTI 2012), Curitiba, Brazil, 2012.
ACKNOWLEDGMENT
This research was partially supported by S˜ao Paulo Research Foundation (FAPESP) grant:2011/21880−3.
REFERENCES
[1] S. Baluja, R. Seth, D. Sivakumar, Y. Jing, J. Yagnik, S. Kumar, D. Ravichandran, and M. Aly, “Video suggestion and discovery for youtube: Taking random walks through the view graph,” in 17th In-ternational Conference on World Wide Web, 2008, pp. 895–904. [2] M. Belkin, P. Niyogi, and V. Sindhwani, “Manifold regularization: A
geometric framework for learning from labeled and unlabeled examples,” Journal of Machine Learning Research, vol. 7, pp. 2399–2434, 2006. [3] L. Berton and A. de Andrade Lopes, “Graph construction based on
labeled instances for semi-supervised learning,” in22nd International Conference on Pattern Recognition, 2014, pp. 2477–2482.
[4] L. Berton, J. Valverde-Rebaza, and A. de Andrade Lopes, “Link predic-tion in graph construcpredic-tion for supervised and semi-supervised learning,” inInternational Joint Conference on Neural Networks, 2015, pp. 1–8. [5] O. Chapelle, B. Schlkopf, and A. Zien, Semi-Supervised Learning,
1st ed. The MIT Press, 2010.
[6] J. Demsar, “Statistical comparisons of classifiers over multiple data sets,” Journal of Machine Learning Research, vol. 7, pp. 1–30, 2006. [7] T. Jebara, J. Wang, and S.-F. Chang, “Graph construction and b-matching
for semi-supervised learning,” in26th Annual International Conference on Machine Learning, 2009, pp. 441–448.
[8] M. Maier, M. Hein, and U. von Luxburg, “Cluster identification in nearest-neighbor graphs.” inAlgorithmic Learning Theory, ser. Lecture Notes in Computer Science, vol. 4754. Springer, 2007, pp. 196–210. [9] D. Martin, C. Fowlkes, D. Tal, and J. Malik, “A database of human
segmented natural images and its application to evaluating segmentation algorithms and measuring ecological statistics,” in IEEE International Conference on Computer Vision, vol. 2, 2001, pp. 416–423.
[10] K. Ozaki, M. Shimbo, M. Komachi, and Y. Matsumoto, “Using the mutual k-nearest neighbor graphs for semi-supervised classification of natural language data,” in15th Conference on Computational Natural Language Learning. Association for Computational Linguistics, 2011, pp. 154–162.
[11] U. Raghavan, R. Albert, and S. Kumara, “Near linear time algorithm to detect community structures in large-scale networks,”Physical Review E, vol. 76, p. 036106, 2007.
[12] K. Tsuda, H. Shin, and B. Sch¨olkopf, “Fast protein classification with multiple networks,”Bioinformatics, vol. 21, no. 2, pp. 59–65, Jan. 2005. [13] J. C. Valverde-Rebaza, A. Soriano, L. Berton, M. C. F. de Oliveira, and A. de Andrade Lopes, “Music genre classification using traditional and relational approaches,” inBrazilian Conference on Intelligent Systems, 2014, pp. 259–264.
[14] D. A. Vega-Oliveros, L. Berton, A. M. Eberle, A. de Andrade Lopes, and L. Zhao, “Regular graph construction for semi-supervised learning,” Journal of Physics: Conference Series, vol. 490, no. 1, pp. 012 022–1– 012 022–4, 2014.
[15] D. Zhou, O. Bousquet, T. N. Lal, J. Weston, and B. Schlkopf, “Learning with local and global consistency,” Advances in Neural Information Processing Systems, vol. 16, pp. 321–328, 2004.
![Fig. 1. Comparison of best results from traditional and relational classifiers applied to music genre classification with the Nemenyi test [13].](https://thumb-us.123doks.com/thumbv2/123dok_us/9909961.2484169/4.918.470.848.623.701/comparison-results-traditional-relational-classifiers-applied-classification-nemenyi.webp)