Applying the FAHP to Improve the Performance
Evaluation Reliability of Software
Defect Classifiers
HUSSAM GHUNAIM AND JULIUS DICHTER
School of Engineering, Computer Science and Engineering Department, University of Bridgeport, Bridgeport, CT 06604, USA
Corresponding author: Hussam Ghunaim ([email protected])
ABSTRACT Today’s software complexity makes developing defect-free software almost impossible.
Consequently, developing classifiers to classify software modules into defective and non-defective before software releases have attracted great interest in academia and software industry alike. Although many classifiers have been proposed, no one has been proven superior over others. The major reason is that while a research shows that classifier A is better than classifier B, we can find other research that shows the opposite. These conflicts are usually triggered when researchers report results using their preferable performance evaluation measures such as, recall and precision. Although this approach is valid, it does not examine all possible facets of classifiers performance characteristics. Thus, the performance evaluation might improve or deteriorate if researchers choose other performance measures. As a result, software developers usually struggle to select the most suitable classifier to use in their projects. The goal of this paper is to apply the fuzzy analytical hierarchy process (FAHP) as a popular multicriteria decision-making technique to reliably evaluate classifiers’ performance. This evaluation framework incorporates a wider spectrum of performance measures to evaluate classifiers performance rather than relying on selected preferable measures. The results show that this approach will increase software developers’ confidence in research outcomes and help them in avoiding false conclusions and infer reasonable boundaries for them. We exploited 22 popular performance measures and 11 software defect classifiers. The analysis was carried out using KNIME data mining platform and 12 software defect data sets provided by the NASA metrics data program (MDP) repository.
INDEX TERMS Classifiers, data mining, empirical software engineering (ESE), FAHP, KNIME, perfor-mance evaluation, software defect.
I. INTRODUCTION
Software defects are a serious threat to the success of software development industry [1]. In average, billions of dollars are lost every year because of software defects in the United States alone [2], where the global loss is much larger than this amount. Although defects can be detected by various quality procedures, finding and fixing defects consume a sig-nificant portion of the available resources [3]. Most software defects are normally found within a relatively small number of modules [4], [5]. Therefore, developing software defect classifiers has become a promising methodology to iden-tify defective modules before software release. The expected returns are significant in terms of reducing the overall quality assurance activities time and costs [1], [6].
The associate editor coordinating the review of this manuscript and approving it for publication was Vijay Mago.
The major aim of software defect classifiers is to classify software modules into defectivedMand non-defectivendM. This binary classification can be described as a mapping function from a vectorxofMfeatures, wherexi∈RM, to one
of the classification classesyi∈ {dM, ndM}[4].
f (x):RM 7→ {dM, ndM} (1) This model can be trained by a training data set S of N instances,
S = {(xi, yi)}Ni=1. (2)
Numerous techniques have been proposed to develop classi-fiers, for instance, regression and logistic regression, neural networks, decision trees, and many other machine learn-ing algorithms [4], [7] with no superiority of any over the rest [3], [8]. This is mainly caused by conflicted bench-marking studies. Various software engineering research
papers [1], [3], [9], [10] investigated and challenged the reli-ability of software defect classifiers benchmarking studies. The common finding among these studies was that while one-study showed classifier A was better than classifier B, we could find other studies that showed exactly the opposite. Consequently, software practitioners face the problem of how they can reliably evaluate the performance of defect clas-sifiers to select the best performing classifier out of several others [11]. Although there are many performance evaluation measures, they usually provide contradicting results. This contradiction is indeed expected as each of these measures was developed to capture a specific aspect of classifiers’ performance. For example, recall, which is known as True Positive Rate (TPR), represents the proportion of the actual defective modules that are classified defective. Similarly, precision, which is known as Positive Predictive Value (PPV), represents the proportion of classified defective modules that are actually defective [3], [12], and so forth. As a result, the performance quality is highly dependent on the specific measures being utilized!
This fact leads to the critical question; which perfor-mance evaluation measure(s) practitioners should use? In other words, how practitioners can evaluate classifiers in such a way that they will always get reliable and valid results? This essential requirement is motivated by two possible sce-narios. Mistakenly classifying defective modules as non-defective raises the risk of software failure. While classifying non-defective modules as defective raises software quality assurance activities time and costs. We believe that the pro-posed evaluation framework will increase the reliability and researchers’ confidence in the classifiers’ evaluation process outcomes.
This paper is organized as follows, related work Section discusses the problem of classifiers’ evaluation reli-ability and its implications on software development indus-try. Section III discusses the principles of Fuzzy Analytical Hierarchy Process (FAHP). The classifiers’ performance evaluation measures implemented in this research are pre-sented and explained in Section IV. In data sets Section, we describe several data quality issues that exist in NASA data sets and the cleaning procedures that are performed. In experimental setup design Section, we discuss how the experiments and analysis are performed while Section VII, the FAHP Application, describes in detail how we applied FAHP to the classifiers’ performance evaluation. The results Section discusses the paper results and conclusion Section summarizes the conclusions.
II. RELATED WORK
The reliability of software defect classifiers was scrutinized extensively in many published works [8], [11], [13], [14], [15]. Nonetheless, it seems that there is a large room for improvements. For example, performance quality measures, such as, precision, accuracy, etc. can be improved by apply-ing rigorous reliability and verification techniques [8], [11]. Additionally, many of these measures are borrowed from
other disciplines (e.g. Psychology and social sciences). In many cases when these measures are used ‘as is’, they usually have different implications [12].
It has become a common practice for practitioners and researchers to select their most preferable statistics to sup-port their point of view. Consequently, vague and misleading conclusions might result. Forman and Scholz [16] concluded in their study that comparing different research studies has become complicated, and in many cases, the comparisons have become not meaningful.
This paper emphasizes the fact that performance eval-uation must be seen as a comprehensive strategy rather than relying on preferably selected performance measure(s). Shepperdet al.[3] conducted an extensive study to find the reasons of variance in classifiers performance. Their study included 600 experimental results published in many rep-utable conferences and journals with low acceptance rates. Surprisingly, researcher bias was among the major and wide-spread influential factors. They found that it is extremely difficult to choose the best performing classification tech-nique because of this phenomenon.
To solve the problem of researchers’ bias, Inseet al.[17] asserted that researchers should improve their research out-comes reporting protocols. Kitchenham [18] also suggested the need to enhance the communication and documentation protocols to include sufficient explicit details about how exactly classifiers were used and evaluated in research.
Fenton and Bieman [19] extensively discussed the con-cept of research reliability. In general, he emphasized the empirical validity procedures where researchers are required to validate their findings by replications of experiments. Empirical validation studies have become an essential part in software defect classification research because usually we lack the required theoretical validation. This fact has led us to our paper contribution which is proposing a comprehensive evaluation scheme that will provide proven better evalua-tion outcomes compared to preferred selected performance measure(s).
III. FUZZY ANALYTICAL HIERARCHY PROCESS (FAHP) To avoid the researchers’ bias when evaluating the perfor-mance of software defect classifiers, this paper proposes the application of multicriteria decision making (MCDM). MCDM is a set of very effective methodological tools for dealing with complex problems in various domains, such as, business, engineering, etc. Some examples are, AHP, FAHP, TOPSIS, and many others [20]–[22].
The Analytical Hierarchy Process AHP technique is based on expert judgment method to perform pairwise comparisons between all implemented criteria. However, AHP suffers from a critical criticism. AHP is unable to deal with the impression and subjectiveness of the expert judgment when performing the pairwise comparisons method [23]–[25].
In recent years, Fuzzy AHP–or for short, FAHP–gained a noticeable attention as a superior substitute to the AHP technique. The essence of FAHP method is based on the
FIGURE 1. Membership functions used in FAHP.
ability to capture the uncertainty when performing expert judgment method. Zadeh [26] introduced the fuzzy set theory to compromise the human thought vagueness, which was oriented to the rationality of uncertainty due to imprecision or vagueness. That is, the consideration of the gradual mem-bership of an element to a particular set of elements [23].
Peng [27] and Kabir and Hasin [28] applied AHP success-fully in the field of classifiers performance evaluation. In this paper, the authors apply FAHP in evaluating binary classifiers performance as a more robust multicriteria procedure. Up to our knowledge, this is the first time of such application.
In 1983, Laarhoven, et al. proposed the use of a triangular fuzzy membership function as the best fit in performing expert judgment, Fig (1.a) [29]. Other functions were pro-posed as well to fit various uses, Fig (1.b and 1.c). We chose to use the triangular membership method for its suitability to software defect classifiers domain, Equation (3). The reason for this choice is that we need only to provide two boundaries to our judgment, upper and lower boundaries when com-paring measures pairwise. Trapezoidal function for example provides two middle values in addition to the upper and lower boundaries. The is not the case in our research. Similar arguments are applicable to other fuzzy membership func-tions that might require unnecessary complicafunc-tions. Thus, for simplicity, we made this choice.
µ(x|Me)= 0, x<l (x−l)/(m−l), l≤x≤m (u−x)/(u−m), m≤x≤u 0, x>u (3)
Throughout this paper, fuzzy quantities are differentiated by placing a tilde ‘∼’ above symbols. A triangular fuzzy num-ber (TFN) is denoted as(l,m,u), whereldenotes the smallest possible value, mdenotes the most promising value, andu denotes the largest possible value that describes a fuzzy event. Readers interested in more detailed introduction to fuzzy numbers and their algebraic operations are recommended to read Hardinget al.[30].
IV. PERFORMANCE EVALUATION MEASURES
To evaluate the classifiers’ performance, we followed the common practice of using a confusion matrix, Table 1. The first column shows the actual positive(AP)cases (defective modules) and the second column shows the actual negative (AN)cases (non-defective modules). Similarly, the first row
TABLE 1.Confusion matrix.
shows the predicted positives (PP) and the second row shows the predicted negatives (PN). The bottom right cell shows the total number of cases,T. While the optimum desired results would befp=fn=0, the actual performance of classifiers is still far away from achieving this goal. By utilizing these four variables, the classifiers’ performance measures can be calculated.
Numerous performance measures have been proposed and utilized by researchers and practitioners to evaluate classi-fiers’ performance. Table 2 shows the 22 performance mea-sures exploited in our research [3], [27]–[33]. The selection of these measures was based on their popularity in software defect classification research [3], [12]. Since Cohen’s Kappa is the only measure that needs more clarifications on how to compute its probabilities (i.e. Pr(a) and Pr(e)), we added those clarifications right after the table.
V. DATA SETS
As the requirement of research replication has become vital for many researchers, we have decided to use the pub-licly available and widely used NASA software defect data sets [34]. One justifiable reason that explains this choice is to support the ability to reproduce and verify the published results, and to ease data sharing among researchers [35].
However, NASA data sets suffer from many data qual-ity problems [36]. For clarqual-ity, we repeat here the common assumptions about software data sets structure. NASA data sets are organized as a matrix of rows and columns. Each row represents one software module (i.e. case), and each column represents one feature (i.e. attribute). One of the data integrity issues that can be found in NASA data sets is the identical values. This problem occurs when two or more features have the same values for all cases. Similarly, if two or more cases have the same values for all features including the prediction label. Identical features present no additional information and identical cases confuse learners, thus, both were excluded from data sets. Conflicting values is another problem that arises whenever there is a violation of a rela-tional integrity constraint. For example, LOC_TOTAL cannot be less than LOC_EXECUTABLE or LOC_COMMENTS. Fan et al. [37] have discussed integrity constraints in more details. Such data is untrustworthy and should not be included in the data sets. Additionally, implausible values are any negative or fractional values that do not make sense and cannot be accepted. Similar to conflicting values, this data is untrustworthy. Cases’ inconsistency, constant values and missing values were among other data integrity issues that were analyzed.
TABLE 2. List of the 22 performance evaluation measures exploited in the study.
Cohen’s kappa probabilities are calculated as follows: • Pr(a) : is the observed agreement probability among
raters= tp+tn
tp+fp+tn+fn
• Pr(e) :is the agreement by chance probability among raters=R1(P)R2(P)+R1(N)R2(N)
• Rater1 percentage of positive responses
R1(P)=
tp+fp
tp+fp+tn+fn • Rater1 percentage of negative responses
R1(N)=1−R1(P)
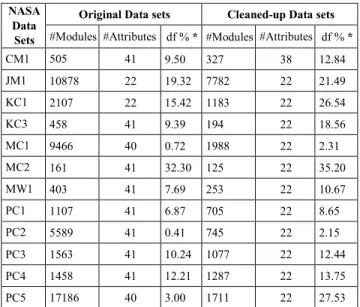
TABLE 3.Changes made to NASA data sets after applying the cleaning strategy.∗df% is the percentage of defective modules.
• Rater2 percentage of positive responses
R2(P)=
tp+fn tp+fp+tn+fn
• Rater2 percentage of negative responses R2(N)=1−R2(P)
Shepperd et al.[34] and [36] performed a comprehen-sive cleaning strategy to remove all problematic cases and features, Table 3. They published the cleaned-up data sets resulted after removing all cases and features that had one or more of the discussed data quality problems. These data sets are available online at
https://figshare.com/collections/NASA_MDP_Software_ Defects_Data_Sets/4054940/1.
VI. EXPERIMENTAL SETUP DESIGN
We exploited eleven software defect classifiers, Table 4. These classifiers have been chosen based on their popularity in software defect research [4], [38]. The experiments were carried out using KNIME [39], [40], a popular data mining platform and twelve NASA software defect data sets.
KNIME was used to run the classifiers on all experimented data sets. The corresponding confusion matrixes were con-structed and utilized to calculate the classifiers’ performance measures, that is,E[c×p] matrixes, wherecis the number of classifiers andpis the number of performance measures. To validate the results, 10-fold cross-validation technique was run on all experiments. Additionally, we normalized all experimented data sets to avoid the dominance of some attributes with large values.
Imbalanced data sets can degrade classifiers performance and contribute to the results unreliability [35], [54]. It is quite common in software defect data sets to have non-defective
TABLE 4. Software defect classifiers.
modules as the majority class while the defective modules as the minority class. Therefore, stratified sampling technique was used to avoid sampling bias. Stratified functionality guaranteed that all created cross-validation folds had class distribution similar to the original data sets distributions, i.e. the ratio of defective to non-defective modules.
For clarity, we start with presenting a summary of the FAHP steps implemented in this study followed by more detailed calculations in the following section, FAHP Appli-cation.
Note: Matrixes are denoted by italicized capital letters, and vectors are denoted by bold face italicized small letters.
Let,
c=11,cis number of classifiers,
p=22,pis number of performance measures, d data set
Dthe set of 12 NASA data sets
1) Construct the fuzzy performance measures pairwise comparisonsA[p˜ ×p] matrix.
2) Compute thecriteria fuzzy weight vectorw˜ from
˜
A matrix.
3) Compute the defuzzifiedcriteria weight vectorw.
for each d ∈ D do
4) Compute the classifiers evaluation matrixE[c×p]. 5) Compute the classifiers scoresS[c×p] matrix.
a. computepnumber ofB(j)matrixes
(classifiers pairwise comparisons) with respect to each criterionj=1, . . . ,p
b. from eachB(j), computes(j)score vector c. construct theS[c×p] matrix by combining
alls(j)vectors, column wise.
6) Compute the classifiers rankingv=S·w, whereviof the vectorvrepresents the global score
(i.e. rank) assigned by the FAHP to theithclassifier. 7) Identify the highest performing classifier compared
to the list of experimented classifiers.
end for
TABLE 5.AHP and FAHP scores interpretations.
VII. FAHP APPLICATION
The following are the FAHP implementation steps [23], [27]: Step 1:
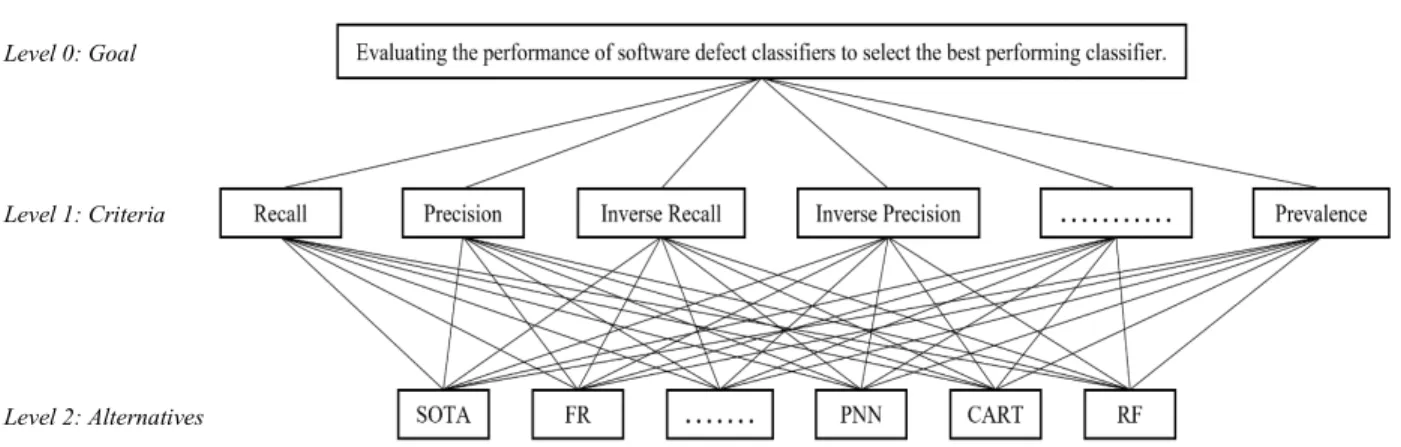
Decompose the problem into three hierarchical levels, Fig. (2).
- Goal: evaluating the performance of software defect classifiers to select the best performing classifier - Criteria: twenty-two performance measures - Alternatives: eleven software defect classifiers Step 2:
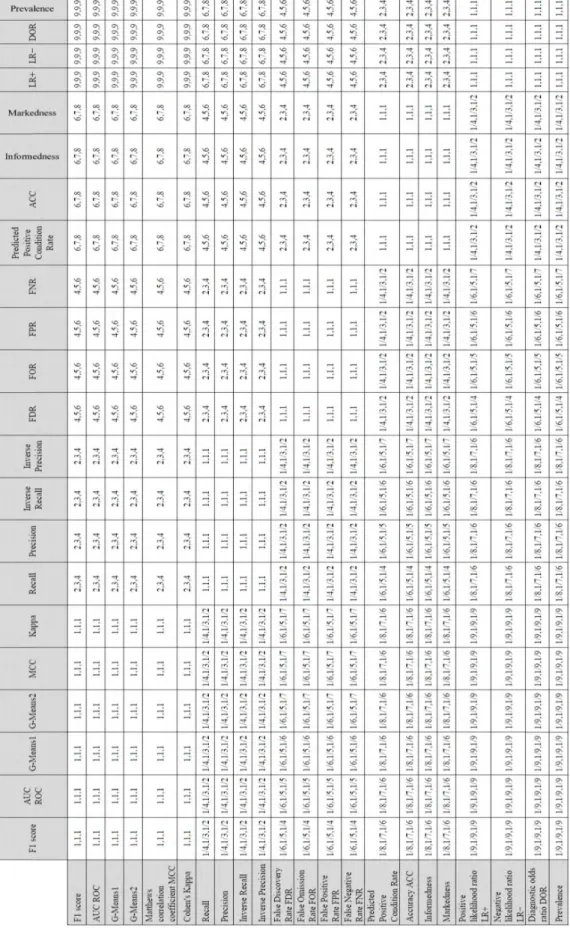
Perform fuzzy pairwise comparisons between all criteria elements using the fundamental scale proposed by Saaty [22], Table 5. At the end of this step, acriteria fuzzy weights vector
˜
wis computed. However, this scale is based on crisp eval-uation values. As discussed in Section III, crisp evaleval-uation usually leads to unreliable results due to the expert judgment uncertainty and vagueness. Thus, the scale must be modified to meet FAHP requirements. That is, instead of evaluating the criteria using the crisp scale values, we can use the Triangular Fuzzy Numbers (TFN) to compromise for human uncertainty and increase the reliability of the evaluation. Note that for any fuzzy numbera, the reciprocal can be defined as˜
˜ a−1=(l,m,u)−1= 1 u, 1 m, 1 l (4) Table 5 entries are only suggestive to translate the decision maker qualitative evaluations of the criteria into quantitative values. It is possible to use other similar scales.
The authors use their extensive experience in the field of binary classifiers evaluation measures to rank their relative importance following Saaty fundamental scale of weights. Additionally, the literature provides a large body of research to evaluate the reliability and validity of each of these measures. For brevity, a representing sample is cited in this paper [13], [33], [12]. Table 6 shows the relative fuzzy
FIGURE 2. FAHP hierarchical structure.
weights established by the authors judgments for these measures.
By assuming that we havepperformance evaluation mea-sures (i.e. criteria), we can construct the criteria pairwise
comparison matrixA˜ as follows:
˜ A[p×p]= ˜ a11 · · · a˜1k ... ... ... ˜ aj1 · · · a˜jk (5) wherej=1· · ·p&k=1· · ·p.
Every entry a˜jk represents the importance of criterion j
relative to criterionk, wherea˜jk =(1,1,1)∀j=k.
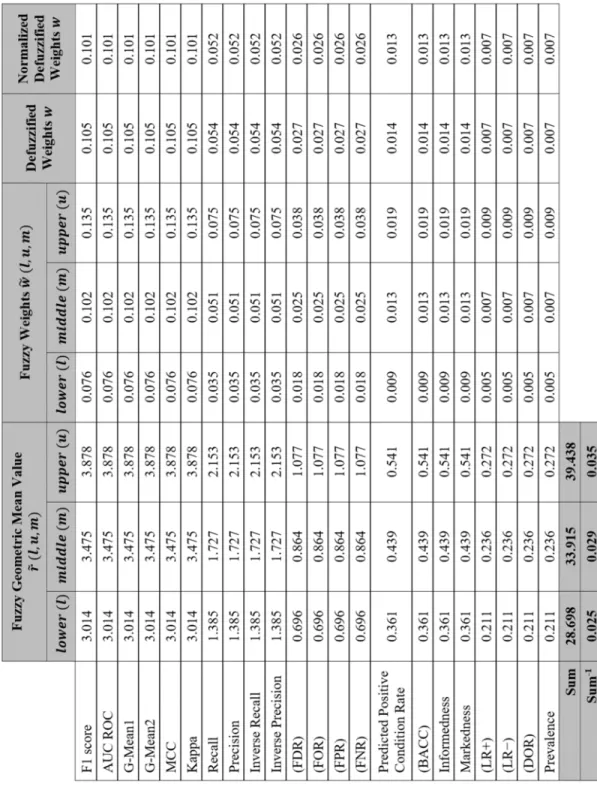
Once matrix A˜ is constructed, we can calculate the cri-teria fuzzy weights vector w˜ by applying the Geometric Mean method proposed by Buckley [55]. The method can be applied by three steps:
Firstly, we calculate the fuzzy geometric mean valuer˜jfor
each rowjinA˜j ˜ rj= Yp k=1lk 1/p ,Yp k=1mk 1/p ,Yp k=1uk 1/p ! (6) Secondly, sum all fuzzy geometric mean values column wise and find their reciprocal, r˜1⊕ ˜r2⊕ · · · ⊕ ˜rj
−1
. The multi-plication and addition of two fuzzy numbers operations are defined as, ˜ a1⊗ ˜a2=(l1,m1,u1)⊗(l2,m2,u2) =(l1×l2,m1×m2,u1×u2) (7) ˜ a1⊕ ˜a2=(l1,m1,u1)⊕(l2,m2,u2) =(l1+l2,m1+m2,u1+u2) (8)
Lastly, calculate thecriteria fuzzy weights vectorw˜,
˜
wj= ˜rj⊗ ˜r1⊕ ˜r2⊕ · · · ⊕ ˜rj
−1
(9) To ease the comparisons of classifiers’ rankings, we can defuzzify w˜ using the center of area COA concept [56], Table 7. wj= l+m+u 3 ,j=1· · ·p (10) Step 3:
Perform pairwise comparisons between all classifiers with respect to every criterion. At the end of this step, the classi-fiers scores matrixSis constructed.
S[c×p]= s11 · · · s1j ... ... ... si1 · · · sij (11) wherei=1· · ·c&j=1· · ·p.
Every entry sij of matrix S represents the score of
the ith classifier with respect to the jth criterion. To con-struct the matrix S, we have first to compute classifiers pairwise comparison B(j) matrixes with respect to every criterionj. B(j)[c×c]= b11 · · · b1h ... ... ... bi1 · · · bih (12) wherei=1· · ·c&h=1· · ·c.
Each entryb(ihj)of the matrixB(j)represents the evaluation of theithclassifier compared to thehthclassifier with respect to the jth criterion. We can compute b(ihj) by dividing the performance evaluation of classifieriover the performance evaluation of classifierh. Ifb(ihj) > 1, then the ithclassifier is better than thehth classifier, and ifb(ihj) < 1, then the ith classifier is worse than thehthclassifier. When two classifiers performances are equal, thenb(ihj)=1. MatrixBentries satisfy the following properties:
b(ihj)·b(hij)=1 andb(ihj)=1,∀i=h.
The matrix E[c ×p] entries are utilized in computing B(j)matrixes. The matrix E contains the performance eval-uation of each classifier presented by the 22-performance measures. In total we have 12E matrixes for the 12 data sets experimented. The process of computingEmatrixes is as follows:
1. Start KNIME
for each d ∈ D doBDis the set of 12 NASA data sets anddis a data set
TABLE 7. Computing the criteria weights vectorsw˜andw.
3. Run every classifier to generate its confusion matrix 4.Use the generated confusion matrix to compute
the 22-performance measures 5.Construct the correspondingE matrix
end for
Once B(j) matrixes are computed, they need to be nor-malized column wise. That is, divide each entry bih in a
particular columnhover the sum of all entries of this column,
Equation (13). This operation is repeated for all columns in matrixB(j). bih= bih Pc i=1bih (13) We use Equation (14) to find the scores vectors(j)that con-tains the classifiers’ pairwise comparisons scores with respect to every criterionj. The c-dimension column vector s(j) is
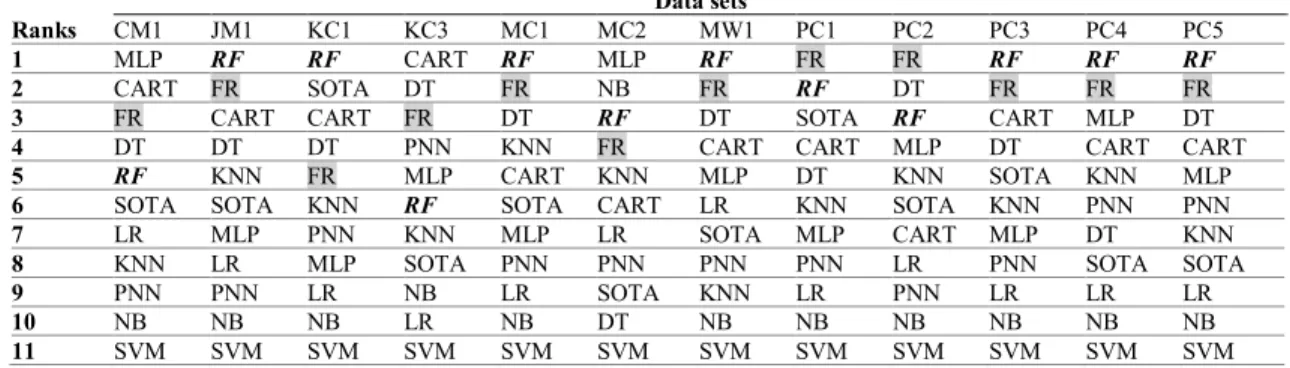
TABLE 8. Classifiers ranks per every data sets.
computed by taking the averages row-wise for every row i inB(j).
s(j)= Pc
h=1bih
c (14)
Now, we can construct matrixS by combining all calculated
s(j)scores vectors,
S =hs(1)· · ·s(j)i, where j=1· · ·p (15) Each column in the matrixS corresponds to one of thes(j)
column vectors. Step 4:
Calculate the vectorvof the classifiers’ priorities by mul-tiplying the classifiers’ pairwise comparison scores matrixS by the defuzzifiedcriteria weights vectorw, Equation (16).
v=S·w (16)
Eachvientry represents the score (i.e. rank) assigned by the
FAHP process to theithclassifier in comparison to all other c−1 classifiers.
VIII. RESULT
The experiments resulted in 12 E matrixes, 12S matrixes, and 264Bmatrixes. For brevity, we will report the summary of the results.
We can notice from Table 8 that every data set reveals a unique order of the experimented classifiers perfor-mance ranks. These results conform with much published research that every data set (i.e. software project) is a unique product and persists unique characteristics. Kastro and Bener [57] concluded in their study that it is almost impossible to have two identical software products in terms of developing process, programming languages used, program-mers’ experience, algorithm complexity, or even the devel-opment methodology. Myrtveit et al.[8] reported similar findings.
However, some interesting trends can be implied. Random Forest (RF)has won the first rank 7 times and the second rank one time. Fuzzy Rule ( ) has won the first rank 2 times and the second rank 6 times. This shows that those particular classifiers perform very well. On the contrary, SVM has won
the last rank (i.e. the 11thrank) 12 times, which implies that this classifier consistently performs poorly in these experi-ments. Close to this performance is NB that won the 10th rank 10 times, the 9th rank 1 and surprisingly won the 2nd rank 1 time.
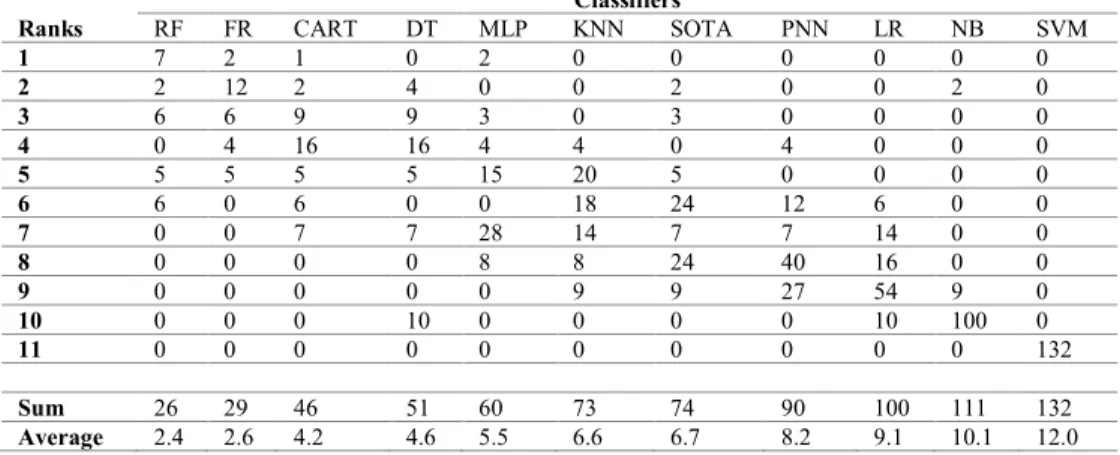
To make clearer final comparisons between all competing classifiers, Table 9 shows the average rank for each classifier over all experimented data sets. The procedure we follow is to count the number of times each classifier achieves a particular rank, then multiply this number by the rank itself. The sum of these numbers is divided over the total number of available ranks. Small average rank values indicate better performing classifiers in comparison to classifiers that have larger averages. Table 9 confirms our earlier observations in this section.
On the other hand, we averaged the matrix E for the 12 data sets and applied FAHP on this one averaged matrix. As expected, the final rankings are perfectly matching the previous ones.
IX. THREATS TO VALIDIT
The first threat to validity comes from the fact that this paper’s results and conclusions are biased based on the data sets and classifiers we used [58]. However, we believe that by choosing the publicly available NASA data sets, replication should be possible and encouraged by other researchers. The same argument applies for choosing the most common classi-fiers in the field of software defect prediction [4], [38], [57]. Moreover, NASA data sets meet all the requirements that would increase our research external validity stated by Khoshgoftaaret al.[59], that is, increasing the generalization of the results outside our experimental settings:
1) Be large enough to be comparable to real industry projects
2) Developed in an industrial environment, rather than an artificial setting
3) Developed by a group of developers rather than an individual
4) Developed by professionals, rather than students On the other hand, and in order to decrease the presence of internal validity threats, we decided to use the cleaned-up
TABLE 9. Averaged data sets ranks.
NASA date sets instead of the original ones, as discussed earlier in the data sets section. This allows us to avoid the noise sources that exist in the original NASA data sets.
Moreover, some data sets contain relatively small number of modules, such as, MC2 and KC3. Especially when 10-fold cross-validation technique is employed. Some classifiers that are sensitive to the size of data sets might lose some of their performance quality [60]. This effect might be increased after performing the cleaning procedures on NASA data sets. As Table 3 shows, this resulted in smaller number of obser-vations for each experimented data set.
X. CONCLUSIONS
There is a substantial need to design and develop reliable software defect classifiers that classify software components into defective and non-defective. The benefit of this objective is the ability to focus software defect detection efforts and project resources on part of a system rather than testing the whole system.
Nevertheless, the major problem that software practitioners face is how to reliably evaluate classifiers and how to select the best fit for their software development projects. Since the evaluation of software defect classifiers performance is highly dependent on the specific measures employed, the per-formance evaluation might improve or deteriorate if practi-tioners choose different performance measures.
As we believe that performance evaluation must be seen as a comprehensive strategy rather than relying on preferably selected performance measures, Fuzzy Analytical Hierarchy Process (FAHP) is implemented in this research to satisfy this requirement. FAHP allowed us to combine a wider spectrum of evaluation measures, in contrast to relying on preferably selected one or two evaluation measures. Another strength comes from the fact that FAHP employs fuzzy membership function to account for human nature of uncertainty and vagueness when evaluating and comparing performance mea-sures against each other. The results show that this approach will increase software developers’ confidence in research
outcomes and help them in avoiding false conclusions and infer reasonable boundaries for them.
REFERENCES
[1] B. Turhan, A. Tosun, and A. Bener, ‘‘Empirical evaluation of mixed-project defect prediction models,’’ inProc. 37th EUROMICRO Conf. Softw. Eng. Adv. Appl., Oulu, Finland, Aug. 2011, pp. 396–403.
[2] D. Lo, S.-C. Khoo, J. Han, and C. Liu, Eds.,Mining Software Specifica-tions: Methodologies and Applications. Boca Raton, FL, USA: CRC Press, 2011, pp. 1–15.
[3] M. Shepperd, D. Bowes, and T. Hall, ‘‘Researcher bias: The use of machine learning in software defect prediction,’’IEEE Trans. Softw. Eng., vol. 40, no. 6, pp. 603–616, Jun. 2014.
[4] S. Lessmann, B. Baesens, C. Mues, and S. Pietsch, ‘‘Benchmarking clas-sification models for software defect prediction: A proposed framework and novel findings,’’IEEE Trans. Softw. Eng., vol. 34, no. 4, pp. 485–496, Jul. 2008.
[5] L. Madeyski and M. Jureczko, ‘‘Which process metrics can significantly improve defect prediction models? An empirical study,’’Softw. Qual. J., vol. 23, no. 3, pp. 393–422, 2014.
[6] M. D’Ambros, M. Lanza, and R. Robbes, ‘‘Evaluating defect prediction approaches: A benchmark and an extensive comparison,’’Empir. Softw. Eng., vol. 17, nos. 4–5, pp. 531–577, 2011.
[7] R. S. Wahono, N. S. Herman, and S. Ahmad, ‘‘A comparison framework of classification models for software defect prediction,’’Adv. Sci. Lett., vol. 20, nos. 10–11, pp. 1945–1950, 2014.
[8] I. Myrtveit, E. Stensrud, and M. Shepperd, ‘‘Reliability and validity in comparative studies of software prediction models,’’IEEE Trans. Softw. Eng., vol. 31, no. 5, pp. 380–391, May 2005.
[9] T. Hall, S. Beecham, D. Bowes, D. Gray, and S. Counsell, ‘‘A systematic literature review on fault prediction performance in software engineering,’’
IEEE Trans. Softw. Eng., vol. 38, no. 6, pp. 1276–1304, Nov. 2012. [10] H. Wang, T. M. Khoshgoftaar, and Q. Liang, ‘‘A study of software metric
selection techniques: Stability analysis and defect prediction model perfor-mance,’’Int. J. Artif. Intell. Tools, vol. 22, no. 5, 2013, Art. no. 1360010. [11] I. Myrtveit and E. Stensrud, ‘‘Validity and reliability of evaluation
proce-dures in comparative studies of effort prediction models,’’Empirical Softw. Eng., vol. 17, nos. 1–2, pp. 23–33, 2012.
[12] D. M. Powers, ‘‘Evaluation: From precision, recall and F-measure to ROC, informedness, markedness and correlation,’’J. Mach. Learn. Technol., vol. 2, no. 1, pp. 37–63, 2011.
[13] N. Fenton and B. Kitchenham, ‘‘Validating software measures,’’Softw. Test., Verification Rel., vol. 1, no. 2, pp. 27–42, 1991.
[14] C. Andersson, ‘‘A replicated empirical study of a selection method for software reliability growth models,’’Empirical Softw. Eng., vol. 12, no. 2, p. 161, 2007.
[15] L. J. White, ‘‘The importance of empirical work for software engineering papers,’’Softw. Test., Verification Rel., vol. 12, no. 4, pp. 195–196, 2002.
[16] G. Forman and M. Scholz, ‘‘Apples-to-apples in cross-validation studies: Pitfalls in classifier performance measurement,’’ACM SIGKDD Explo-rations Newslett., vol. 12, no. 1, pp. 49–57, 2010.
[17] D. C. Ince, L. Hatton, and J. Graham-Cumming, ‘‘The case for open computer programs,’’Nature, vol. 482, no. 7386, p. 485, 2012. [18] B. Kitchenham, ‘‘What’s up with software metrics?—A preliminary
map-ping study,’’J. Syst. softw., vol. 83, no. 1, pp. 37–51, 2010.
[19] N. Fenton and J. Bieman,Software Metrics: A Rigorous and Practical Approach, 3rd ed. Boca Raton, FL, USA: CRC Press, 2014.
[20] B. D. Rouyendegh, ‘‘The DEA and intuitionistic fuzzy TOPSIS approach to departments’ performances: A pilot study,’’J. Appl. Math., vol. 2011, Oct. 2011, Art. no. 712194. doi:10.1155/2011/712194.
[21] T. L. Saaty, ‘‘Decision making with the analytic hierarchy process,’’Int. J. Services Sci., vol. 1, no. 1, pp. 83–98, 2008.
[22] T. L. Saaty,Analytical Hierarchy Process. New York, NY, USA: McGraw-Hill, 1980.
[23] S. Kubler, J. Robert, W. Derigent, A. Voisin, and Y. Le Traon, ‘‘A state-of the-art survey & testbed of fuzzy AHP (FAHP) applications,’’Expert Syst. Appl., vol. 65, pp. 398–422, Dec. 2016.
[24] B. D. Rouyendegh and T. Erkart, ‘‘Selection of academic staff using the fuzzy analytic hierarchy process (FAHP): A pilot study,’’Tehnicki Vjesnik, vol. 19, no. 4, pp. 923–929, 2012.
[25] M. Z. Naghadehi, R. Mikaeil, and M. Ataei, ‘‘The application of fuzzy analytic hierarchy process (FAHP) approach to selection of optimum underground mining method for Jajarm Bauxite Mine, Iran,’’Expert Syst. Appl., vol. 36, no. 4, pp. 8218–8226, 2009.
[26] L. A. Zadeh, ‘‘Fuzzy sets,’’ Inf. Control, vol. 8, no. 3, pp. 338–353, Jun. 1965.
[27] Y. Peng, G. Kou, G. Wang, W. Wu, and Y. Shi, ‘‘Ensemble of software defect predictors: An AHP-based evaluation method,’’Int. J. Inf. Technol. Decis. Making, vol. 10, no. 1, pp. 187–206, 2011.
[28] G. Kabir and M. A. A. Hasin, ‘‘Comparative analysis of AHP and fuzzy AHP models for multicriteria inventory classification,’’Int. J. Fuzzy Logic Syst., vol. 1, no. 1, pp. 1–16, 2011.
[29] P. J. M. van Laarhoven and W. Pedrycz, ‘‘A fuzzy extension of Saaty’s priority theory,’’Fuzzy Sets Syst., vol. 11, nos. 1–3, pp. 229–241, 1983. [30] J. Harding, E. A. Walker, and C. L. Walker,The Truth Value Algebra of
Type-2 Fuzzy Sets: Order Convolutions of Functions on the Unit Interval. Boca Raton, FL, USA: CRC Press, 2016.
[31] Y. Jiang, B. Cukic, and Y. Ma, ‘‘Techniques for evaluating fault prediction models,’’Empirical Softw. Eng., vol. 13, no. 5, pp. 561–595, 2008. [32] M. Vihinen, ‘‘How to evaluate performance of prediction methods?
Mea-sures and their interpretation in variation effect analysis,’’BMC Genomics, vol. 13, no. 4, p. S2, 2012. doi:10.1186/1471-2164-13-S4-S2.
[33] C. Ferri, J. Hernández-Orallo, and R. Modroiu, ‘‘An experimental compar-ison of performance measures for classification,’’Pattern Recognit. Lett., vol. 30, no. 1, pp. 27–38, 2009.
[34] M. Shepperd, Q. Song, Z. Sun, and C. Mair. NASA MDP Soft-ware: Defects Datasets. Accessed: Sep. 16, 2018. [Online]. Available: https://figshare.com
[35] S. Wang and X. Yao, ‘‘Using class imbalance learning for software defect prediction,’’IEEE Trans. Rel., vol. 62, no. 2, pp. 434–443, Jun. 2013. [36] M. Shepperd, Q. Song, Z. Sun, and C. Mair, ‘‘Data quality: Some
com-ments on the nasa software defect datasets,’’IEEE Trans. Softw. Eng., vol. 39, no. 9, pp. 1208–1215, Sep. 2013. doi:10.1109/TSE.2013.11. [37] W. Fan, F. Geerts, and X. Jia, ‘‘A revival of integrity constraints for data
cleaning,’’Proc. VLDB Endowment, vol. 1, no. 2, pp. 1522–1523, 2008. [38] T. M. Khoshgoftaar, K. Gao, A. Napolitano, and R. Wald, ‘‘A comparative
study of iterative and non-iterative feature selection techniques for software defect prediction,’’Inf. Syst. Frontiers, vol. 16, no. 5, pp. 801–822, 2014. [39] N. V. Nenkov and I. Ibryam, ‘‘A survey of the open source platforms
Rapid-miner and Konstanz Information Miner (KNIME) for data processing, analysis and mining,’’ Pedagogical College, Dobrich, Bulgaria, Tech. Rep., 2013, pp. 124–129.
[40] M. R. Bertholdet al., ‘‘KNIME-the Konstanz information miner: Ver-sion 2.0 and beyond,’’ACM SIGKDD Explor. Newslett., vol. 11, no. 1, pp. 26–31, 2009.
[41] M. R. Berthold, ‘‘A probabilistic extension for the DDA algorithm,’’ inProc. IEEE Int. Conf. Neural Netw., Washington, DC, USA, vol. 1, Jun. 1996, pp. 341–346.
[42] J. Herrero, A. Valencia, and J. Dopazo, ‘‘A hierarchical unsupervised growing neural network for clustering gene expression patterns,’’ Bioin-formatics, vol. 17, no. 2, pp. 126–136, 2001.
[43] H. Enderton and H. B. Enderton,A Mathematical Introduction to Logic. Amsterdam, The Netherlands: Elsevier, 2001.
[44] D. R. Cox, ‘‘The regression analysis of binary sequences,’’J. Roy. Stat. Soc., B (Methodol.), vol. 20, no. 2, pp. 215–232, 1958.
[45] R. Stuart and N. Peter, Artificial Intelligence: A Modern Approach. Upper Saddle River, NJ, USA: Prentice-Hall, 2003.
[46] B. V. Dasarathy,Nearest Neighbor (NN) Norms: Nn Pattern Classification Techniques. Washington, DC, USA: IEEE Computer Society Press, 1991. [47] M. Riedmiller and H. Braun, ‘‘A direct adaptive method for faster back-propagation learning: The RPROP algorithm,’’ inProc. IEEE Int. Conf. Neural Netw., San Francisco, CA, USA, Mar. 1993, pp. 586–591. [48] J. C. Platt, ‘‘Fast training of support vector machines using sequential
minimal optimization,’’ inAdvances in Kernel Methods. Cambridge, MA, USA: MIT Press, 1999, pp. 185–208.
[49] S. S. Keerthi, S. K. Shevade, C. Bhattacharyya, and K. R. K. Murthy, ‘‘Improvements to Platt’s SMO algorithm for SVM classifier design,’’
Neural Comput., vol. 13, no. 3, pp. 637–649, 2001.
[50] J. R. Quinlan, C4.5: Programs for Machine Learning. Amsterdam, The Netherlands: Elsevier, 2014.
[51] J. Shafer, R. Agrawal, and M. Mehta, ‘‘SPRINT: A scalable parallel classifier for data mining,’’ inProc. Int. Conf. Very Large Data Bases, Bombay, India, 1996, pp. 544–555.
[52] L. Breiman, J. H. Friedman, R. A. Olshen, and C. J. Stone,Classification and Regression Trees(The Wadsworth Statistics and Probability Series). Belmont, CA, USA: Wadsworth International Group, 1984, p. 356. [53] W.-Y. Loh, ‘‘Classification and regression trees,’’Wiley Interdiscipl. Rev.,
Data Mining Knowl. Discovery, vol. 1, no. 1, pp. 14–23, 2011.
[54] D. Rodriguez, I. Herraiz, R. Harrison, J. Dolado, and J. C. Riquelme, ‘‘Preliminary comparison of techniques for dealing with imbalance in software defect prediction,’’ inProc. 18th Int. Conf. Eval. Assessment Softw. Eng., London, U.K., 2014, p. 43.
[55] J. J. Buckley, ‘‘Fuzzy hierarchical analysis,’’Fuzzy Sets Syst., vol. 17, pp. 233–247, Dec. 1985.
[56] B. Schott and T. Whalen, ‘‘Nonmonotonicity and discretization error in fuzzy rule-based control using COA and MOM defuzzification,’’ inProc. IEEE 5th Int. Fuzzy Syst., New Orleans, LA, USA, vol. 1, Sep. 1996, pp. 450–456.
[57] Y. Kastro and A. B. Bener, ‘‘A defect prediction method for software versioning,’’Softw. Qual. J., vol. 16, no. 4, pp. 543–562, 2008.
[58] T. Menzies, J. Greenwald, and A. Frank, ‘‘Data mining static code attributes to learn defect predictors,’’IEEE Trans. Softw. Eng., vol. 33, no. 1, pp. 2–13, Jan. 2007.
[59] T. M. Khoshgoftaar, N. Seliya, and N. Sundaresh, ‘‘An empirical study of predicting software faults with case-based reasoning,’’Softw. Quality J., vol. 14, no. 2, pp. 85–111, 2006.
[60] C. Catal and B. Diri, ‘‘Investigating the effect of dataset size, metrics sets, and feature selection techniques on software fault prediction problem,’’Inf. Sci., vol. 179, no. 8, pp. 1040–1058, 2009.
HUSSAM GHUNAIMreceived the B.Sc. degree in physics and mathematics, in 1993, and the M.Sc. degree (Hons.) in Internet engineering from London South Bank University, U.K., in 2005. He is currently pursuing the Ph.D. degree in com-puter science and engineering with the Univer-sity of Bridgeport, Bridgeport, CT, USA. He was engaged in progressive career in education for over 20 years. He is an active Researcher in software defect prediction modeling techniques and perfor-mance evaluation procedures.
JULIUS DICHTERreceived the B.S. degree from the University of Connecticut, the M.S. degree from the University of New Haven, and the Ph.D. degree from the University of Connecticut. He is currently an Associate Professor of computer sci-ence with the University of Bridgeport, Bridge-port, CT, USA. His research interest includes the optimization of parallel computing. He is a member of the IEEE Computer Society, ACM, International Society of Computers and Their Applications, and UPE Computer Science Honor Society.