No. 1/2005
Local Economic Structure
and Industry Development
in Germany
(1993-2001)
Uwe Blien and Jens Suedekum
Local Economic Structure
and Industry Development
in Germany
(1993-2001)
Uwe Blien (IAB) and Jens Suedekum (University of Konstanz)
Auch mit seiner neuen Reihe „IAB-Discussion Paper“ will das Forschungsinstitut der Bundesagentur für Arbeit den Dialog mit der externen Wissenschaft intensivieren. Durch die rasche Verbreitung von Forschungsergebnissen über das Internet soll noch vor Drucklegung Kritik angeregt und Qualität
gesi-chert werden.
Also with its new series "IAB Discussion Paper" the research institute of the German Federal Em-ployment Agency wants to intensify dialogue with external science. By the rapid spreading of research
Abstract
This paper analyses the impact of dynamic MAR- and Jacobs-externalities on local employment growth in Germany between 1993 and 2001. In or-der to facilitate a comparison between the neighbouring countries we firstly replicate the study of Combes (2000) on local employment growth in France and find very similar results for Germany. Afterwards we formu-late an alternative empirical model that is based on a weighted regression approach. With this model we find that Jacobs-externalities matter in manufacturing, whereas MAR-externalities are present in advanced ser-vice sectors.
This version: September 7,2004
Keywords: Dynamic externalities, local employment growth, urbanization
and localisation effects
JEL-classification: R11, O40
* Corresponding author: Jens Suedekum, University of Konstanz, Fach D132,
78457 Konstanz, Germany. [email protected], Phone: +49/7531/88-3615.
The authors thank Friedrich Breyer, Wolfgang Franz, Johannes Ludsteck, Joachim Moeller, Winfried Pohlmeier, Susanne Rässler und Katja Wolf for sev-eral very useful suggestions and discussions. All errors and shortcomings are our full responsibility, however.
1
Introduction
Endogenous growth theory suggests that externalities are a major growth engine (Romer, 1986). Knowledge spillovers seem to be particularly rele-vant for developed countries. The owners of input factors like, say, high skilled labour might not fully internalize their social contribution to the economy. They might rather also raise the total factor productivity exter-nally available to other firms. As shown e.g. by Jaffe et al. (1993), Ciccone/Hall (1996) or Audretsch/Feldman (1996), the geographical scope of externalities is limited. Even in the internet age the interaction of peo-ple, unintended communications, face-to-face contact and so on, remain important. Spillovers apparently do not spill very far and thus they should be more readily observed in local environments (Lucas, 1988).
A major string in the empirical literature about the impact of externalities on local growth was launched by the seminal papers of Glaeser et al. (1992) and Henderson et al. (1995). These papers ask what sectoral eco-nomic structure is conducive for the employment growth performance of different industries at the local level. Two distinct questions are analysed: Firstly, did industries grow faster in local environments where they were traditionally overrepresented? And secondly, did they grow faster if they historically faced a relatively diversified surrounding industrial structure? If the former turns out to be the case, this is taken as evidence for dynamic Marshall/Arrow/Romer (MAR)-externalities, which are closely related to
the more static localisation economies. A positive result on the latter
ques-tion is taken as evidence for dynamic Jacobs-externalities, which are
re-lated to the more static urbanization economies.1 MAR-externalities are
consistent with intra-sectoral knowledge spillovers. Local overrepresenta-tion of an industry is good for growth, since it facilitates more knowledge exchange between specialists from the same industry. Jacobs-externalities on the other hand imply that knowledge spillovers accrue through a
1 The focus on the word ´dynamic´ is important, because the employment growth per-formance of different local industries is thought to be influenced by the historical and not so much by the current local economic structure. The timing of externalities is ex-plicitly analysed in Henderson (1997). Due to the relatively short time period covered by our panel data set we do not explicitly test for the lag structure of externalities, but analyse the impact of the economic structure in the base year (1993) on the growth performance between 1993 and 2001.
fertilisation of people from different professional backgrounds. Industries should then thrive if they face a great local diversity of industries, as this eases the inter-sectoral knowledge exchange.
A different, but related debate is how the degree of local competition in-fluences the process of knowledge creation and thus, ultimately, growth. If single industries are strongly monopolised within a region, and external-ities are mainly intra-sectoral, growth might be enhanced since the mo-nopolist can easier defend and internalise the rents of innovations and subsequently reinvest profits in further R&D. On the other hand, competi-tion might be more growth friendly than monopoly, since firms might face a stiffer pressure to innovate (Porter, 1990).
After this urban employment growth literature was launched with Ameri-can data, a few studies appeared that look at European countries also. Yet, to our knowledge the present paper is the first study on the German economy in this respect, after all Europe’s largest economy. We can draw on a comprehensive, very accurate and recent data set, covering the complete population of full-time employees from 1993 to 2001, encom-passing the entire German territory (i.e. both cities and non-urban areas) and the full range of economic activities. This data structure is comparable to the study of Combes (2000), who analyses local employment growth in France and whose contribution is most closely related to ours. In order to facilitate a comparison between the two neighbouring countries Germany and France, we will (at first) follow the estimation strategy used in that paper. As it turns out, this replication leads to results that are remarkably consistent with the French ones, namely that the evidence for dynamic externalities is rather slim, and that there is even counterevidence on
MAR-externalities.2 However, we point to some conceptual problems with
this estimation and formulate an alternative empirical model that is based on a weighted regression approach, which we see as a methodological contribution of the present paper. This model is then taken back to the
2 Recently, Cingano/Schivardi (2004) have argued that the counterevidence for MAR-externalities might be the result of an identification problem when using employment data. They advocate the use of productivity (TFP) data. Although the argument is con-vincing, we are also restricted to employment information in this paper, due to the usual problems with the availability of local output and productivity data.
German data and we now find that externalities matter significantly for growth and that manufacturing and service industries are affected quite differently. Whereas Jacobs-externalities are important for manufacturing sectors, MAR-externalities are present in advanced service industries. The rest of the paper is organized as follows. In section 2 we briefly re-view the existing empirical literature and in particular the paper of Combes (2000). In section 3 we replicate this methodology on our German data. In section 4 we formulate the alternative empirical model and redo the estimations. Section 5 concludes.
2
The related empirical literature
The empirical literature on externalities and local employment growth started with the seminal work of Glaeser et al. (1992). The authors use a cross-section of 6 industries in 170 American cities between 1956 and 1987 and find that city-industries tend to grow faster if the surrounding industrial environment is relatively diversified (Jacobs-externalities) and if the degree of competition is relatively strong. Specialisation does not con-tribute to faster, but rather to significantly slower growth. This latter find-ing is interpreted as counterevidence against MAR-externalities, as local overrepresentation apparently is harmful for the growth of a city-industry. A second major contribution comes from Henderson et al. (1995), who analyse the evolution of 8 manufacturing industries in 224 US metropoli-tan areas between 1970 and 1987. For traditional manufacturing sectors they find no evidence for Jacobs-, but support for MAR-externalities. For “new high-tech” industries, however, Jacobs-externalities seem to be per-vasive, whereas the MAR form is not.
Combes (2000) is one of the most recent contributions to this literature. He has data about the employment level of all plants in France with more than 20 employees between 1984 and 1993. He can distinguish 94 (ser-vice and manufacturing) industries and 341 French local areas (employ-ment zones). These areas cover the entire French territory and both cities and rural areas. Sample selection issues as in Glaeser et al. (1992) and Henderson et al. (1995) do therefore not arise. He takes the common ap-proach by using the first and the last year of the observation period to ob-tain a cross section of growth rates. The explanatory variables are
com-puted for the base year and, in this respect, externalities are “dynamic”. He estimates the following reduced form equation
, 1 , 2 , 3
4 , 5 , ,
log( ) log( ) log( ) log( )
log( ) log( )
z s z s z s z
z s z s z s
y I spe div den
comp size
α α α
α α ε
= + ⋅ + ⋅ + ⋅
+ ⋅ + ⋅ + (1)
where I is an intercept, εz,s is an error term, and
, ,1993 , ,1984 , ,1993 ,1984 z s z s z s s s emp emp y emp emp = (2) is the growth rate of sector s in region z relative to the national growth
rate of that sector. Specialization is measured by the local relative to the national employment share of sector s.
, , z s z z s s emp emp spe emp emp = (3) Diversity is measured by a variant of the Hirshman-Herfindahl-index,
again relative to a national average
(
)
(
)
2 , ´ , ´ 1, ´ , 2 ´ ´ 1, ´ 1 /( ) 1 /( ) S z s z z s s s s z s S s s s s semp emp emp div
emp emp emp
= ≠ = ≠ − = −
å
å
(4) This measure increases with local diversity faced by sector s. It reaches amaximum when all surrounding industries account for an identical
em-ployment share. Thus, a positive coefficient associated with divz,s signals
Jacobs-externalities, as sector s then faces a more balanced local indus-trial environment. Then,
z z z emp den area = (5) measures the employment density in region z and captures the overall
size of the employment areas. Area z is the size of the local employment zone in square kilometres. The variable
, , , z s z s z s s s emp firms size emp firms = (6)
measures the average firm size in sector s and region z relative to the
na-tional average in sector s. Finally, compz,s measures the (relative) degree
of competition in each sector-region-combination in the following way
(
)
(
)
2 , , , , 2 , 1 1 z s i z s i z z s s i s i emp emp comp emp emp ∈ =å
å
(7)where empz,s,i and emps,i are the employment of plant i belonging to
sec-tor s and area z.
Note that Combes (2000) centres all local variables on respective national
values. He estimates separately for each industry, but he also performs so-called “global regressions” where all service and all manufacturing in-dustries are lumped together. In order to cope with the censoring problem in the data set (only plants with more than 19 employees are available), he employs a generalized Tobit method initially proposed by Heckman (1979). In the second stage of the estimation, when the Mills ratio of the first stage is introduced as a right-hand-side variable, OLS leads to unbi-ased but inefficient estimators. Therefore maximum likelihood estimation is preferred.
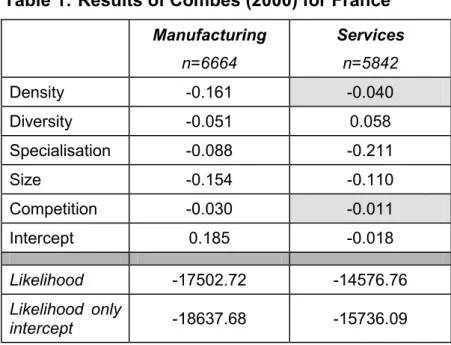
Turning to the results, the most important finding of Combes (2000) is that manufacturing and service industries are affected quite differently from externalities. Jacobs-externalities are only present in service indus-tries. In manufacturing, diversity even reduces growth. On the other hand, as in Glaeser et al. (1992), Combes finds that overrepresentation of an industry in a region significantly reduces employment growth. I.e., he ob-tains results that imply the exact opposite of MAR-externalities. Average firm size and the competition variable negatively affect growth. Density also has a significantly negative effect, which can represent congestion or suburbanization effects. Table 1 summarizes the “global regression re-sults” for France, which are more in line with Glaeser et al. (1992) than with Henderson et al. (1995). Shaded cells indicate insignificance at the
Table 1: Results of Combes (2000) for France Manufacturing n=6664 Services n=5842 Density -0.161 -0.040 Diversity -0.051 0.058 Specialisation -0.088 -0.211 Size -0.154 -0.110 Competition -0.030 -0.011 Intercept 0.185 -0.018 Likelihood -17502.72 -14576.76 Likelihood only intercept -18637.68 -15736.09
Shaded area: Not significant at the 5 %-level
3
Replication for Germany
In order to facilitate a comparison between Germany and France, we pre-sent a close replication of the estimation by Combes in this section. The data for this study is official employment data provided by the German Federal Employment Agency (Bundesagentur fuer Arbeit). This information is highly reliable, as it is used as the basis to determine individual social security contributions. It covers the entire territory of Germany and the complete sample of full-time employment relationships subject to social security (i.e. excluding civil servants and self-employed individuals) be-tween 1993 and 2001. Employment is observed in 438 NUTS3-districts
(“Landkreise” and “kreisfreie Städte”)3 and in 28 different industries,
en-compassing 15 manufacturing sectors, 10 service sectors, agriculture, mining and the public sector. The data refer to the workplace location and, unlike in the French case, are not subject to any censoring. No missing data problem occurs. For every district-industry we know the total em-ployment level and the emem-ployment shares in small (<20 workers), me-dium-sized (20-99) and large (>100) establishments. Furthermore, we know the number of active firms in every cell.
3 We had to exclude Berlin from the data, because in the base year 1993 the territorial classification of East and West Berlin invoked problems, and the employment data re-vealed several inconsistencies.
With the data at hand, we can easily compute the variables spez,s, divz,s,
denz and sizez,s as defined above.4 However, we can not observe
employ-ment at the plant level and we can therefore not compute the variable
compz,s. To come up with an alternative measure for the degree of local
product market competition, we use the relative employment share in small firms. That is, we introduce
[
]
[
]
, , , 20 log log 20 z s z s z s s s emp in firms employees emp smallemp in firms employees emp
é < ù
é ù= ê ú
ë û ê < ú
ë û , (8)
which should reflect local product market competition in the sense that competition should be stiffer the higher is the employment share in small firms. Table 2 reports the cross-correlation table for our five explanatory variables. As can be seen, the correlations are fairly low and we should therefore have no problems with multicollinearity. From a methodological point of view, the replication of the estimation for Germany is done by us-ing OLS. Recall that Combes (2000) only dismissed OLS, because the em-ployment data in the French case was censored for plants with fewer than 20 employees. This is not the case with our data. We also estimate
sepa-rately for manufacturing and service industries5 and with robust standard
errors. The results are reported in table 3, with P-values in parentheses.
In comparison to Table 1 we show an R2 and no likelihood figures because
our estimation method is different. We have complete data whereas Combes has not and had to use a Tobit model.
4 To compute den
z we use the size of every NUTS3-region in square kilometres as
re-ported in the regional statistics of the German Statistical office.
5 The 15 manufacturing industries are Electronics, Chemical Industry, Synthetic Mate-rial, Nonmetallic Mineral Mining, Glass & Ceramics, Primary Metal Manufacturing, Ma-chinery, Automobile, Office Supplies & IT, Musical Instruments & Jewellery, Wood-working, Paper & Printing, Leather & Apparel, Food & Tobacco and Building & Con-struction. The 10 service industries are Commerce, Information & Transportation, Fi-nance & Insurance, Hotels & Gastronomy, Health Care & Social Assistance, Business-Related Services, Education, Leisure-Business-Related Services, Household-Business-Related Services and Social Services. The sectors agriculture, mining and the public sector have been ex-cluded from the estimations.
Table 2: Correlations of the explanatory variables
Density Diversity Specialisation Size Small
Density 1
Diversity -0.1432 1
Specialisation -0.0294 0.0392 1
Size 0.1863 -0.0350 0.4248 1
Small -0.0538 0.0074 -0.1027 -0.1276 1
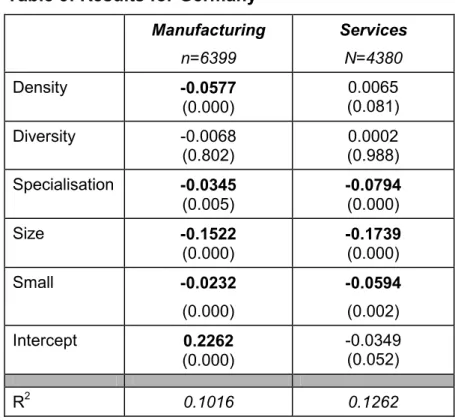
Table 3: Results for Germany
Manufacturing n=6399 Services N=4380 Density -0.0577 (0.000) 0.0065 (0.081) Diversity -0.0068 (0.802) 0.0002 (0.988) Specialisation -0.0345 (0.005) -0.0794 (0.000) Size -0.1522 (0.000) -0.1739 (0.000) Small -0.0232 (0.000) -0.0594 (0.002) Intercept 0.2262 (0.000) -0.0349 (0.052) R2 0.1016 0.1262
Bold numbers: P-value <0.05
Our results are quite consistent with Combes’ findings for France reported in table 1. Firstly, we also obtain significantly negative coefficients for the specialization measure, both in manufacturing and in services. The usual interpretation of this finding is that local overrepresentation of an industry (specialisation) reduces the employment growth rate of the respective unit (note, however, the caveat of Cingano/Schivardi, 2004). The coefficients for France are stronger negative than those for Germany. Secondly, as in France, higher employment density reduces employment growth in manu-facturing. Combes (2000) takes this finding as evidence for congestion in dense places. We subscribe to this interpretation, which is consistent with the observation that many countries experience a general suburbanization
and de-glomeration process where, in particular, manufacturing employ-ment secularly shifts away from dense city centres to surrounding areas. For West Germany, this process was also found in Moeller/Tassinopoulos (2000). Quantitatively the negative density effect in manufacturing ap-pears to be somewhat stronger in France than in Germany. A similar proc-ess does not seem to occur for service sectors, where we find a positive impact of density. Thirdly, we also find a significantly negative impact of average firm size on growth, both in manufacturing and in services. Fourthly, the coefficients for the competition/small-measure are also sig-nificantly negative. A slight difference lies in the results for the diversity measure. Whereas Combes finds a significantly negative impact of diver-sity on growth in manufacturing, and a significantly positive impact in ser-vices in the long-run, we find only insignificant coefficients. In sum, the general picture from this estimation is that the results for Germany are
very much in line with the results for France.6
4
A modified approach
Applying the methodology of Combes (2000) on German data leads to a picture that is fairly consistent with the French one. However, the un-weighted regression presented in the last section suffers from inherent
heteroskedasticity due to the so-called “shipbuilding in the midlands
”-problem. The issue is the following: In the data set, the largest district-industry has a total size of 105,675 employees in 1993 (commerce in the city-district Hamburg). On the other hand, there is a bunch of very small
district-industries.7 Small changes in absolute employment can imply
ex-orbitant jumps in the growth rates (the dependent variable) for these mini
6 We also checked if the main conclusions change if we only look at West Germany. The reason is that the spatial economic structure of East Germany was characterised by ar-tificially high concentration levels prior to re-unification. This was not due to market forces, but driven by central economic planning of the socialist government with a heavy bias towards industrial mono-structures. This geographical configuration was subject to rapid erosion after German re-unification, in particular in the first years of the observation period. This historically “special” industrial reorganisation process might bias our results and is eliminated if we only look at West Germany. However, redoing the unweighted regression for West Germany reveals that there are no sub-stantial differences in the qualitative conclusions: There is counter-evidence on MAR-, and no evidence for Jacobs externalities.
7 From the 11,779 total observations, 1,238 have a size of 100 employees or less. In 369 district-industries there are even less than 20 employees.
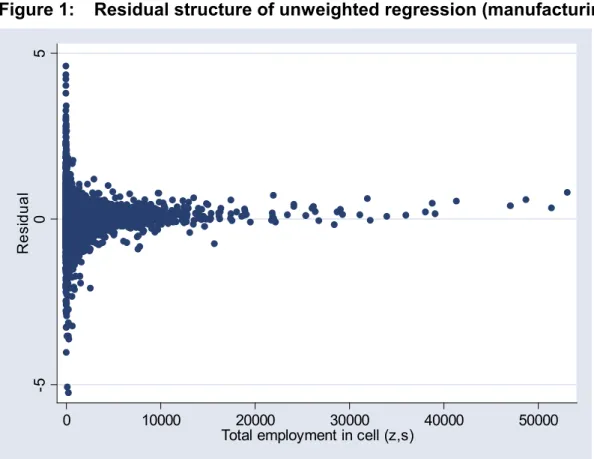
sectors, and the error term of the estimation will not be spherical. This is neatly illustrated in Figure 1 which depicts the residuals of the unweighted regression for the manufacturing sectors, plotted against the total size of
the observation.8 Any standard test for heteroskedasticity strongly rejects
the hypothesis of a constant variance of the residuals.
Figure 1: Residual structure of unweighted regression (manufacturing)
-5 0 5 R e si dual 0 10000 20000 30000 40000 50000
Total employment in cell (z,s)
There are various ways to address this issue. Only estimating with robust standard errors (as we have already done in section 3) and relying on the presumption that the coefficients will be unbiased is not enough in the present context, however. Since we can track the source of heteroskedas-ticity theoretically, we prefer to adopt an appropriately specified general-ized (weighted) least squares procedure, i.e. OLS in transformed vari-ables. The particular weighting scheme we will use is derived from a dif-ferent argument why the unweighted regression approach is flawed. Recall that the dependent variable of the reduced form equation (1) is (approxi-mately) a growth rate. The (log-)linear specification of the model implies
that the growth rate of the aggregate variable Z (i.e. aggregate
ment growth in Germany) can be built by the arithmetic mean of the growth rates of the single sub-units (i.e. the employment growth rates of the N single district-industries),
1
1
N j jZ
z
N
=é ù
=
⋅
å
ë û
This specification is in general incorrect, however, which can easily be
il-lustrated with a simple example. Let Zt be the value of the aggregate
vari-able (e.g. aggregate employment) at time t that consists of two
compo-nents (district-industries), Zt=xt+yt. The growth rate Zt+1=(Zt+1/ ) 1Zt − is in
general not equal to the arithmetic mean of the growth rates of xt and yt.
It is rather given by the weighted sum of the growth rates of the sub-units
1 1 1
t X t Y t
Z+ =g ⋅x+ +g y⋅ + (9)
where gx = xt/Zt and gy = yt/Zt. Stated differently, in an unweighted
re-gression approach the first normal equation of rere-gression analysis is vio-lated, according to which the regression hyperplane passes through the point of means of the data (see Greene, 1997: 238 f.). In the present con-text this additivity property is particularly important, however, since we consistently divide total employment in Germany into disjunctive subunits (district-industries) and compute several independent variables by refer-ring to the district level, which itself is obtained by aggregating all s
indus-tries located in area z.9
We will therefore weight both the dependent and the independent
vari-ables with a factor gz s, that is given by the employment level of each
dis-trict-industry divided by an aggregate employment figure for the base
9 This is a difference with the growth regressions á la Barro and Sala-i-Martin that, figu-ratively speaking, also attach the same weight to the United States and Luxemburg. However, in these regressions only country-specific explanatory variables are used, but no control variables that would require an aggregation of information for different countries. In our analysis on the other hand, we use e.g. relative employment shares as RHSV that require information about the size of district-industries, entire districts and entire industries at the national level. Although our observation units are district-industries, conclusions about the impact of specialization and diversity on growth are only possible by aggregating district-industries up to the regional and the national
level. Consistency then requires that the additivity condition must hold, which is war-ranted only with a weighted regression approach.
year. Since we estimate separately for manufacturing and services, the respective aggregate is the total employment in all manufacturing
(ser-vice) industries in 1993, empJ with J={manufacturing, services}.10 This
weighting procedure, after which the first normal equation of regression analysis is again satisfied, has initially been proposed by Buck/Atkins (1976) in a similar context and was later extended by Patterson (1991). Moeller/Tassinopoulos (2000) have shown that this weighting also amelio-rates the heteroskedasticity problem by attaching each district-industry with a weight that reflects the respective importance for aggregate em-ployment. In sum, we estimate the following model
, , , 1 , , 2 , ,
3 , 4 , ,
5 , , ,
log( ) log( ) log( )
log( ) log( ) log( ) z s z s z s z s z s z s z s z s z z s z s z s z s z s g y g I g spe g div g den g small g size α α α α α ε ⋅ = ⋅ + ⋅ ⋅ + ⋅ ⋅ + ⋅ ⋅ + ⋅ ⋅ + ⋅ ⋅ + (10)
where gz s, =empz s, empJ , εz s, =gz s, ⋅εz s, , and cov
( )
ε = Ω.11 This econometric ap-proach (10) is equivalent to a standard GLS-procedure (Greene, 1997:507 ff.). Table 4 reports the results.12
10 Conclusions do not change if we use total national employment as the aggregate fig-ure.
11 Alternatively, we can define the matrix W as the diagonal matrix of the weights g
z,s.
The variance/covariance-matrix of the error term εz,s from equation (1) is then given
by cov(ε)=WΩW.
12 One has to keep in mind that with a weighted intercept the R2 measure must be
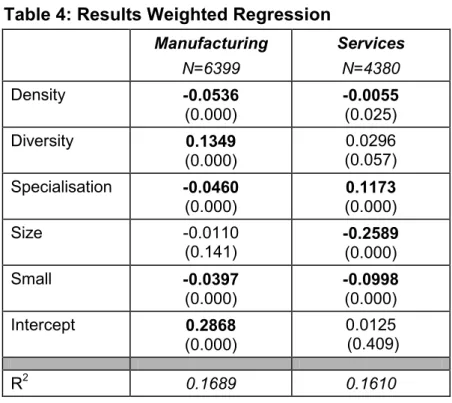
Table 4: Results Weighted Regression Manufacturing N=6399 Services N=4380 Density -0.0536 (0.000) -0.0055 (0.025) Diversity 0.1349 (0.000) 0.0296 (0.057) Specialisation -0.0460 (0.000) 0.1173 (0.000) Size -0.0110 (0.141) -0.2589(0.000) Small -0.0397 (0.000) -0.0998 (0.000) Intercept 0.2868 (0.000) 0.0125 (0.409) R2 0.1689 0.1610
Bold numbers: P-value <0.05
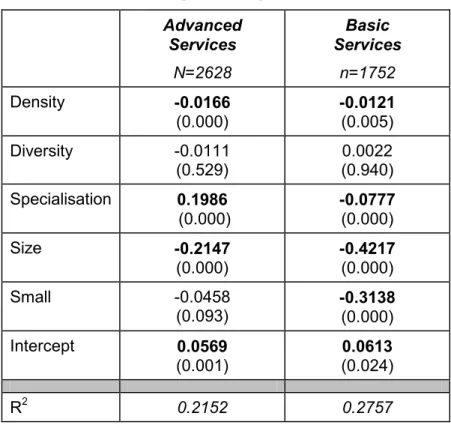
The most important message is that the results are now much more in fa-vour of the importance of externalities for local employment growth. For manufacturing industries, industrial diversity and thus Jacobs-externalities matter significantly. Yet, the result remains that local overrepresentation reduces growth, which is negative evidence for MAR-externalities. The change in conclusions is even more drastic for service industries. We now find evidence for dynamic MAR-externalities. Local overrepresentation in 1993 led to significantly faster growth of service industries. One has to keep in mind that very diverse activities are lumped together under the label “service industries”. There are sophisticated jobs such as financial consulting, teaching etc., but also much more basic jobs in the gastron-omy or in house-keeping. Presumably, the impact of dynamic externalities is quite different for these different types of service industries. To check this, we split up the services into “advanced services” and “basic
ser-vices”.13 For both groups of industries we re-estimate equation (10).
Re-sults are reported in table 5.
13 The advanced services include the sectors Commerce, Finance & Insurance, Business-Related Services, Education, Leisure-Business-Related Services and Social Services. The basic services consist of the sectors Information & Transportation, Household-Related Ser-vices, Hotels & Gastronomy and Health Care & Social Assistance. The criterion for
dis-Table 5: Results Weighted Regression Advanced Services N=2628 Basic Services n=1752 Density -0.0166 (0.000) -0.0121 (0.005) Diversity -0.0111 (0.529) 0.0022 (0.940) Specialisation 0.1986 (0.000) -0.0777 (0.000) Size -0.2147 (0.000) -0.4217 (0.000) Small -0.0458 (0.093) -0.3138(0.000) Intercept 0.0569 (0.001) 0.0613 (0.024) R2 0.2152 0.2757
Bold numbers: P-value <0.05
As expected, the impact of the dynamic externalities is very different for the advanced and the basic services. Whereas in the latter neither Jacobs- nor MAR-externalities matter, we can verify the idea that MAR-exter-nalities are strongly present in the advanced service sectors. We find this quite plausible, since the ease of personal interactions between specialists presumably is very important to create knowledge spillovers in such activi-ties as banking, consulting and education. The conclusions with respect to firm sizes and local competition remain unaffected compared to the un-weighted regression. The negative density effect is now also prevalent for service industries. Again, all conclusions remain qualitatively unchanged if we only look at West Germany.
5
Conclusion
Dynamic externalities play an important role for local employment growth in Germany, but manufacturing and service sectors behave quite differ-ently. Using a weighted regression approach, we find that manufacturing
tinction was income information (average sectoral wages) available also from the em-ployment statistics.
sectors grow more rapidly if they face a relatively diversified industrial en-vironment, which is consistent with Jacobs-externalities. For advanced service sectors we find evidence for dynamic MAR-externalities. These sectors grow strongly in regions where they are locally overrepresented. Externalities do not matter at all for basic services. Given these results, one expects that advanced service sectors should have revealed a geo-graphical concentration process over the recent years, as concentration fosters growth with MAR-externalities. The opposite, a geographical de-concentration process, can be expected for manufacturing industries. As shown by Suedekum (2004), who uses the same data set as the present paper and computes standard geographical concentration measures like locational Gini-coefficients, this is precisely what happened in Germany between 1993 and 2001. The estimation results of the weighted regres-sion approach are thus consistent with the descriptive empirical facts. From a policy perspective, our findings cast some doubts on a regional de-velopment strategy that aims to support “regional clusters” in manufactur-ing. Such structural policies are currently discussed quite intensively for East Germany. To be successful they would require MAR-externalities, since the basic idea of this policy is that regional concentration of the same industry will lead to a growth takeoff. In the past, however, manu-facturing sectors did not grow faster if they were locally concentrated. Given our results, the policy of “regional clusters” might only be successful for service industries, where MAR-externalities matter.
Literature
Audretsch, D. and M. Feldman (1996): R&D Spillovers and the Geography of Innovation and Production, American Economic Review 86: 630-640. Buck, T. and M. Atkins (1976): The Impact of British Regional Policy on
Employment Growth, Oxford Economic Papers 28: 118-132.
Ciccone, A. and R. Hall (1996): Productivity and the Density of Economic Activity, American Economic Review 86: 54-70.
Cingano, F. and F. Schivardi (2004): Identifying the Sources of Local Pro-ductivity Growth, Journal of the European Economic Association 2: 720-742.
Combes, P. (2000): Economic Structure and Local Growth: France 1984-1993, Journal of Urban Economics 47: 329-355.
Combes, P. and H. Overman (2004): The Spatial Distribution of Economic Activities in the European Union, forthcoming in: Henderson, V. and Thisse, J. (eds.): Handbook of Urban and Regional Economics, Amster-dam: North Holland.
Glaeser, E., H. Kallal, J. Scheinkman and A. Shleifer (1992): Growth in Cities, Journal of Political Economy 100: 1126-1152.
Greene, W. (1997): Econometric Analysis, 3rd ed., New Jersey: Prentice
Hall.
Heckman, James J. (1979): Sample selection bias as a specification error, Econometrica 47/1: 153-161.
Henderson, V. (1997): Externalities and Industrial Development, Journal of Urban Economics 42: 449-470.
Henderson, V., A. Kuncoro and M. Turner (1995): Industrial Development in Cities, Journal of Political Economy 103: 1067-1090.
Jacobs, J. (1969): The Economy of Cities, New York: Vintage.
Jaffe, A., M. Trajtenberg and R. Henderson (1993): Geographical Localiza-tion of Knowledge Spillovers as Evidenced by Patent CitaLocaliza-tions, Quarterly Journal of Economics 108: 577-598.
Lucas, R. (1988): On the Mechanics of Economic Development, Journal of Monetary Economics 22: 3-42.
Moeller, J. and A. Tassinopoulos (2000): Zunehmende Spezialisierung o-der Strukturkonvergenz? Eine Analyse o-der sektoralen Beschäftigungs-entwicklung auf regionaler Ebene, Jahrbuch für Regionalwissenschaft 20:
1-38.
Patterson, M. (1991): A Note on the Formulation of a Full-Analogue Re-gression Model of the Shift-Share Method, Journal of Regional Science 31: 211-216.
Porter, M. (1990): The Competitive Advantage of Nations, New York: Free Press.
Romer, P. (1986): Increasing Returns and Long-Run Growth, Journal of Political Economy 94: 1002-1037.
Suedekum, J. (2004): Concentration and Specialisation Trends in Ger-many since Re-Unification, HWWA Discussion Paper 285, Hamburg.
In dieser Reihe sind zuletzt erschienen:
Recently published:
No. Author(s) Title Date
1/2004 Bauer, Th. K.,
Bender, St., Bonin, H.
Dismissal Protection and Worker Flows in Small Establishments
7/2004
2/2004 Achatz, J.,
Gartner, H., Glück, T.
Bonus oder Bias? Mechanismen geschlechts-spezifischer Entlohnung
7/2004
3/2004 Andrews, M.,
Schank, Th., Upward, R.
Practical estimation methods for linked employer-employee data
8/2004
4/2004 Brixy, U.,
Kohaut, S., Schnabel; C.
Do newly founded firms pay lower wages? First evidence from Germany
9/2004
5/2004 Kölling, A,
Rässler, S.
Editing and multiply imputing German estab-lishment panel data to estimate stochastic production frontier models
10/2004
6/2004 Stephan, G,
Gerlach, Knut
Collective Contracts, Wages and Wage Dispersion in a Multi-Level Model
10/2004
7/2004 Gartner, H.,
Stephan, G. How Collective Contracts and Works Councils Reduce the Gender Wage Gap
Impressum
IABIABIABIABDiscussionPaper No. 1 / 2005 Herausgeber
Institut für Arbeitsmarkt- und Berufsforschung der Bundesagentur für Arbeit
Weddigenstr. 20-22 D-90478 Nürnberg Redaktion
Regina Stoll, Jutta Palm-Nowak Technische Herstellung Jutta Sebald
Rechte
Nachdruck – auch auszugsweise – nur mit Genehmigung des IAB gestattet
Bezugsmöglichkeit
Volltext-Download dieses DiscussionPaper unter:
http://doku.iab.de/discussionpapers/2005/dp0105.pdf IAB im Internet
http://www.iab.de
Rückfragen zum Inhalt an Uwe Blien, Tel. 0911/179-3035, oder e-Mail: [email protected]