Quantifying urban land cover by means of
machine learning and imaging spectrometer
data at multiple spatial scales
D
ISSERTATION
Zur Erlangung des akademischen Grades doctor rerum naturalium
(Dr. rer. nat.)
Im Fach Geographie
eingereicht an der
Mathematisch-Naturwissenschaftlichen Fakultät der Humboldt-Universität zu Berlin
von
Dipl. Geogr. Akpona Okujeni
Präsident der Humboldt-Universität zu Berlin Prof. Dr. Jan-Hendrik Olbertz
Dekan der Mathematisch-Naturwissenschaftlichen Fakultät Prof. Dr. Elmar Kulke
Gutachter: Prof. Dr. Patrick Hostert
Prof. Dr. Ben Somers Prof. Dr. Björn Waske
Eingereicht: 20. August 2014 Tag der Verteidigung: 21. November 2014
Completing this doctoral thesis would not have been possible without the support and encouragement of many kind people around me to whom I am very grateful.
First and foremost, I would like to express my gratitude to the two persons who introduced me into the world of remote sensing and ever since supported my scientific career in every possible way: Sebastian van der Linden, thank you for not only being an excellent and inspiring supervisor, but also for the trust and outstanding support I have received during the last years. This is exceptional and I deeply appreciate that! Patrick Hostert, thank you for not only being an excellent and inspiring supervisor too, but also for being such a great head of the Geomatics Lab. The research environment you have established is unique and I feel truly privileged to be a part of your team!
Second, I am grateful to my colleagues and friends at the Geomatics Lab, the
Biogeography and Conservation Biology Lab, and the Geoinformation Science Lab. We are sooo many now, that’s why I thank
ALL
for your support, contributions and great company throughout the last years! Nevertheless, I would like to point out my two long-time companions Patrick Griffiths & StefanSüß – indeed, “we have really come a long way now…”. Benjamin Jakimow, Andreas Rabe, Marcel Schwieder and Maria Cierpinski, many thanks for directly contributing to this thesis in one way or the other. Tobia Lakes, thank you for being head of the committee. Anika Sieber, thank you for being there whenever needed! Dagmar Wörister, thank you for all your helping hands! Without your reliable and constant support, focusing mainly on research would not have been possible. Third, several scientists crossed my way during the period being a doctoral researcher and I particularly thank Ben Somers and Björn Waske for being external supervisors of this thesis and for the nice conversations beyond remote sensing we had when met in Berlin, Leuven, or elsewhere. Thank you Laurent Tits and Jochem Verrelst for contributing as co-authors to this thesis. A big thank also to Christopher Small and the German Academic Exchange Service for a memorable research stay at the Columbia University in New York. On the personal side, I am thankful to all my friends and soulmates, who are cycling around the world or who I have heavily neglected during the past months.Last but not least, I would like to dedicate this thesis to my family and express my heartfelt gratitude for their continuous support, trust and love.
The global dimension of urbanization constitutes a great environmental challenge for the 21st century. Remote sensing is a valuable Earth observation tool, which helps to better understand this dynamic process and its ecological implications. The scientific focus of this work was to quantify urban land cover by means of machine learning and imaging spectrometer data at multiple spatial scales. Experiments considered innovative methodological developments and novel opportunities in urban research that will be created by upcoming hyperspectral satellite missions, specifically the Environmental Mapping and Analysis Program (EnMAP). Airborne Hyperspectral Mapper data at 3.6 m and 9 m resolution and simulated spaceborne EnMAP data at 30 m resolution were used to map land cover along an urban-rural gradient of Berlin, Germany. In the first part of this work, the combination of support vector regression with synthetically mixed training data was introduced as sub-pixel mapping technique. Results demonstrate that the approach performs well in quantifying thematically meaningful yet spectrally challenging surface types such as rooftops and paved-areas, or grass and tree cover. The method proves to be both superior to other advanced regression algorithms and traditional multiple endmember spectral mixture analysis and universally applicable when proceeding from the spatial scale of airborne to spaceborne hyperspectral data. In the second part of this work, the value of future EnMAP data for urban remote sensing was evaluated. Detailed explorations on simulated data demonstrate their suitability for improving and extending the approved Vegetation-Impervious-Soil mapping scheme. Comprehensive analyses of benefits and limitations of EnMAP data reveal both challenges caused by the high numbers of mixed pixels, when compared to hyperspectral airborne imagery, and improvements due to the greater material discrimination capability, when compared to multispectral spaceborne imagery. In summary, findings demonstrate how combining spaceborne imaging spectrometry and machine learning techniques could introduce a new quality to the field of urban remote sensing. This is of importance, especially considering the need for reliable global urban land cover products.
Das weltweite Ausmaß der Urbanisierung zählt zu den großen ökologischen Herausforderungen des 21. Jahrhunderts. Als eine Form der Erdbeobachtung bietet die Fernerkundung die ideale Möglichkeit das Verständnis dieses dynamischen Prozesses und seiner Auswirkungen zu erweitern. Der wissenschaftliche Schwerpunkt dieser Arbeit lag in der Quantifizierung der städtischen Landbedeckung mittels Maschinellen Lernens und räumlich unterschiedlich aufgelöster Hyperspektraldaten. Die Untersuchungen berücksichtigten innovative methodische Entwicklungen und neue Möglichkeiten für die Stadtforschung, die durch die bevorstehende hyperspektrale Satellitenmission
Environmental Mapping and Analysis Program (EnMAP) geschaffen werden. Auf Basis von Bilddaten des flugzeugestützten Hyperspectral Mapper Sensors mit einer Auflösung von 3,6 m und 9 m sowie simulierten EnMAP-Satellitendaten mit einer Auflösung von 30 m wurde eine Landbedeckungskartierung entlang des Stadt-Umland-Gradienten Berlins, Deutschland, durchgeführt. Im ersten Teil der Arbeit wurde die Kombination von Support Vector Regression mit synthetisch gemischten Trainingsdaten für die Subpixelkartierung eingeführt. Die Ergebnisse zeigen, dass sich der Ansatz gut zur Quantifizierung thematisch relevanter und spektral anspruchsvoller Oberflächenarten, z.B. bebaut und unbebaut versiegelte Flächen oder Grasflächen und Baumbestände, eignet. Die Methode liefert verbesserte Ergebnisse gegenüber weiteren fortgeschrittenen Regressionsalgorithmen und dem gängigen Ansatz der multiplen Entmischungsanalyse und zeigt sich als universell einsetzbar bei der Überbrückung des räumlichen Skalensprungs von flugzeuggestützten hin zu satellitengestützten Hyperspektraldaten. Im zweiten Teil der Arbeit wurde der Wert der zukünftigen EnMAP-Daten für die städtische Fernerkundung abgeschätzt. Detaillierte Untersuchungen mittels simulierten Bilddaten unterstreichen ihre Eignung für eine verbesserte und erweiterte Beschreibung der Stadt nach dem bewährten Vegetation-Impervious-Soil-Schema. Umfassende Analysen der Möglichkeiten und Grenzen von EnMAP-Daten zeigen sowohl Nachteile durch die höhere Anzahl von Mischpixel im Vergleich zu hyperspektralen Flugzeugdaten als auch Vorteile aufgrund der verbesserten Differenzierung städtischer Materialien im Vergleich zu multispektralen Satellitendaten. Insgesamt veranschaulichen die Ergebnisse dieser Arbeit, dass die Kombination von hyperspektraler Satellitenbildfernerkundung mit Methoden des Maschinellen Lernens eine neue Qualität in die städtische Fernerkundung bringen kann. Dies ist von großer Bedeutung, insbesondere vor dem Hintergrund des Bedarfs an verlässlichen Datenprodukten der globalen städtischen Landbedeckung.
Acknowledgments i
Abstract iii
Zusammenfassung v
Contents vii
List of Figures xi
List of Tables xiii
Chapter I: Introduction 1
1 Scientific background 2
1.1 The urban world 2
1.2 Earth observation of urban areas 4
1.3 Remote sensing-based urban land cover mapping 6
1.4 Machine learning algorithms for urban land cover mapping 8
2 Conceptual framework 11
2.1 Motivation 11
2.2 Objectives 11
2.3 Study area and materials 13
2.4 Structure 14
Chapter II: Support vector regression and synthetically mixed training data for
quantifying urban land cover 17
Abstract 18
1 Introduction 19
2 Data 23
2.1 Imaging spectrometer data and pre-processing 23
2.2 Image spectral library 24
2.3 Reference data 26
3 Methods and data analysis 27
3.1 Generation of synthetically mixed training data 27
3.2 Support vector regression 29
3.3 Multiple endmember spectral mixture analysis 30
3.4 Validation of fraction maps 31
4 Results 31
4.1 Performance of SVR at pixel scale 31
4.2 Performance of SVR and MESMA at urban block scale 35
5 Discussion 37
5.2 Urban land cover fraction estimates by SVR and MESMA at urban block scale 38
6 Conclusion 42
Acknowledgements 44
Chapter III: A comparison of advanced regression algorithms for quantifying urban
land cover 45
Abstract 46
1 Introduction 47
2 Study area and materials 50
2.1 Study area 50
2.2 Image data 51
2.3 Spectral library 52
2.4 Reference data 53
3 Methods 53
3.1 Synthetically mixed training data 53
3.2 Support vector regression (SVR) 55
3.3 Kernel ridge regression (KRR) 56
3.4 Neural network regression (NN) 56
3.5 Random forest regression (RFR) 57
3.6 Partial least squares regression (PLSR) 57
3.7 Validation 58
4 Experimental setup and results 59
4.1 Experimental setup 59
4.2 Average and class-wise accuracies of experimental results 59
4.3 Quantifying urban land cover at multiple spatial scales using SVR 63
5 Discussion 65
6 Conclusions 68
Acknowledgments 69
Chapter IV: Extending the Vegetation-Impervious-Soil model using simulated
EnMAP data and machine learning 71
Abstract 72
1 Introduction 73
2 Study area, materials and methods 77
2.1 Study area 77
2.2 Image data 77
2.3 Spectral library 79
2.4 Support vector regression modeling using synthetically mixed training data 81
2.5 Reference data and validation 82
3 Results 83
3.1 Mapping VIS fractions along the urban-rural gradient 83
3.2 Extending VIS mapping along the urban-rural gradient 86
4 Discussion 88 5 Conclusion 91 Acknowledgements 93 Chapter V: Synthesis 95 1 Summary 96 2 Main conclusions 100
References 107
Appendix: synthMix-SVR 125
1 Concept 127
2 Background 128
3 User guide 131
3.1 Data requirements and file formats 131
3.2 Getting started 131
3.3 Run synthMix-SVR 132
3.4 synthMix-SVR results 137
References 138
Figure I-1: Berlin-Brandenburg region as captured by the Global Urban Footprint
product of the German Aerospace Center ... 5
Figure I-2: Spectral library of anthropogenic and natural urban surface materials as recorded by HyMap and Landsat ... 7
Figure I-3: Extent of spectral mixing within HyMap data at 3.6 m and simulated EnMAP data at 30 m resolution ... 10
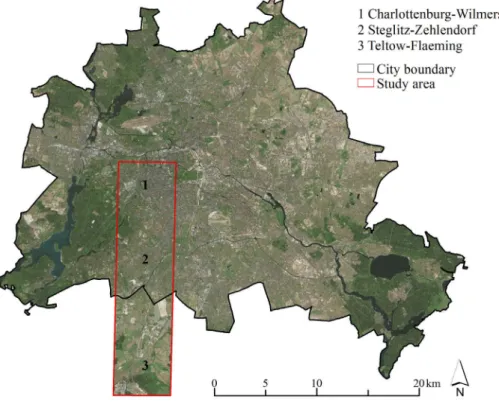
Figure I-4: Study region along Berlin’s urban-rural gradient ... 13
Figure II-1: HyMap footprint covering a subset of Berlin’s urban gradient and validation areas ... 24
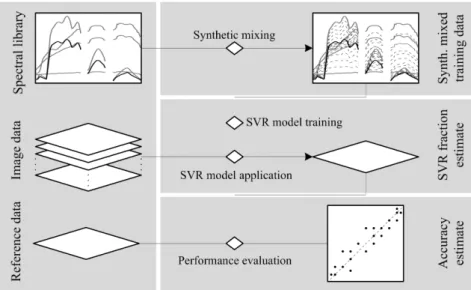
Figure II-2: Workflow for quantifying urban land cover with SVR and synthetically mixed training data ... 27
Figure II-3: Generation of synthetically mixed training data ... 29
Figure II-4: Subsets showing the spatial distribution of pixels with physically meaningful and unrealistic fractions values ... 33
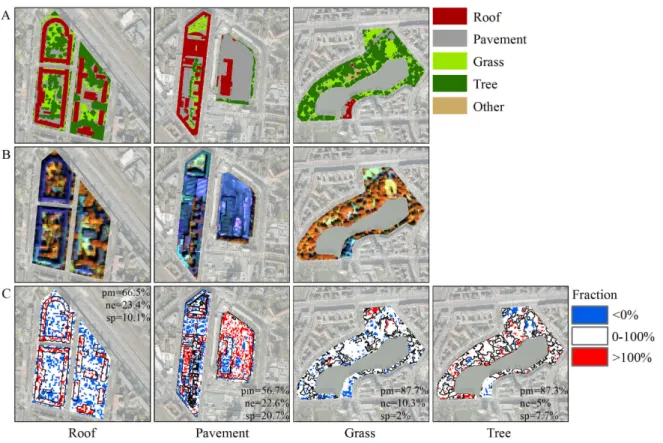
Figure II-5: Subsets showing urban blocks of different structure types from the reference data, HyMap image and fraction maps modeled with SVR ... 34
Figure II-6: Scatterplots of roof, pavement, grass and tree fractions ... 36
Figure II-7: Combined roof, pavement, grass and tree fraction estimates ... 37
Figure III-1: Study region along Berlin’s urban-rural gradient ... 51
Figure III-2: Generation of binary and ternary synthetic mixtures ... 54
Figure III-3: Class-wise mean absolute error of urban land cover fraction maps derived from different regression algorithms ... 60
Figure III-4: Scatterplots of roof, pavement, grass and tree estimates ... 62
Figure III-5: SVR-based fraction maps of roof, pavement, grass and tree at 3.6 m and 9 m spatial resolution ... 64
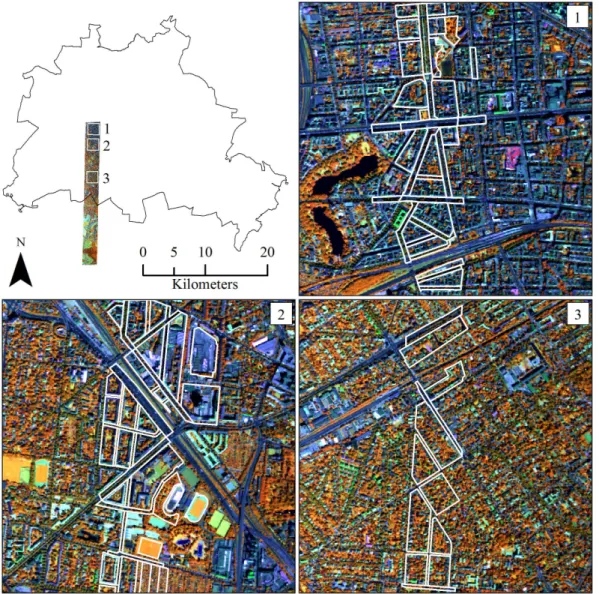
Figure IV-1: Overview of the study area and subsets of HyMap and EnMAP data showing the diversity of land cover along the urban-rural gradient ... 78
Figure IV-2: Examples of urban blocks and polygons used for validation ... 83
Figure IV-3: Scatterplots of impervious, vegetation and soil fractions ... 84
Figure IV-4: Impervious, vegetation and soil fraction maps derived from EnMAP, and HyMap and Landsat ... 85
Figure IV-5: Scatterplots of roof, pavement, low vegetation and tree fractions ... 87
Figure IV-6: Roof , tree and low vegetation fraction maps derived from EnMAP, and HyMap and Landsat ... 88
Figure V-1: Relationship between land cover fractions derived from simulated EnMAP data and urban structure types and peri-urban land uses ... 104
Figure V-2: Comparison between impervious maps from the Berlin Urban and Environmental Information System and from simulated EnMAP data ... 104
Table II-1: Hierarchically structured image spectral library ... 25 Table II-2: Percentages of physically meaningful, negative and super-positive
pixel fractions ... 32 Table III-1: Categorized image spectral library of urban materials ... 52 Table III-2: Number of training samples per target category used for regression
modeling ... 55 Table III-3: Average accuracies of urban land cover fraction maps derived from
different regression algorithms... 60 Table IV-1: Hierarchically structured spectral library ... 80
Chapter I:
Introduction
1 Scientific background
1.1 The urban world
The cultivation of land is one of the fundamental characteristics of civilization on Earth (Vitousek et al. 1997; DeFries et al. 2004; MEA 2005). Areas transformed for urban living occupy only a small percentage of the Earth’s land surface (DeFries et al. 2004; Kareiva et al. 2007). For this reason, changes urban land area per se do not appear to be central in land cover change worldwide (Lambin et al. 2001). Yet, urbanization is a dominant demographic, socio-economic, and biophysical process, and a major contributor to global environmental change (Lambin et al. 2001; Grimm et al. 2008; Pickett et al. 2011).
The 21st century is often referred to as the “Century of the City” (Seto et al. 2010). In 1900, only 13% of people lived in cities. Today, there are 3.6 billion urban dwellers, making up more than 50% of the world’s population. Since 1950, the number of cities with one million or more citizens has increased from 75 to 450. Since 1970, another 21 megacities with more than ten million inhabitants have emerged next to New York and Tokyo (United Nations 2006, 2012a, 2012b). Given the projected gains in global population by 2.3 billion and urban population by 2.6 billion until 2050 (United Nations 2012a), it is obvious that the world is becoming increasingly urbanized. High growth rates are particularly expected in the developing world and fast-developing countries of Asia, where the percentage of urban population is mostly far below the 75-80% urbanization level present in the more developed regions (Anderson et al. 2013; Kronenberg et al. 2013; McPhearson et al. 2013; Pauchard et al. 2013; Seto 2013). China and India in particular are predicted future hotspots of global population growth and urban development (United Nations 2012a; Fragkias et al. 2013).
The sheer quantity of urban growth is one reason to study urban areas. Another compelling argument is the quality of the urbanization process and its broader implications. On the one hand, urbanization has many positive effects. For example, cities are considered as centers of economic growth and better living conditions (Quigley 1998), as gateways to the world’s economy (Sánchez-Rodríguez et al. 2005), as hubs of productivity, employment, innovation, and creativity (UN Habitat 2010), as places where political, social, and cultural life takes place (Satterthwaite 2007), and so forth. This point of view is often underlined by the fact that no country has ever achieved sustained economic or social development
without being urbanized (UN Habitat 2010). On the other hand, urbanization is one of the most powerful, irreversible, and visible anthropogenic forces on Earth, leading to severe environmental and social problems (Sánchez-Rodríguez et al. 2005). Urban living depends on the resources of ecosystems far beyond city boundaries, which leads to extraordinary large ecological footprints (Rees 1992; Folke et al. 1997). The spread of impervious areas, the loss of natural environments, and increased landscape fragmentation along with the concentration of human consumption, production, and waste generation have altered biogeochemical cycles, climate regimes, hydrological systems, or biodiversity at multiple scales (Grimm et al. 2008). Environmental impacts are global considering that urban areas are, for example, major sources of CO2 and other greenhouse gases, which considerably contribute to global climate change (Kennedy et al. 2009). At the regional and local scale, phenomena such as the urban heat island (Oke 1982; Grimmond 2007), air pollution (Fenger 1999), or the increased vulnerability to natural hazards (Pelling 2003) are prominent characteristics of urban environments. Such changes in ecosystem condition and functioning can, in turn, influence the quality of life and human health (Harlan et al. 2006; Tan et al. 2010). Not least, cities especially in less the developed world are subject to fast-sprawling informal settlements and severe socio-economic disparities leading to what is referred to as the “urban divide” (UN Habitat 2010).
Meeting fundamental human needs while preserving life support systems of the Earth is a key effort to create a more sustainable world (NRC 1999). Given the global dimension and implications of urbanization, any efforts seeking to promote sustainable and desirable future developments have to consider urban dynamics for understanding and managing the fast changing world (Herold 2009). Policies must be adapted to sustain benefits of urbanization and to anticipate and manage negative consequences of urban growth (UN Habitat 2010). Contemporary urbanization has the chance to promote ecological sustainability due to increased environmental awareness and returns from innovation, productivity, and efficiency (Grimm et al. 2008; Seto et al. 2010). Given this perspective, interactions between socio-economic and environmental processes in urban landscapes need to be better understood (Alberti 2005). Integrated research of the diverse aspects and implications of urban systems in times of rapid urbanization is of great importance to face the complexity of the involved dynamics. This may ultimately support decision makers involved in governance, planning, or conservation to promote the sustainability of existing or emerging cities (Grimm et al. 2008; Seto et al. 2010; Pickett et al. 2011).
1.2 Earth observation of urban areas
Earth observation (EO) data is essential to understanding of natural and human-induced changes and their implications within the Earth’s spheres. Furthermore, EO data is essential to build information products, forecast models, and other tools for making informed decisions. In this context, satellite data have played a key role in studying, for example, stratospheric ozone levels, air pollution, glacial and sea ice contingents, land-use changes, weather patterns, ocean circulations, or natural disasters (NRC 2007).
By providing synoptic views in space and time, remote sensing has become a valuable EO tool to measure and monitor the Earth’s environment (Chuvieco 2008; Liang 2008; Weng 2011). As one area of application, urban remote sensing has emerged as new frontier in EO technology (Weng 2014) and holds the potential to link research, policy, and practice for successfully solving pressing urban and global change issues (Seto 2009). For example, Jensen and Cowen (1999) and Heiden et al. (2012) propose the use of remote sensing data as alternative to cost- and time-intensive field surveys for building inventories of urban surface properties required for urban planning. Masser (2001) and Maktav et al. (2005) stress the value of remote sensing to derive up-to-date spatial information on urban areas in the developing world, where alternative sources of information are limited. Miller and Small (2003) mention the opportunity to identify, monitor, and apprehend a number of urban environmental problems by means of high resolution imagery from EO satellites, recent advances in global connectivity, information technology, and other existing data sources. Accordingly, all authors underscore the value of remote sensing for studying urban systems in times of rapid urbanization.
With the beginning of modern EO in the 1970s, a multitude of spaceborne sensors, including optical, thermal, radar, or night light imaging systems, have provided different types of image data globally. Ever since, most urban image analyses have been focusing on characterizing urban environments at local to regional scales (Herold 2009). Studies encompass the monitoring of urban growth (Griffiths et al. 2010; Bagan and Yamagata 2012), the assessment of urban land cover (Powell et al. 2007; Myint et al. 2011), or the quantification of environmental conditions and biophysical processes such as the urban heat island or urban forest carbon storage (Myeong et al. 2006; Weng 2009). Global urban mapping efforts have so far focused on delineating the extent of human settlements by primarily distinguishing “urban land” from “non-urban environments”. Potere et al. (2009) and Schneider et al. (2010) list and discuss ten global maps of urban extent, most of them
based on the direct or indirect input of low (>100 m) spatial resolution data acquired by spaceborne multispectral sensors (e.g., MODIS, SPOT-Vegetation, or MERIS) or by night light systems (e.g., DMSP-OLS). However, large differences between urban extent estimates are reported (Potere et al. 2009), and maps are provided at very coarse spatial resolution for single time steps (Taubenböck et al. 2012). A recent improvement is the Global Urban Footprint product of the German Aerospace Center (Figure I-1). This product has been developed at 12 m resolution by means of TerraSAR-X and TanDEM-X radar data (Esch et al. 2012; Esch et al. 2013). The opening of the Landsat archive has facilitated other recent developments in global urban mapping: The continuous record of Landsat data at 30 m resolution allows detailed global mapping of urban extent over time. These data have been, for example, exploited by Taubenböck et al. (2012), who has mapped almost 40 years of megacity growth worldwide.
The proliferation of various sources of satellite imagery and processing and modeling tools has created the opportunity for progressing toward global observations of urban patterns and dynamics (Herold 2009). While the demographic shift toward an increasingly urbanized world is well documented, the physical component of urbanization at global scale is not well-understood (Seto et al. 2010). However, characterizing urban areas not only by extent, but also in terms of their physical properties could significantly advance our understanding of environmental processes related to urban meteorology, hydrology, and ecology (Small 2009). The derivation of reliable and standardized global urban land cover products is therefore one major task for urban remote sensing.
Figure I-1: Berlin-Brandenburg region as captured by the Global Urban Footprint product of the German Aerospace Center (Source: www.dlr.de).
1.3 Remote sensing-based urban land cover mapping
The use of remote sensing data for deriving descriptions of urban land cover was demonstrated in a multitude of case studies. Most mapping assessments exploited imagery from spaceborne multispectral sensors, which provide few broadband reflectance measurements in the visible to shortwave-infrared region of the electromagnetic spectrum. Medium (10-100 m) spatial resolution data (e.g., Landsat, or ASTER) were used to quantify urban land cover into the broad categories “impervious”, ”vegetation”, and “soil” (Powell et al. 2007; Pu et al. 2008) according to Ridd’s (1995) VIS framework. Very high to high (<10 m) spatial resolution imagery (e.g., WorldView 2, QuickBird, or IKONOS) were adopted to map more detailed surface properties, including different impervious and vegetation types (Myint et al. 2011; Pu and Landry 2012). Although these data sets are globally available, little progress has yet been made toward a global map of urban land cover. On the one hand, challenges due to the spatial complexity (Pesaresi and Ehrlich 2009) and limitations due to cloud coverage, data storage issues, data costs, and high processing efforts (Taubenböck et al. 2012) are reported for higher spatial resolution data; medium spatial resolution urban data face the challenge of large numbers of mixed pixels (Small 2001; Powell et al. 2007). On the other hand, general drawbacks of multispectral data are frequently mentioned when mapping urban land cover on a purely spectral basis. Many urban materials are not spectrally distinct when represented by broadband reflectance spectra, which can lead to considerable confusion between various impervious surfaces and bare soil, or between different vegetation types (Thomas et al. 2003; Powell et al. 2007; Myint et al. 2011). The SVD model (Small and Lu 2006) translates the spectral mixing space into the biophysical surface reflectance properties “substrate”, “vegetation”, and “dark matter”. This approach avoids spectral ambiguities and at the same time offers a robust way to characterize urban areas worldwide in terms of their physical properties (Small 2003, 2009). Although SVD was used to derive meaningful estimates of urban vegetation (Small and Lu 2006), linking spectral with more thematically-oriented information remains desirable. Other studies account for limitations of multispectral data for urban mapping by multi-date and multi-sensor approaches (Yuan et al. 2005; Griffiths et al. 2010; Lu et al. 2011; Tigges et al. 2013).
The increasing use of hyperspectral data – also referred to as imaging spectrometer data – has advanced urban land cover mapping on a purely spectral basis. Full range hyperspectral sensors provide hundreds of contiguous spectral measurements in the visible to shortwave-infrared domain. Compared to multispectral systems, hyperspectral sensors
uncover material characteristic reflectance signatures, including specific absorption features (Goetz 2009) (Figure I-2). This property has introduced new quality into urban remote sensing. For example, Herold et al. (2004) and Heiden et al. (2007) analyzed comprehensive urban spectral libraries of anthropogenic and natural materials and point to the value of the high spectral information content for improved separability. Herold et al. (2003) and Gamba and Dell’Acqua (2006) highlight the value of hyperspectral compared to multispectral data for improved urban mapping. Studies by Roessner et al. (2001), Herold et al. (2003), van der Linden and Hostert (2009) and Franke et al. (2009) demonstrate the value of imaging spectrometer data for mapping thematically meaningful urban surface types (e.g., rooftops and paved-areas, bare soil, grass- and tree-cover), or for mapping anthropogenic materials and vegetation species.
However, the use of imaging spectrometer data for urban mapping has thus far been more experimental by nature. High quality images are only available from episodic flight campaigns, where airborne hyperspectral sensors like the Advanced Visible Near Infrared Imaging Spectrometer (AVIRIS; Green et al. 1998) or the Hyperspectral Mapper
Figure I-2: Spectral library of (a) anthropogenic and (b) natural urban surface materials as recorded by HyMap and Landsat. HyMap spectra (111 bands; out of original 128 bands) provide considerable more information about overall shape and absorption features compared to Landsat spectra (6 bands; spectrally resampled from HyMap using the Landsat ETM+ filter function).
(HyMap; Cocks et al. 1998) generally capture a spatially limited subset of an urban area at high spatial resolution. Globally available data from Hyperion, which is currently the only spaceborne hyperspectral sensor, are used in a few urban studies (Cavalli et al. 2008; Weng et al. 2008). To some extent, this relates to limited instrument performances compared to the dominating airborne hyperspectral systems (Kruse et al. 2003; Roberts et al. 2003). This lack in data availability will change soon: several operational spaceborne hyperspectral missions, which will provide high quality imaging spectrometer data globally, are currently underway (Staenz and Held 2012). This will create unprecedented opportunities for novel applications, including the global mapping of urban land cover by means of hyperspectral imagery. The Environmental Mapping and Analysis Program (EnMAP; Kaufmann et al. 2008) in particular holds great potential for urban environments (Heldens et al. 2011). With a spatial resolution of 30 m, 244 spectral bands between 420 and 2,450 nm, and a nominal revisit time of 21 days, EnMAP represents a promising hyperspectral complement to multispectral spaceborne systems with medium spatial resolution such as Landsat. Exploring the potential of upcoming hyperspectral satellite missions, such as EnMAP for urban mapping, is therefore of great importance, particularly with regard to the need for reliable global urban land cover products.
1.4 Machine learning algorithms for urban land cover mapping
The development of adequate analysis techniques to exploit the ever-expanding bulk of image data is an important research field in remote sensing. The diversity of applications and the increasing dimensionality of the data have called for powerful methods that make best use of the latent information content. Against this background, machine learning algorithms have been successfully introduced into remote sensing data analysis.
In the context of land cover mapping by means of imaging spectrometer data, urban areas are probably some of the most challenging environments to be analyzed. They are spectrally and spatially complex and require special attention when being mapped. On the one hand, urban land cover assessments face challenges such as high within-class variability and high inter-class similarity. High within-class variability is characteristic for surfaces with high spectral diversity and variability and leads to multiple clusters within the spectral feature space (van der Linden et al. 2007). This phenomenon is typical for a category like roof, which comprises a large variety of roofing materials. High inter-class similarity is characteristic for surfaces with high spectral similarity and leads to overlapping class distributions (van der Linden et al. 2007). This phenomenon is typical for
spectrally similar rooftops and paved-areas (e.g., roof bitumen vs. street asphalt), rooftops and pervious surfaces (e.g., clay tiles vs. bare soil), or different vegetation types (e.g., green grass vs. deciduous trees) (compare Figure I-2). On the other hand, urban mapping assessments face the challenge of spectral mixing. This is caused by the heterogeneity of surface types, many of those often with areas smaller than the ground sampling distance of the sensor. As a result, the measured radiation is a composite of the spectral signatures of different materials, which leads to so-called spectrally mixed pixels.
A variety of machine learning algorithms have been applied to remote sensing data, including artificial neural networks (Haykin 1999), decision trees (Quinlan 1986), and support vector machines (Schölkopf and Smola 2002). Machine learning methods optimize their performance by iteratively learning from the data, integrate nonlinear functions, and are non-parametric, i.e., they are not constrained to prior assumptions on data distributions (Waske et al. 2009). They have thus become established and have ever since replaced traditional parametric approaches like the Gaussian maximum likelihood estimator. In the context of urban imaging spectrometry, support vector machines (SVMs) in particular have been demonstrated as powerful analysis techniques. Embedded into a kernel framework and by making use of an optimal adjusted hyperplane (Camps-Valls and Bruzzone 2005), they have proved to be capable of coping with nonlinearities and smooth transition zones between classes, which is required when delineating surface types with high within-class variability and inter-class similarity (van der Linden et al. 2007). The value of the per-pixel support vector machine classifier (SVC) in combination with airborne hyperspectral data for mapping spectrally complex urban surface types has been demonstrated (van der Linden et al. 2007; Waske et al. 2010; Tuia and Camps-Valls 2011). However, assigning a pixel to one thematic category ignores the presence of mixed pixels. This generally produces mapping inaccuracies, even when using high spatial resolution data (Roessner et al. 2001; van der Linden et al. 2007). Due to the dominance of mixed pixels within medium spatial resolution imagery, per-pixel classifiers will likely not be the first choice for urban land cover assessments from future hyperspectral satellite data (Figure I-3). Quantitative mapping approaches – also referred to as sub-pixel mapping approaches – transform the spectral information of single pixels into physically meaningful quantities of surface fractions and thematically meaningful surface types, and thus account for spectrally mixed pixels. In this context, several sub-pixel mapping techniques have been suggested, including spectral unmixing or regression. Multiple endmember spectral mixture analysis (MESMA; Roberts et al. 1998) is probably the most commonly used unmixing technique
in the urban context (Powell et al. 2007; Franke et al. 2009; Roberts et al. 2012), and relies on the iterative decomposition of mixed pixels into fractional abundances of pure material spectra, i.e., endmembers (EMs). As alternative, the value of different non-parametric and nonlinear machine learning regression algorithms for quantification of urban land cover has been demonstrated (Walton 2008; Esch et al. 2009; Van de Voorde et al. 2009). Methods include the SVM implementation for quantitative prediction, i.e., support vector regression (SVR; Schölkopf and Smola 2002). Compared to MESMA, which only requires a spectral library of EMs, regression approaches rely on appropriate continuous training information, i.e., pairs of spectral signatures and mixing fractions, for function approximation. This information cannot be labeled in the image data itself. A common strategy is to combine pixel spectra with spatially aggregated land cover fractions from a high resolution reference map. However, this approach depends on the availability of such a reference map and on the accurate co-registration of both data sets. Furthermore, the universality of the approach, i.e., the separation of model training – by means of universal spectral databases – from model application and independent validation, is not given. Such a framework is important once the reliability and transferability of regression models to imagery with different spatial resolutions, spatial extents, and acquisition date is explored. Methodological developments toward a universal use of machine learning-based regression approaches are therefore of importance, particularly with regard to the development of operational processing schemes that will be needed once spaceborne hyperspectral data from urban areas become available.
Figure I-3: Extent of spectral mixing within HyMap data at 3.6 m and simulated EnMAP data at 30 m resolution for a dense-urban and a peri-urban area.
2 Conceptual framework
2.1 Motivation
Rapid urbanization and the need to promote the sustainability of cities have created a special challenge for urban remote sensing. The production of maps that capture the diversity of built-up and natural components relevant for urban environmental research or urban management is an essential task of image data processing. Existing global urban map products delineate urban areas by extent, but fail to provide descriptions of different land cover types within the city limits. Future research in urban remote sensing therefore needs to focus on the development of reliable, standardized, and regularly updated mapping products that capture the land cover heterogeneity of human settlements globally.
During the last decade, the value of airborne imaging spectrometer data for mapping detailed urban surface properties has been demonstrated. Data acquired by upcoming hyperspectral satellite missions will create the opportunity to proceed from experimental case studies toward global applications. However, the change in spatial scale from high to coarser spatial resolution hyperspectral data will complicate urban land cover assessments. Investigating benefits of future hyperspectral satellite data over broadly available multispectral satellite data, but also the challenges that will arise from the larger amount of spectrally mixed pixels compared to airborne hyperspectral acquisitions, is of great importance, particularly regarding the potential to derive new urban land cover products. Operational processing schemes form the basis for deriving standardized map products. With regard to recent developments in image processing techniques, machine learning-based analysis concepts have become increasingly established in remote sensing. In the context of heterogeneous urban environments, advanced quantitative methods to estimate sub-pixel land cover fractions are of particular interest. It is therefore crucial to test and enhance advanced quantitative processing techniques from the field of machine learning with respect to reliability and universality when applied to data of different spatial resolutions, spatial extents, and temporal acquisitions. This may ultimately contribute to the development of an operational processing scheme to derive reliable urban land cover products from future spaceborne imaging spectrometer data.
2.2 Objectives
The scientific focus of this work was to quantify urban land cover by means of machine learning and imaging spectrometer at multiple spatial scales. Experiments considered
innovative methodological developments and opportunities for novel applications. Thus, findings advance current research in urban remote sensing, especially regarding the need for new urban land cover products.
Given the high suitability of machine learning algorithms for effectively exploiting hyperspectral imagery, the first part of this work aimed at developing a universal mapping framework based on SVR for the quantification of urban land cover. The following specific research question was addressed:
Research question I: Does the combination of SVR with synthetically mixed training data allow the reliable quantification of urban land cover from imaging spectrometer data at multiple spatial scales?
To embed SVR into a universal mapping framework, the concept of combining SVR with synthetically mixed training data was introduced. This workflow separates regression model training – based on synthetic data generated from a spectral library – from model application and independent validation, and thus implements the idea of a universal mapping technique. The method’s capability to make best use of the latent information content of hyperspectral data was tested by quantifying urban land cover into thematically meaningful, yet spectrally complex urban surface types such as roof, pavement, grass, and
tree. The method’s performance was tested by comparisons to other advanced machine learning regression techniques and MESMA. The method’s universality was tested with respect to the adaptability and transferability of regression models when proceeding from high spatial resolution airborne to coarser spatial resolution spaceborne data.
Given the forthcoming availability of hyperspectral satellite data for urban remote sensing, the second part of this work aimed at exploring the potential of the EnMAP mission for urban land cover assessments. The following specific research question was addressed:
Research question II: What type of urban land cover information can be extracted from EnMAP data, and how reliable are the mapping results?
Simulated EnMAP data at 30 m resolution were exploited based on the SVR mapping framework. Emphasis was put on the possibility to map and extend the universal VIS scheme. In addition, benefits and limitations of EnMAP data for urban mapping were assessed by comparison with higher spatial resolution airborne data and with existing multispectral data of similar spatial resolution. The quantification of land cover along the entire urban-rural gradient of Berlin followed a traditional concept for studying ecological
patterns and processes (McDonnell and Pickett 1990). In doing so, a link to the value of EnMAP for urban environmental applications was provided.
2.3 Study area and materials
With approximately 3.3 million people and an area of 892 km², Berlin is the largest city in Germany. The history of Berlin and its hinterland has led to a multifaceted urban-rural environment. During the Second World War, the original fabric of the city was heavily destroyed. Later, during the political division into East- and West-Berlin, a polycentric development with two core areas of differing urban composition characterized the city. After reunification and the establishment of Berlin as the capital of Germany, large scale building activities in central areas and suburbanization through reconnecting the city with its hinterland took place (Sukopp 1990; Schulz 2000). Extensive developments of green spaces have taken place since the 19th century and complement the diversity of the cityscape. Berlin counts more than 2500 public parks, 430,000 street trees, and 930 allotment gardens (SenStadt 2014c).
The study area depicts a subset of Berlin’s urban rural-gradient (Figure I-4). More specifically, this region covers an area of approximately 5.5 by 22.8 km and reaches from
Figure I-4: Study region along Berlin’s urban-rural gradient (Background: Digital orthophotos; Source: World Imagery, Esri). The outline of the study region is determined by the spatial extent of the airborne imaging spectrometer data used for experiments.
the inner-city core of the district Charlottenburg-Wilmersdorf (52.51°N, 13.30°E) to the rural area in Brandenburg’s district Teltow-Flaeming (52.36° N, 13.31° E). The city area was part of the former West-Berlin and captures a variety of urban structure types of multifunctional use, including a commercial center, residential areas of different densities, industrial zones, sport grounds, green spaces, street trees, and water bodies. The urban hinterland was part of the former German Democratic Republic and is characterized by agricultural land, forest areas, small municipalities, and newly built industrial complexes. Two HyMap images with 128 spectral bands and 3.6 m and 9 m resolution were acquired during the HyEurope 2009 flight campaign led by the German Aerospace Center. A simulated spaceborne EnMAP scene with 30 m resolution was derived from the 9 m HyMap data. A spectral library consisting of various anthropogenic and natural materials relevant for the study area was derived from the 3.6 m HyMap image. A high resolution reference land cover map for validation was derived using cadastral information, a digital surface model, orthophotos, and field mapping information.
2.4 Structure
This thesis consists of five chapters and one appendix: The Introduction (Chapter I) is followed by three core research chapters (Chapter II-IV), and a Synthesis (Chapter V). The core research chapters (see list below) are stand-alone manuscripts, which were either published or submitted to international peer-reviewed journals. The Synthesis presents a summary of the entire work, draws more general conclusions, and provides applications and future directions for research. The appendix includes a user guide of synthMix-SVR, which is an IDL-based tool that implements the methodological framework developed during this doctoral research.
Chapter II Okujeni, A., van der Linden, S., Tits, L., Somers, B., & Hostert, P. (2013). Support vector regression and synthetically mixed training data for quanti-fying urban land cover. Remote Sensing of Environment, 137, 184-197.
Introduces the concept of combining support vector regression with synthetically mixed training data for quantifying urban land cover using airborne hyperspectral data. A baseline comparison to the traditional Multiple Endmember Spectral Mixture Analysis is provided.
Chapter III Okujeni, A., van der Linden, S., Jakimow, B., Rabe, A., Verrelst, J., & Hostert, P. (2014). A comparison of advanced regression algorithms for
quantifying urban land cover. Remote Sensing, 6, 6324-6346.
Compares the utility of five advanced regression techniques combined with synthetically mixed training data for quantifying urban land cover. Airborne hyperspectral data at two different spatial resolutions are used to investigate the possibility to adapt the approach to amplified mixing scenarios.
Chapter IV Okujeni, A., van der Linden, S., & Hostert, P. (in review)*. Extending the Vegetation-Impervious-Soil model using simulated EnMAP data and machine learning. Remote Sensing of Environment.
Illustrates the potential of future EnMAP data for quantifying land cover along the urban-rural gradient. Insights into benefits and limitations are addressed by comparisons to results from higher spatial resolution hyperspectral and coarser spatial resolution multispectral data.
*A revised version of this chapter was meanwhile published in: Okujeni, A., van der Linden, S., & Hostert, P. (2015). Extending the vegetation-impervious-soil model using simulated EnMAP data and machine learning. Remote Sensing of Environment, 158, 69-80.
Chapter II:
Support vector regression and synthetically
mixed training data for quantifying urban land
cover
Remote Sensing of Environment, Volume 137, October 2013, Pages 184–197
Akpona Okujeni, Sebastian van der Linden, Laurent Tits, Ben Somers and Patrick Hostert
© 2013 Elsevier Inc. All rights reserved. DOI: 10.1016/j.rse.2013.06.007
Received 16 October 2012; Revised 24 April 2013; Accepted 9 June 2013; Available online 19 July 2013.
Abstract
Exploiting imaging spectrometer data with machine learning algorithms has been demonstrated to be an excellent choice for mapping ecologically meaningful land cover categories in spectrally complex urban environments. However, the potential of kernel-based regression techniques for quantitatively analyzing urban composition has not yet been fully explored. To a great extent, this can be explained by difficulties in deriving quantitative training information that reliably represents pairs of spectral signatures with associated land cover fractions needed for empirical modeling. In this paper we present an approach to circumvent this limitation by combining support vector regression (SVR) with synthetically mixed training data to map sub-pixel fractions of single urban land cover categories of interest. This approach was tested on Hyperspectral Mapper (HyMap) data acquired over Berlin, Germany. Fraction estimates were validated with extensive manual mappings and compared to fractions derived from Multiple Endmember Spectral Mixture Analysis (MESMA). Our regression results demonstrate that the sets of multiple mixtures yielded high accuracies for quantitative estimates for four spectrally complex urban land cover types, i.e., fractions of impervious rooftops and pavements, as well as grass- and tree-covered areas. Despite the extrapolation uncertainty of SVR, which resulted in fraction values below 0% and above 100%, physically meaningful model outputs were reported for a clear majority of pixels, and visual inspection underpinned the quality of produced fraction maps. Statistical accuracy assessment with detailed reference information for 92 urban blocks showed linear relations with R² values of 0.86, 0.58, 0.81 and 0.85 for the four categories, respectively. Mean absolute errors (MAE) ranged from 6.4 to 12.8% and block-wise sums of the four individually modeled category fractions were always around 100%. Results of MESMA followed similar trends, but with slightly lower accuracies. Our findings demonstrate that the combination of SVR and synthetically mixed training data enable the use of empirical regression for sub-pixel mapping. Thus, the strengths of kernel-based approaches for quantifying urban land cover from imaging spectrometer data can be well utilized. Remaining uncertainties and limitations were related to the known phenomena of spectral similarity or ambiguity of urban materials, the spectral deficiencies in shaded areas, or the dependency on comprehensive and representative spectral libraries. Therefore, the suggested workflow constitutes a new flexible and extendable universal modeling approach to map land cover fractions.
1 Introduction
Research on the structure and functioning of cities is of great importance, particularly considering the rates of current and projected global urbanization (Alberti 2005; Grimm et al. 2008; Pickett et al. 2011). Detailed descriptions of urban surface properties, i.e., beyond the broad differentiation of “urban land” and “non-urban environments”, are crucial for developing a more thorough understanding of the integrated human-natural ecosystem (Cadenasso et al. 2007). The spatial distribution, abundances and conditions of different impervious, pervious and vegetation cover types, for example, directly influence processes related to urban climate (Chudnovsky et al. 2004; Gluch et al. 2006), hydrology (Arnold and Gibbons 1996; Pauleit and Duhme 2000) or biodiversity (Blair 1996; McKinney 2002).
Data from municipal authorities provide detailed information on urban surface characteristics at the scale of urban blocks, a preferred spatial unit for urban management purposes or urban environmental studies (Pauleit and Duhme 2000; Heiden et al. 2012). Data collections are, however, often based on cost- and time-intensive field surveys and are subject to irregular updates. In this context, remote sensing constitutes a supplemental technique to derive information on the physical composition of urban areas (Jensen and Cowen 1999; Miller and Small 2003; Maktav et al. 2005).
Data acquired by various multispectral spaceborne sensors, which range from very high to moderate spatial resolution and high acquisition frequency, have been applied for mapping urban land cover (Rashed et al. 2003; Thomas et al. 2003; Powell et al. 2007; Myint et al. 2011). Many studies followed the V-I-S model by Ridd (1995), a framework used to universally characterize three major urban surface components, i.e., “vegetation”, “impervious surfaces” and “soil”. However, the coarse spectral resolution of multispectral data often limits the accurate distinction of different impervious, pervious and vegetation surface cover types (Herold et al. 2003; Small and Lu 2006; Myint et al. 2011). Therefore, Small (2004) and Small and Lu (2006) proposed the Substrate Vegetation Dark surface (SVD) model, which characterizes the urban environment by biophysical surface reflectance properties rather than by land cover types. Nevertheless, linking spectral with thematic information remains desirable, especially when high resolution spectral information is available. Other studies overcame some of the limitations of multispectral data by analyzing high-resolution images with object-based strategies (Shackelford and
Davis 2003; Thomas et al. 2003; Myint et al. 2011). Still others use complex multi-sensor and multi-temporal approaches that extend the spectral feature space or take advantage of information beyond the spectral domain (Griffiths et al. 2010; Taubenböck et al. 2012). Even when employing such fusion approaches we need to better understand the opportunities and limitations of high resolution spectral data.
The increasing availability of imaging spectrometer data from urban areas has allowed for a more detailed mapping of thematic surface properties on a purely spectral basis. Several studies have demonstrated the great potential of continuous spectral information for fine-scale classifications, including various man-made materials and vegetation species (Herold et al. 2003; Franke et al. 2009). Other studies have included rather broad-scale classifications when considering ecologically meaningful sub-categories, e.g., impervious rooftops and pavements, pervious soils, and grass- and tree-covered areas (Roessner et al. 2001; van der Linden and Hostert 2009). Thus far such investigations have been more experimental in nature because currently available high quality data sets are almost exclusively constrained to airborne acquisitions with limited spatial coverage and temporal frequency. This is likely to change with the advent of new hyperspectral satellite missions, e.g., the German Environmental Mapping and Analysis Program (EnMAP; Stuffler et al. 2007; Stuffler et al. 2009) or the Hyperspectral Infrared Imager (HyspIRI; NRC 2007; Roberts et al. 2012). Such systems will provide imaging spectrometer data of a large spatial extent on a timely and frequent basis, which will open up new opportunities for urban remote sensing applications (Heldens et al. 2011). Ground sampling distances (GSDs) in the range of 30 to 60 m will, however, complicate studies, especially in spatially heterogeneous environments. Robust analysis approaches with universal applicability and best possible transferability on data of coarser spatial resolution will be needed to best utilize imagery acquired by future spaceborne imaging spectrometers.
Despite this promising development, using imaging spectrometer data for urban applications remains a challenge. The high number of materials, their varying conditions, as well as the surfaces’ anisotropic reflectance behavior lead to vast spectral diversity. As a consequence, different spectral phenomena such as high within-class variability of individual materials, complex multi-modal class compositions, and high inter-class similarity or ambiguity complicate urban land cover assessments (Herold et al. 2004; Herold et al. 2006; Schiefer et al. 2006; Heiden et al. 2007). This complexity is further aggravated by the high amount of spectrally mixed pixels typical for urban remote sensing data. The extent of spectral mixing, i.e., the number of mixed pixels and the abundance of
different materials contributing to the mixed signal, strongly depends on the fine-scale spatial patterns of different urban objects, and on the GSD of the respective sensor (Small and Lu 2006).
Spectrally mixed signatures produce inaccuracies in per-pixel classification approaches, which assign each pixel to a discrete urban land cover category (Small 2001; Powell et al. 2007). This applies even to investigations on airborne or high resolution spaceborne remote sensing data of 4 m GSD (Small 2003; van der Linden et al. 2007). Hence, quantitative mapping of urban land cover components constitutes an alternative concept that becomes particularly relevant once coarser resolution spaceborne imaging spectrometer data becomes available. In general, quantitative approaches account for sub-pixel mixing by transforming reflectance measurements of individual pixels into both physically meaningful quantities of surface fractions and thematically meaningful land cover types. Multiple Endmember Spectral Mixture Analysis (MESMA; Roberts et al. 1998) is probably the most commonly used technique to systematically decompose mixed pixels into fractional abundances of distinct spectrally pure endmembers (EMs). Within-class spectral variability is accounted for by using an extensive iterative procedure with multiple linear mixture models (Somers et al. 2011). In the context of imaging spectrometry of urban areas, MESMA was successfully used to quantify thematically detailed land cover types or to derive material-oriented fraction maps (Franke et al. 2009; Roberts et al. 2012). Support vector machines (SVMs) have received increasing attention in the remote sensing community; SVMs are supervised, non-parametric statistical learning techniques designed to solve classification and regression problems (Vapnik 1995; Schölkopf and Smola 2002). A recent review of implementations and applications of SVMs was provided by Mountrakis et al. (2011). As applied to remote sensing data, SVMs have shown great capabilities to model complex multi-modal, nonlinear data distributions in high-dimensional spectral feature spaces (Huang et al. 2002; Melgani and Bruzzone 2004; Pal and Mather 2006). Thus far, the advantage of kernel-based support vector classification (SVC) for a per-pixel-based mapping of spectrally complex urban land cover categories from imaging spectrometer data has been demonstrated (van der Linden et al. 2007; Waske et al. 2010; Tuia and Camps-Valls 2011). However, the potential of kernel-based support vector regression (SVR) as a quantitative technique for analyzing the complex hyperdimensional urban feature space with high spectral and spatial heterogeneity has not yet been fully explored. Given a set of adequate training samples, SVR allows us to estimate a continuous output variable, such as sub-pixel fractions of a single land cover
category. To date, most studies have used SVR for predicting biophysical/chemical plant parameters by relating spectral information to in situ samples (Camps-Valls et al. 2006; Tuia et al. 2011; Verrelst et al. 2012). Few studies have adopted SVR to quantify fractions of broad urban categories in 30 m multispectral satellite imagery using reference information from very high resolution land cover maps (Walton 2008; Esch et al. 2009). This latter approach fully relies on the availability of very accurately co-registered, very high resolution reference. Often such data – and especially accuracy – is not given when high resolution imagery from spatially heterogeneous environments is used as input, e.g., for airborne line scanner data from urban areas. Moreover, reliable sub-pixel fractions cannot be labeled in the data itself or mapped in the field. These difficulties in finding reliable quantitative training information explain the lack of studies that use regression techniques for sub-pixel mapping. To the best of our knowledge, no investigations have been carried out where SVR was used together with imaging spectrometer data to derive sub-pixel fraction maps of spectrally complex urban land cover categories.
In this paper, we propose the combination of support vector regression with synthetically mixed training data to quantify urban land cover. The idea behind our approach was inspired by Foody and Mathur (2006), who suggested generating class-dominated spectral mixtures using spectral averaging to improve SVC training. Based on imaging spectrometer data and a corresponding spectral library, we consecutively derived fraction maps with SVR for single urban land cover categories of interest, so-called target categories. For each target category we generated a synthetically mixed training data set from the spectral library, which was subsequently used for SVR model training. This training set consists of pure original spectra and multiple-binary mixed spectra representing a range of mixing fractions between 0 and 100% of the target category against all remaining background cover types. To generate a universal model that accounts for spectral variability, the spectral variations within each land cover category, e.g., varying illumination and shade, or differences in material composition and condition, were included and learned from appropriate training. We thus fulfilled the need for quantitative training information required for empirical modeling, and we overcame the mentioned difficulties of using regression techniques for sub-pixel mapping. Subsequently, each SVR model was applied to the image data to derive the desired fraction map per target category. The objective of this study was to quantify spectrally complex and ecologically meaningful urban land cover categories using a combination of SVR and synthetically mixed training data. We thus explore whether (machine learning-based) regression techniques can be used
for sub-pixel mapping with training data derived from commonly available sources such as spectral libraries. We used airborne Hyperspectral Mapper (HyMap) data acquired over Berlin, Germany, to consecutively estimate fractions of two different impervious categories, i.e., rooftops (roof) and paved surfaces (pavement), including roads, sidewalks and parking lots. We further differentiated two vegetation categories, i.e., grass and tree. Our objective was tested by comparing fraction estimates at pixel and urban block scale to maps from very high resolution reference data. To explore the quality of results compared to established approaches we evaluated our maps to results derived with MESMA.
2 Data
2.1 Imaging spectrometer data and pre-processing
Image data was acquired by the HyMap sensor over Berlin on 20th August 2009 at approximately 11:45 local time. HyMap covers the spectral region between 440 and 2500 nm, with 128 bands and bandwidths between 10 and 20 nm. The sensor’s field of view (FOV) is 60°, and the instantaneous field of view (IFOV) is 2.5 mr along track and 2.0 mr across track (Cocks et al. 1998). The aircraft was flown from south to north at an altitude of 2005 m (AGL), resulting in raw pixels of 5 × 4 m at nadir. Given this setup, an area of 2.3 by 22.8 km was covered, representing a subset of Berlin’s urban-rural gradient (Figure II-1). A great variety of urban structure types were captured, including a commercial center, residential areas of varying densities, green spaces, water bodies, sport grounds, industrial areas, as well as agricultural areas and forest patches.
Pre-processing of the HyMap image encompassed system correction (Cocks et al. 1998) and atmospheric correction (Richter and Schläpfer 2002) by HyVista Corporation and the German Aerospace Center (DLR). Data were delivered in reflectance values with a reduced number of 126 bands. We performed a parametric geocoding (Schläpfer and Richter 2002) using a 3.6 m resolution digital surface model (DSM; acquired in January 2008 and resampled from 0.5 m). This cell size also constitutes the final spatial resolution of the ortho-rectified HyMap image. The slightly higher output resolution than that of the raw image was chosen to better preserve a higher portion of the spectral information during geometric processing (Schläpfer and Richter 2002). Based on 15 independent control points from digital orthophotos (DOPs; acquired in April 2009 with 0.1 m resolution), we calculated a spatial accuracy (RMSE) of 2.91 and 3.08 m in easting and northing.
Figure II-1: HyMap footprint covering a subset of Berlin’s urban gradient (R = 833 nm, G = 1652 nm, B = 632 nm) and validation areas 1-3 (white polygons indicate urban blocks used for validation).
2.2 Image spectral library
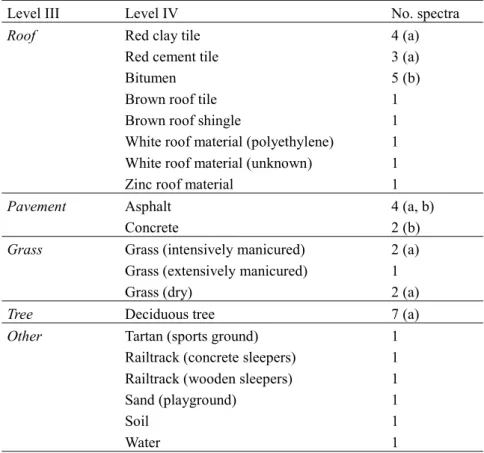
A comprehensive spectral library was developed from the HyMap image. We included major characteristic man-made and natural surface materials relevant for the study area. The library was structured according to a slightly modified hierarchical categorization scheme for urban areas as proposed by Roessner et al. (2001) and Heiden et al. (2007). Levels I and II represent rather broad land cover categories such as impervious, pervious or vegetation. Roof, pavement, grass and tree correspond to Level III and represent the more thematically detailed urban land cover categories of interest in this work. Level IV forms the spectral basis for the analysis (Table II-1).
The initial collection of around 300 pure material spectra (mean values of manually delineated spectrally homogeneous regions of interest in the HyMap image) was based on
Table II-1: Hierarchically structured image spectral library.
Level III Level IV No. spectra
Roof Red clay tile 4 (a)
Red cement tile 3 (a)
Bitumen 5 (b)
Brown roof tile 1
Brown roof shingle 1
White roof material (polyethylene) 1 White roof material (unknown) 1
Zinc roof material 1
Pavement Asphalt 4 (a, b)
Concrete 2 (b)
Grass Grass (intensively manicured) 2 (a)
Grass (extensively manicured) 1
Grass (dry) 2 (a)
Tree Deciduous tree 7 (a)
Other Tartan (sports ground) 1
Railtrack (concrete sleepers) 1 Railtrack (wooden sleepers) 1
Sand (playground) 1
Soil 1
Water 1
Multiple spectra per material considered to account for spectral variability due to variations in (a) illumination and shading effects, and (b) material condition or composition.
expert knowledge and auxiliary information, including field mapping data, DOPs and Google Street View. We considered the spectral variability of materials, e.g., variations in brightness caused by varying illumination and shading effects, or variations due to differences in material condition and composition. In a second step, we iteratively developed the final image spectral library used for processing. To create a subset of spectra from the initial collection that best describes the spectral diversity of the study region, we manually selected a representative standard spectrum (spectrum close to the mean within the collection of multiple material spectra) for materials with frequent spatial occurrence. We adopted this subset of spectra to derive fraction maps using SVR and synthetically mixed training data. After visual inspection and statistical accuracy assessment of results, we added spectra to account for missing materials. Spectra were also added to account for illumination and shading effects or variations in condition and composition. The final image spectral library consists of 41 material spectra, of which 17 were assigned to the
roof category, 6 to the pavement category, 5 to the grass category and 7 to the tree
category. Six spectra were assigned to a so-called other category. This additional category, with mainly non-vegetated pervious surfaces of marginal spatial occurrence, did not constitute a category of interest for this analysis.
2.3 Reference data
Most analyses of urban environmental indicators by municipal authorities in Berlin are performed on a block scale, and related maps are presented in the Urban and Environmental Information System (UEIS; SenStadt 2013a). These urban blocks, therefore, formed the spatial unit to statistically validate the results in three regions of various urban structure types (Figure II-1). Validation area 1 represents a high-density commercial and housing zone (high-density urban area), area 2 represents a medium-density residential and industrial zone (medium-medium-density urban area), and area 3 represents a low-density residential zone with mainly detached and semi-detached housing patterns and private gardens (low-density urban area). The effect of urban surface geometry, e.g., building displacement at large view-angles, constitutes a significant drawback for any wide-swath sensor over urban areas. When compared to reference data (e.g., cadastral information), the three-dimensional geometry produces inaccuracies related not to the spectral information content, but rather to unavoidable geometric distortions. We therefore only selected blocks within a ±10° off-nadir region to minimize effects of the urban 3D-geometry on comparisons between HyMap and reference data. By limiting our evaluation to that area of the scene where almost entirely spectral effects (and not geometric) influence our accuracy measures, we were able to determine the spectral effectiveness of the SVR approach. The effects of urban 3D-geometry on wide-swath sensor data and the related performance limits of any algorithm in urban environments is beyond the scope of this work and exhaustively described in van der Linden and Hostert (2009). Reference fractions of Level III land cover categories of interest (see Table II-1) were calculated for each urban block. The spatial extent of buildings was extracted from Berlin’s digital cadastre (SenStadt 2013b). Vegetation types and paved impervious grounds were manually delineated at 1:500 map scale based on the available DSM and DOPs. Whereas the building data set was regarded as spatiotemporal-invariant, the temporal shift of the DSM and DOPs to the Hymap image may have influenced validation to some extent. The final reference data set encompassed a total number of 92 urban blocks with areas between 2,530 and 65,950 m², of which there were 45 building blocks of different urban structure type, 37 street polygons including wide main streets and small side roads, and 10 green spaces consisting of parks, allotment gardens or sport grounds.