Hierarchical multi-label news article classification with
distributed semantic model based features
Ivana Clairine Irsan a,1,*, Masayu Leylia Khodra a,2
a Institut Teknologi Bandung, Bandung, Indonesia 1[email protected]; 2 [email protected] * corresponding author
1.
Introduction
News articles are intended for certain groups of people based on their interest towards some issues. The news classification could affect whether that the news reach its targeted reader or not. The problem is that there are many news with more than one category. For example, the news of a government officer, who is suspected of using illegal drugs can be categorized as both politics and crime label. Therefore, instead of using single label classifier, multi-label classifier is needed to do the text classification task
[1]-[3].
Problem transformation and also algorithm adaptation can be used in multi-label classification [4] [5]. Problem transformation approach breaks multi-label problem into several single label classification problems. On the other hands, algorithm adaptation approach will classify the data using specifically crafted algorithm for solving one undivided task of multi-label classification problem. Calibrated Label Ranking (CLR) [6] and Binary Relevance (BR) [7] were used as experiment features to solve the multi-label classification in this experiment as CLR may gave the best result [8][5] and BR was effective to solve error propagation problem in hierarchical classification [8].
Implementation of hierarchical classification method may improve the performance of the multi-label text classification model. This method was previously used to build multi-multi-label classifier where the classes are organized in a hierarchy [1][9][10][11]. The best performance was achieved when hierarchical A R T I C L E I N F O A B S T R A C T
Article history Received March 16, 2018 Revised February 4, 2019 Accepted February 5, 2019 Available online March 24, 2019
Automatic news categorization is essential to automatically handle the classification of multi-label news articles in online portal. This research employs some potential methods to improve performance of hierarchical multi-label classifier for Indonesian news article. First potential method is using Convolutional Neural Network (CNN) to build the top level classifier. The second method could improve the classification performance by calculating the average of the word vectors obtained from distributed semantic model. The third method combines lexical and semantic method to extract documents features, which multiplied word term frequency (lexical) with word vector average (semantic). Model build using Calibrated Label Ranking as multi-label classification method, and trained using Naïve Bayes algorithm has the best F1-measure of 0.7531. Multiplication of word term frequency and the average of word vectors were also used to build this classifiers. This configuration improved multi-label classification performance by 4.25%, compared to the baseline. The distributed semantic model that gave best performance in this experiment obtained from 300-dimension word2vec of Wikipedia’s articles. The multi-label classification model performance is also influenced by news’ released date. The difference period between training and testing data would also decrease models’ performance.
This is an open access article under the CC–BY-SA license.
Keywords
Multi-label classification
Hierarchical multi-label classification CNN
Word embedding News
multi-label classifier was built using Calibrated Label Ranking method and trained with Naïve Bayes algorithm [8]. Naive Bayes has promising performance despite its simplicity [8][12].
Another problem in hierarchical classification is error propagation. This phenomenon occurs when the top level classifiers falsely classified a news to its labels [1]. False positive error at the top level would give direct impact to hierarchical multi-label classifier’s precision, while the false negative error would affect its recall. Reducing false classification on the top level could improve classifier’s overall performance
[8][1]. In order to use text document as training and testing data, documents need to be represented as vector of numbers. This experiment proposed to combine lexical and semantic approach when representing data as vectors, as there are hints that this combination could improve the classifier’s performance [13]-[15].
This paper implemented several methods that potentially improve performance of the hierarchical multi-label classification top-level classifier. First method trains the multi-label classifier using deep learning algorithm, as Convolutional Neural Network (CNN) gave a promising result in text classification
[16]-[18]. Second method uses distributed semantic model to represent documents, due to its ability to encode semantic features of words in their dimensions [19][20]. The final approach combines lexical and semantic representation by using word term frequency as word vector multiplier to build document representation. In this experiment, approach toward the lexical method was to calculate each feature’s term frequency [21], while distributed semantic model was used to provide features’ weight from semantic representation side. Distributed semantic model that was used in this experiment is word2vec
[22][23]. Weight obtained by calculating term’s frequency will be multiplied by the average of the feature’s word vector found in the word2vec model. Result of the multiplication will be used as input features to build the classifier.
2.
Method
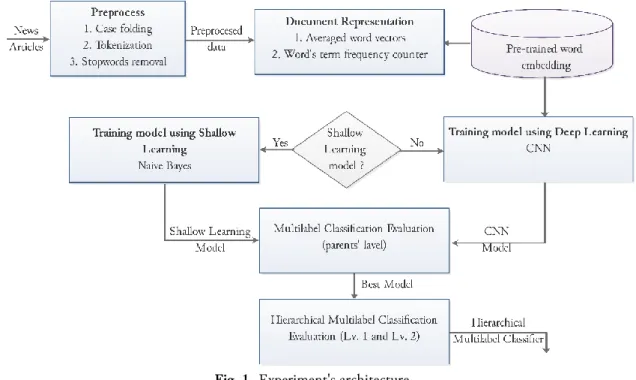
Fig. 1 shows the architecture of the experiment. Three steps of standard preprocessing method were implemented towards the raw news articles. They are case folding, tokenization, and removing stop words from the training data. After preprocessing, the news were represented as numbers.
Fig. 1. Experiment's architecture
There are two approaches that are used in this experiment, which are lexical and semantic approaches. In lexical approach, we calculated terms’ frequency, while the semantic approach utilized pre-trained word embedding to determine words’ weight. In this experiment, models will be build using shallow
learning and deep learning method. Naïve Bayes algorithm [24] was used as shallow learning model, while CNN [16] was used to represent the deep learning approach. Model built in this experiment were evaluated by calculating its F1-score [25][1].
First phase of the experiment aims to determine whether shallow learning or deep learning model give better performance by comparing both model’s F1-score. Each algorithm will be trained using 2 sets of datasets. Model with better performance will be implemented to replace previous level-1 classifier in the hierarchical multi-label classifier. After new top-level classifier is embedded to the hierarchical multi-label classifier, overall performance will be evaluated using F1-measure for hierarchical multi-label classifier. Summary of the factors used in this experiment can be observed in Table 1.
Table 1. Experiment factors
Factors Experiment variable
Multilabel classification handling Calibrated Label Ranking, Binary Relevance Classification algorithm Naïve Bayes, CNN
Hierarchical structure type Tree
Weighting method TF-IDF (baseline), word2vec, TF.word2vec Performance evaluation method F1-measure
2.1.Dataset
There are 2 sets of data used in this experiment. Table 2 and Table 3 represent the fist (Dataset1) and second (Dataset2) datasets respectively. Dataset1 in this experiment is crafted by manually annotating 677 Indonesian news articles. These news were arranged to be a balanced dataset for multi-label classification, and were used as training and testing data.
Table 2. Details of Dataset1
Training Data Testing Data
# of news 677 131
Category (Level 1) 10 10
Category (Level 2) 10 * 4 = 40 10 * 4 = 40
Cardinality 1.7681 1.527
Published date April 2014 – February 2016 March 2016 – May 2016
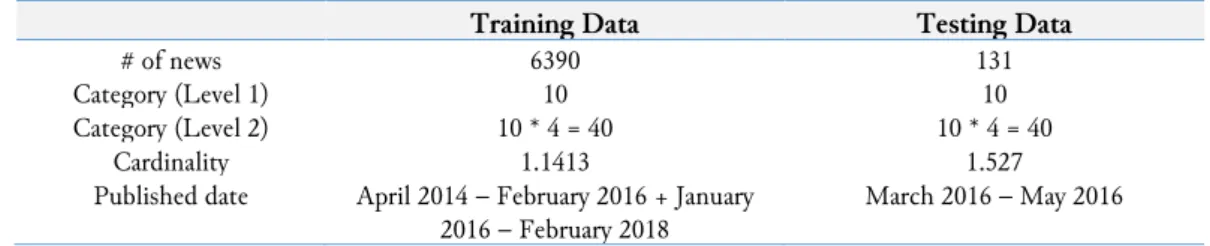
Table 3. Details of Dataset2 (Dataset1 + 5713 new data)
Training Data Testing Data
# of news 6390 131
Category (Level 1) 10 10
Category (Level 2) 10 * 4 = 40 10 * 4 = 40
Cardinality 1.1413 1.527
Published date April 2014 – February 2016 + January 2016 – February 2018
March 2016 – May 2016
To create Dataset1, we collected news which were written between April 2014 and May 2016. In total, there were 808 news manually annotated, 15 news for each smallest categories. After annotation, those news were split into training data and testing data. Cardinality for the training and testing data were 1.7681 and 1.527 respectively. Cardinality represents how many categories a news has on average.
Dataset1 were already used in [8] to build hierarchical multi-label classification. Using model built in said experiment, Dataset2 was manually annotated based on the result of the classification. After the model predicted a news’ categories, manual check was performed to ensure that the classification result is correct and it has covered all related categories. 5713 articles were added to the training data in Dataset1, resulting in Dataset2. Testing data used for model trained using Dataset1 and Dataset2 was identical, no news were added to the testing data.
There are 10 classes used as top-level classifier, with each top level classifier is a parent of four leaves-node. Details of classes used in this experiment could be seen in Fig. 2. As can be seen in the hierarchical structure, there are 4 categories for each top level categories, which contains of 3 specific sub-categories and 1 other category. For example, Health category has 3 specific sub-categories, which are Virus, Facility, and Alternative Medicine. Any news related to Health issues but not suitable for these 3 categories (i.e. malpractice, health insurance) should be categorized as others.
ROOT
Education Politics Law & Crime Social & Culture Sports Science & Technology Entertain-ment Economy & Business Health Disaster & Accident Badminton Olympics Investment / Loan Economy Celebrity Film Science Gadget Narcotics Corruption Violence / Theft Election Figure / political party Religion Event Virus Facility Alternative Medicine University Exam Child education Natural Disaster Accident Others International Others Others Art & Culture Others Soccer Others Inovation Others Travel & Culinary Others International Others Epidemic Others Others
Fig. 2. Classes details 2.2.Document representation
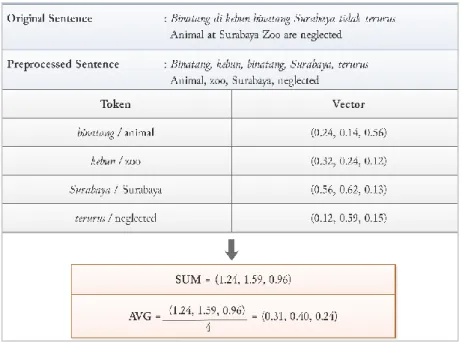
This paper represents documents as a bag of words, hence ignoring sentences’ delimiters and paragraphs. The vocabulary extracted from the training data would be weighted using word vectors average, were obtained from pre-trained word embedding. There are three pre-trained word embedding that used in this experiment. There were 2 pre-trained word embedding model that was trained using GloVe [26] method, with 300 and 700 dimension of vectors each. These models were the results of [27], and were built using Indonesian news articles as training data. The other pre-trained word embedding model that was used in this paper was a 300 dimension word2vec model trained using Wikipedia articles, generated from FastText research [28][29].
In addition to averaging the word vectors that represent the semantics meaning between words, this paper would also utilize word term frequency (raw TF) to represent lexical value of the document. We combine these two things by multiplying word term frequency and the word vector average. Illustration of this document representation is shown in Fig. 3.
2.3.
Model for text classification
Our research use transformation problems approach to solve the multi-label classification problem. We use Calibrated Label Ranking (CLR) for shallow learning model, and Binary Relevance (BR) approach for the deep learning model [30].
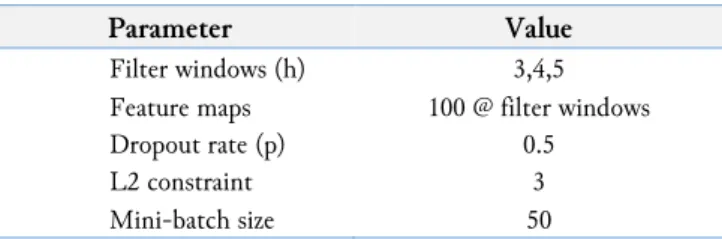
In this paper there are two methods: shallow learning and deep learning. For the shallow learning model, we built multi-label classifier using Naïve Bayes (NB) algorithm, while Convolutional Neural Network (CNN) was used to build the deep learning model. CLR-NB was used because it was the configuration that gives best performance in our previous work [8], while BR was chosen to transform CNN models because of BR’s simplicity. We built CNN model with one layer of convolution and parameters [16] that were used in the training is shown in Table 4.
Table 4. CNN’s parameters used to build model
Parameter Value
Filter windows (h) 3,4,5 Feature maps 100 @ filter windows
Dropout rate (p) 0.5
L2 constraint 3
Mini-batch size 50
3.
Results and Discussion
3.1.Experiments for top-level multi-label classification
For this experiment, we train shallow learning model using conventional term-weighting method (TF.IDF) to act as experiment’s baseline, as presented in [8]. Details of the baseline’s performance and experiment’s result could be observed in Table 5 and Table 6.
Table 5. Experiment's baseline
Baseline (CLR – NB) with TF.IDF term weighting
Dataset1 71.06%
Dataset2 51.15%
Table 6. Experiment result Word
Embedding
Word Embedding’s Dimension Feature
weighting method in doc.
representation
F-Measure (Level 1)
Dataset 1 Dataset 2 Dataset 1 Dataset 2
word2vec 300 300 avg WE 0.69322 0.6702 GloVe 300 300 avg WE 0.6771 0.6094 GloVe 700 700 avg WE 0.6744 0.6060 word2vec 300 300 TF x avg WE 0.7531 0.6702 GloVe 300 300 TF x avg WE 0.7452 0.6698 GloVe 700 700 TF x avg WE 0.7342 0.5515
Based on the experiment’s results, it could be seen that the best word-embedding model was word2vec. It constantly contributed to give better result compared to the Glove word embedding. Term frequency usage when multiplied with averaged word vector also improving multi-label classifier F1-measure. However, when 5713 new data were added to the training data, model’s performance were affected badly. It decreased the model’s F1-measure instead of increasing it. We have 2 hypotheses as to why this data addition could not improve multi-label classifier performance. First, after the data addition, data’s cardinality is dropped from 1.77 to 1.14 and this may be the cause of the classifier performance’s reduction. To prove this hypothesis, we annotated new dataset, called Dataset3. As shown in Table 7,
Dataset3 was built with cardinality and number of news roughly similar to Dataset1. Model that is built using Dataset3 as training data then tested using testing data from Dataset1.
Table 7. Comparison of Dataset1, Dataset2, and Dataset3
Dataset1 Dataset2 Dataset3
#of news 677 6312 (677 articles from Dataset1, 5635 new articles)
633
Cardinality 1.7681 1.1413 1.5987
Published date period April 2014 – February 2016
January 2016 – February 2018
January 2016 – February 2018
Table 8 present the result of testing with Dataset3 to prove hypothesis about cardinality effects on multi-label classification performance. Based on the result that shows that no improvements were made even after Dataset3 is used, it could be concluded that cardinality does not have a direct impact towards multi-label classification performance.
Table 8. Result of Experiment trained using Dataset3, tested with testing data From Dataset1
Word Embedding Word Embedding’s Dimension F1-measure multi-label classification word2vec 300 0.6581 GloVe 300 0.6300 GloVe 700 0.6266
Second hypothesis may explain the reason of data addition, dropped multi-label classifier performances related to the training and testing of published data. Dataset3 was built to prove this hypothesis. The new testing data were collected from same period as the training data for Dataset3. The result of this experiment could be observed in Table 9. From the table could be seen that there are improvements when new testing data is used. This could supports our hypothesis that stated that news’ published date could affect multi-label classifier’s performance.
Table 9. Result of Experiment trained using Dataset3, tested with new testing Data
Word Embedding Word Embedding’s Dimension F1-measure multi-label classification word2vec 300 0.7435 GloVe 300 0.7147 GloVe 700 0.7080
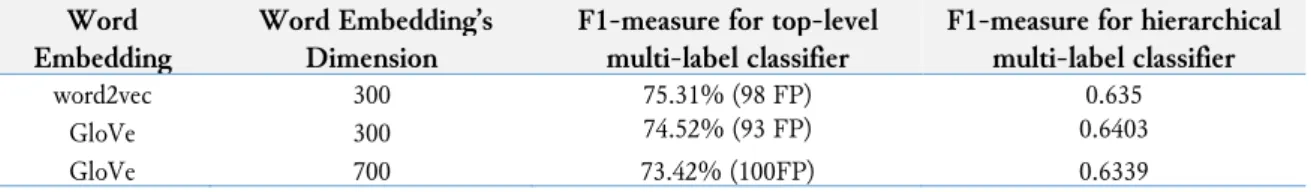
3.2.Experiments for Hierarchical Multilabel Classification (top-level and leaves-node)
The next implementation is using top three best models into the hierarchical multi-label classifier.
Table 10 shows the detailed results of this experiments.
Table 10. Results for Hierarchical Multi-label Classification
Word Embedding
Word Embedding’s Dimension
F1-measure for top-level multi-label classifier
F1-measure for hierarchical multi-label classifier
word2vec 300 75.31% (98 FP) 0.635
GloVe 300 74.52% (93 FP) 0.6403
GloVe 700 73.42% (100FP) 0.6339
These experiment results showed that model which gives best performance on top-level multi-label classifier does not necessarily give best hierarchical multi-label classifier performance. In fact, the best
hierarchical multi-label classifier performance was obtained when there are less false positive error on top-level classifier.
4.
Conclusion
Based on the result, we can conclude that, word embedding averaged vector that is multiplied with word term frequency could improve multi-label classification. On the other hands, data addition and deep learning model may reduce the classifier performance. This strengthen the fact that combination of lexical and semantic approach in feature engineering could lead to improvement in classification model’s performance. Configuration that contributed in giving best performance at the top-level classifier were shallow learning model (CLR-NB) that was built using Dataset1. The documents were represented using multiplication word term frequency and averaged word vector. The most suited pre-trained word embedding for this experiment is word2vec model that was pre-trained using Wikipedia articles. Finally, improving false positive error when classifying news at the top-level could improve hierarchical multi-label classification performance. News’ published date could affect model’s performance. When training data and testing data were collected from different range of time, it gave worse performance compared to the case when training data and testing data were collected from similar range of time.
References
[1] P. Vateekul, M. Kubat, and K. Sarinnapakorn, “Hierarchical multi-label classification with SVMs: A case study in gene function prediction,” Intell. Data Anal., 2014, doi: 10.3233/IDA-140665.
[2] I. Katakis, G. Tsoumakas, and I. Vlahavas, “Multilabel Text Classification for Automated Tag Suggestion,”
Data Manag., 2008, available at: http://www.kde.cs.uni-kassel.de/ws/rsdc08/pdf/9.pdf.
[3] D. D. Lewis, Y. M. Yang, T. G. Rose, and F. Li, “RCV1: A new benchmark collection for text categorization research,” J. Mach. Learn. Res., 2004, available at: http://www.jmlr.org/papers/volume5/lewis04a/ lewis04a.pdf.
[4] G. Tsoumakas and I. Katakis, “Multi-Label Classification,” Int. J. Data Warehous. Min., vol. 3, no. 3, pp. 1–13, 2007, doi: 10.4018/jdwm.2007070101.
[5] D. Rahmawati and M. L. Khodra, “Automatic multilabel classification for Indonesian news articles,” in ICAICTA 2015 - 2015 International Conference on Advanced Informatics: Concepts, Theory and Applications, 2015, doi: 10.1109/ICAICTA.2015.7335382.
[6] J. Fürnkranz, E. Hüllermeier, E. Loza Mencía, and K. Brinker, “Multilabel classification via calibrated label ranking,” Mach. Learn., vol. 73, no. 2, pp. 133–153, 2008, doi: 10.1007/s10994-008-5064-8.
[7] M. R. Boutell, J. Luo, X. Shen, and C. M. Brown, “Learning multi-label scene classification,” Pattern
Recognit., vol. 37, no. 9, pp. 1757–1771, 2004, doi: 10.1016/j.patcog.2004.03.009.
[8] I. C. Irsan and M. L. Khodra, “Hierarchical multilabel classification for Indonesian news articles,” in 4th IGNITE Conference and 2016 International Conference on Advanced Informatics: Concepts, Theory and
Application, ICAICTA 2016, 2016, doi: 10.1109/ICAICTA.2016.7803108.
[9] C. Vens, J. Struyf, L. Schietgat, S. Džeroski, and H. Blockeel, “Decision trees for hierarchical multi-label classification,” Mach. Learn., 2008, doi: 10.1007/s10994-008-5077-3.
[10] L. Tenenboim, B. Shapira, and P. Shoval, “Ontology-based classification of news in an electronic newspaper,” Inf. Syst., 2008, available at: http://hdl.handle.net/10525/1035.
[11] S. Dumais and H. Chen, “Hierarchical classification of Web content,” in Proceedings of the 23rd annual international ACM SIGIR conference on Research and development in information retrieval - SIGIR ’00, 2000, doi: 10.1145/345508.345593.
[12] M. L. Zhang, J. M. Peña, and V. Robles, “Feature selection for multi-label naive Bayes classification,” Inf.
Sci. (Ny)., 2009, doi: 10.1016/j.ins.2009.06.010.
[13] N. Stokes and J. Carthy, “Combining semantic and syntactic document classifiers to improve first story detection,” in Proceedings of the 24th annual international ACM SIGIR conference on Research and development
[14] L. Yang, C. Li, Q. Ding, and L. Li, “Combining lexical and semantic features for short text classification,” in Procedia Computer Science, 2013, doi: 10.1016/j.procs.2013.09.083.
[15] N. Kambhatla, “Combining lexical, syntactic, and semantic features with maximum entropy models for extracting relations,” in Proceedings of the ACL 2004 on Interactive poster and demonstration sessions -, 2004, doi: 10.3115/1219044.1219066.
[16] Y. Kim, “Convolutional Neural Networks for Sentence Classification,” in Proceedings of the 2014 Conference on Empirical Methods in Natural Language Processing (EMNLP), pp. 1746–1751, 2014, available at: https://www.aclweb.org/anthology/D14-1181.
[17] P. Wang, B. Xu, J. Xu, G. Tian, C. L. Liu, and H. Hao, “Semantic expansion using word embedding clustering and convolutional neural network for improving short text classification,” Neurocomputing, 2016, doi: 10.1016/j.neucom.2015.09.096.
[18] J. Wang, Z. Wang, D. Zhang, and J. Yan, “Combining knowledge with deep convolutional neural networks for short text classification,” in IJCAI International Joint Conference on Artificial Intelligence, 2017, doi: 10.24963/ijcai.2017/406.
[19] H. Zhao, Z. Lu, and P. Poupart, “Efficient Estimation ofWord Representations in Vector Space,” IJCAI
Int. Jt. Conf. Artif. Intell., 2015, doi: 10.1162/153244303322533223.
[20] J. Lilleberg, Y. Zhu, and Y. Zhang, “Support Vector Machines and Word2vec for Text Classification with Semantic Features,” Proc. IEEE 14th Int. Conf. Cogn. Informatics Cogn. Comput., pp. 136–140, 2015, doi: 10.1109/ICCI-CC.2015.7259377.
[21] G. Paltoglou and M. Thelwall, “A study of information retrieval weighting schemes for sentiment analysis,” in ACL ’10 Proceedings of the 48th Annual Meeting of the Association for Computational Linguisti, 2010, available at: http://www.aclweb.org/anthology/P10-1141.
[22] F. Enríquez, J. A. Troyano, and T. López-Solaz, “An approach to the use of word embeddings in an opinion classification task,” Expert Syst. Appl., 2016, doi: 10.1016/j.eswa.2016.09.005.
[23] Tensorflow, “Vector Representations of Words,” Tensorflow, 2016, available at: https://www.tensorflow.org/ tutorials/representation/word2vec.
[24] H. Zhang, “The Optimality of Naive Bayes,” AAAI, 2004, doi: 10.1016/j.patrec.2005.12.001.
[25] A. Fujino, H. Isozaki, and J. Suzuki, “Multi-label Text Categorization with Model Combination based on F1-score Maximization,” Proc. IJCNLP, 2008, available at: http://aclweb.org/anthology/I08-2116. [26] J. Pennington, R. Socher, and C. Manning, “Glove: Global Vectors for Word Representation,” Proc. 2014
Conf. Empir. Methods Nat. Lang. Process., pp. 1532–1543, 2014, doi: 10.3115/v1/D14-1162.
[27] D. Rahmawati and M. L. Khodra, “Word2vec semantic representation in multilabel classification for Indonesian news article,” in 4th IGNITE Conference and 2016 International Conference on Advanced
Informatics: Concepts, Theory and Application, ICAICTA 2016, 2016, doi: 10.1109/ICAICTA.2016.7803115.
[28] A. Joulin, E. Grave, P. Bojanowski, and T. Mikolov, “Bag of Tricks for Efficient Text Classification,” in Proceedings of the 15th Conference of the European Chapter of the Association for Computational Linguistics:
Volume 2, pp. 427–431, 2016, available at: https://www.aclweb.org/anthology/E/E17/E17-2068.pdf.
[29] P. Bojanowski, E. Grave, A. Joulin, and T. Mikolov, “Enriching Word Vectors with Subword Information,”
Trans. Assoc. Comput. Linguist., vol. 5, pp. 135–146, 2017, doi: 10.1162/tacl_a_00051.
[30] M. Zhang and Z. Zhou, “A Review on Multi-Label Learning Algorithms,” IEEE Trans. Knowl. Data Eng., vol. 26, no. 8, pp. 1819–1837, 2014, doi: 10.1109/TKDE.2013.39.