Blob Extraction Algorithm
in Detection of Convective Cells
for Data Fusion
Piotr Szuster
Cracow University of Technology, Cracow, Poland AGH University of Science and Technology, Cracow, Poland
https://doi.org/10.26636/jtit.2019.135319
Abstract—Earth’s atmosphere is monitored by a multitude of sensors. It is the troposphere that is of crucial importance for human activity, as it is there that the weather phenom-ena take place. Weather observations are performed by sur-face sensors monitoring, inter alia, humidity, temperature and winds. In order to observe the developments taking place in the atmosphere, especially in the clouds, weather radars are commonly used. They monitor severe weather that is associ-ated with storm clouds, cumulonimbuses, which create pre-cipitation visible on radar screens. Therefore, radar images can be utilized to track storm clouds in a data fusion system. In this paper an algorithm is developed for the extraction of blobs (interesting areas in radar imagery) used within data fusion systems to track storm cells. The algorithm has been tested with the use of real data sourced from a weather radar network. 100% of convection cells were detected, with 90% of them being actual thunderstorms.
Keywords—big data, blob extraction, data fusion, data integra-tion, image processing, radar images.
1. Introduction
Blob is an image area, with some of its properties being similar or constant. Blobs are used for detecting image re-gions that may represent specific objects. Such an approach is commonly used to track objects in data fusion systems. Data fusion is a process solving the problem of association, combination and correlation of data coming from a single or from multiple sources. It aims to determine the precise position and to estimate the identity of, as well as to as-sess situations and threats of crucial significance. Target tracking, image processing and surveillance are among the typical fields of application of data fusion techniques. The said techniques combine data from multiple sensors, just as humans and animals continuously integrate information coming from their senses, to get an understanding of the current situation within a specific environment.
A sensor network (SN) involves the deployment of a cer-tain number of sensors in a wide area – probably with overlapping fields of view – which acquire data from the environment. Necessarily, suitable procedures to interpret data captured by a single sensor must be developed in
or-der to provide an integrated and high-level view of the situation. The field of research dealing with data fusion fo-cuses on studying problems arising from the combination and interpretation of multiple data sources. In this paper, meteorological radars are used as data sources. The main contribution of this paper is the description of a novel algo-rithm used for extracting blobs from weather radar data and relied upon to detect convective cells and, thus, to identify potential thunderstorms.
The main contribution of this paper is the description of a novel algorithm used for extracting blobs from weather radar data and relied upon to detect convective cells and, thus, to identify potential thunderstorms.
The paper is organized as follows. Section 2 describes the data fusion process. In Section 3 related work is presented. Section 4 describes the process of radar data acquisition and blob extraction. Section 5 shows a practical application example. Sections 6 and 7 conclude the paper.
2. Data Fusion Process
Fusion processes are classified according to a model worked out by the Joint Directors of Laboratories (JDL) and serv-ing as the prevailserv-ing theory used to describe fusion sys-tems [1], [2]. JDL classifies fusion processes according to the abstraction and the refinement of the entities involved. The canonical JDL model establishes five operational lev-els in the transformation of input signals into decision-ready knowledge, namely:
• signal feature assessment (L0), • entity assessment (L1), • situation assessment (L2), • impact assessment (L3), • process assessment (L4).
Low-level data fusion, corresponding to JDL L0 and L1 levels, designates procedures aimed to pre-process sensor signal and to estimate the properties of isolated objects.
Level 1 assesses variables describing the state of entities, for example: position, velocity, size, etc. In order to per-form entity assessment, inper-formation about such variables has to be extracted from data pre-processed in level zero. Considering computer vision, the problem revolves around detection of entities in images. Images consist of blobs – areas of an image sharing similar or constant properties. This paper describes a novel blob detection technique ap-plied with regard to radar images in data fusion schemes. This technique will be used to extract important variables for high level data fusion.
High-level information fusion procedures, corresponding to L2 and L3, aim to obtain a description of the relations be-tween individual objects in a perceived scenario. These relations are usually expressed with interpretable symbolic terms (e.g. actions, intentions, threats), instead of the usual numerical measures (e.g. density functions, movement vec-tors) calculated in L1. L4 tasks are aimed at planning and performing procedures to improve the entire fusion process, from low-level data acquisition to high-level situation as-sessment. A revised JDL data fusion model is shown in Fig. 1.
Fig. 1. JDL data fusion model [2].
Level 4 (process enhancement) tasks – also known as ac-tive fusion – aim to modify data acquisition and processing procedures after DIF, in order to improve the quality of the results obtained. Generally speaking, process enhancement consists in improving the fusion procedure by using feed-back generated at a more abstract level. For instance, the behavior of a tracking algorithm can be changed once a gen-eral interpretation of the scene has been inferred. If the system recognizes that an object is moving out of the sen-sor range, the tracking procedure could be informed to be ready to delete this track in the near future. As previously mentioned, the framework includes a general mechanism to generate recommendations for the tracking procedure based on rule triggering. In their basic form, these recommenda-tions are direct manipularecommenda-tions of the parameters or the data stored by the tracker.
The detection and characterization of activities and threats requires that the states of situational items and their rela-tionships within a specific context be identified. From the point of view of the fusion process, the context may be in-formally defined as a set of background circumstances that are not of prime interest for the system, but have potential relevance towards optimal estimation [3]. When a context is activated (i.e. some circumstances hold), more informa-tion is available to obtain and improve estimainforma-tions con-cerning the problem entities. This contextual information, expressed in the form of complementary knowledge or con-straints, encompasses information about objects, processes, events and relationships between them, as well as partic-ular goals, plans, capabilities and policies of the decision makers. Such a diversity makes formal context representa-tion a significant challenge.
In the fusion environment, context usually refers to any piece of data, additional to sensor inputs, that is useful for source aggregation. In line with [4], [5], Sycara et al. state that parts of the context are the significant features or the history of a situation that influence the features of other situations, as well as the expectations of what is to be observed and the interpretation of what has been ob-served [6]. They also propose the high-level information fusion environment (HiLIFE) fusion model for battlefield management. To these authors, situational context is a “first class entity”, but not exactly in the sense proposed by McCarthy. According to their interpretation, it is rather a computable description of terrain elements, external re-sources and potential inferences, essential to supporting the fusion process.
This work follows the same principle. A model of the sce-nario and a relevant background have been created, using situational and expert knowledge, to drive the high-level fusion process. Content specific to the context of the mete-orological surveillance problem is described in Section 4. The context can therefore be used to:
• explain observations, • define hypotheses,
• identify areas of interest in order to focus on new data collection,
• refine ambiguous estimations,
• provide for the mutual relationships between differ-ent fusion levels [6], [7].
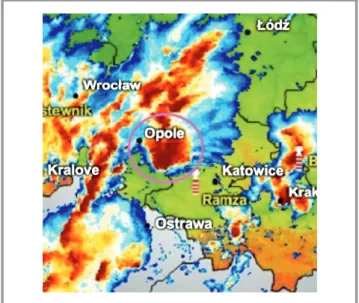
Weather radars are the main source of near real-time data concerning thunderstorms. Weather radars provide data about precipitation intensity in a form of reflectivity fields. Reflectivity is correlated with the rainfall rate. Data is presented in the form of a 3D reflectivity field. After pro-cessing, that 3D field can be transformed into a graphical representation. Figure 2 shows such a graphical represen-tation – a radar image of a tornadic supercell thunderstorm
near the village of Zimna Wódka, Poland, observed on Au-gust 15th, 2008.
Fig. 2. Maximum reflectivity radar image of a supercell thunder-storm (circled). All thunderthunder-storms have a specific radar signature: a high reflectivity core with well-defined borders. Hence, their position and area may be extracted relatively easily from a radar scan. (For color pictures visit www.nit.eu/publications/journal-jtit) This data fusion problem requires appropriate data acquisi-tion, entity extraction and tracking algorithms. Radar data has to be collected from a remote server, and then entities have to be extracted based on the data acquired. After ex-traction, proper filtering and tracking processes need to be performed. In order to gain proper situational awareness, relationships between the storm cells and their environment should be deduced.
3. Related Work
The majority of papers dealing with blob detection and ex-traction are related, to a certain degree, to computer vision. As surveillance is one of the potential applications, these algorithms are commonly applied in object tracking [8], [9]. Computer vision blob detection algorithms deal with very complex images representing many objects. That leads to the development of a multitude of approaches. Some se-lected approaches will be described in this chapter. A very common approach is based on Laplacian of the Gaussian generators [10]. In this case, a convolution of an image f(x,y)and a Gaussian kernel is made:
g(x,y,t) = 1 2πte−
x2+y2
2t , (1)
wheret is scale space representation. Then Laplacian op-erator is applied and the result is:
∇2L=L
xx+Lyy. (2)
The gLoG using those operators [10] has the ability to estimate shapes, orientations and scales of blobs.
A different Gaussian kernel is another example of the blob detection technique. This instance relies on scale-invariant feature transform [11]. This algorithm aims to detect fea-tures of objects presented in images. It utilizes a variety of Gaussian operators for scale space extrema localization in a series of smoothed and resampled images. It also uses a multitude of techniques for solving problems re-sulting from the presence of geometric distortions, index-ing, matchindex-ing, clusterindex-ing, model verification and hypothesis testing.
Satellite images are also good sources of information about convection cells. In [12], the authors proposed variational-data-assimilation tools that are used to track and ana-lyze convective cloud systems based on second generation Meteosat images. This approach is based on the analy-sis of cloud top temperature values collected from radar images.
In [13], another way of transforming infrared satellite im-ages is proposed. An extended maximatransform technique is used to detect convective cells. A method relying on learning a spatio-temporal context model is deployed as well. The confidence map of adjacent moments is cal-culated.
2D satellite images suffer from considerable disadvantages. This kind of imaging provides two-dimensional informa-tion about the surface of cloud tops. This is a significant limitation. Radar data, however, delivers a full 3D profile of the storm, with each significant pattern represented. A multitude of algorithms and techniques were developed based on the aforementioned approaches, but all those tech-niques are rather complex. They are also designed to take into consideration the problem of image processing. Blob extraction is related to blob detection, but these two terms cannot be considered to constitute the same process. The main technique that is applied to solve the problem of blob extraction is called connected-component label-ing [14]. It is based on the concept of applylabel-ing the graph theory to a set of connected components. This concept re-lies on a unique methods used for labeling the connected-components within a set of elements. The “one component at a time” variant of connected-component labeling is used in the proposed algorithm.
4. Convective Cells and Radar Patterns
Meteorology glossaries describe convection cells as dis-tinct units of convection that survive for 20–30 minutes and are characterized by radar reflectivity [15]. Convection cells are associated with the presence of cumuliforms, es-pecially cumulonimbus clouds [16] that are responsible for the creation of thunderstorms. Cumulonimbus clouds can generate severe weather events: flash floods [17], signifi-cant hail [18], severe wind gusts [19] and tornadoes [20]. Their presence can be detected on radar images as an area of significant reflectivity (values greater than 40 units of reflectivity), with well-defined borders. Those reflectivity fields are moving in the direction and at the velocity of theair masses. Convective clouds may also be organized into multi-cellular structures, may have the shape of a squall line or may transform into a supercell. All of the afore-mentioned forms of convective clouds may create some severe weather, so the process of analyzing radar data is very useful and necessary.
Some other important properties of reflectivity areas related to storm cells need to be taken into consideration. These include, for example, the following:
• well-defined borders, • no rapid changes in shape, • no rapid changes in velocity, • good predictability of movement,
• deviation from the mean movement in the case of a super-cell [21],
• elongated shape in the case of a squall line [22]. These properties are of key value and facilitate the devel-opment of an efficient algorithm.
5. Blob Extraction from a Radar Image
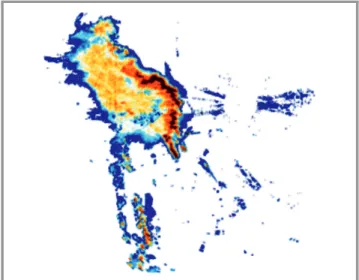
Weather radar data is available online, mainly in the form of bitmap images, where reflectivity fields are presented for a defined horizontal cross-section of a 3D radar field with the use of the Cartesian coordinate system. Each pixel has a color value equivalent to the actual reflectivity value. Usually, information about value intervals and corre-sponding colors is provided as well. The bitmap (shown in Fig. 3) has to be transformed into a structure containing numerical reflectivity values based on information about intervals and their colors.Fig. 3. Example of a radar image.
Instead of a matrix containing all values, a reflectivity vec-torVof non-zero values is proposed:
V= [v1, . . . ,vn], (3)
with
vk= [xk,yk,λk] for 1≤k≤n, (4) wherevkisk-th reflectivity point,xkisxcoordinate ofk-th value,yk isycoordinate ofk-th value,λk isk-th value. After conversion, the reflectivity vector has to be trans-formed into a set of blobs. A blob can be considered as a region of the image in which some of proprieties are constant or approximately constant.
Typically, a storm is depicted in radar image in the form of an area with very high reflectivity, corresponding to the storm’s precipitation core (>44dBz), which is surrounded by areas of low precipitation. Thus, in order to perform the vector-to-blob transformation, a reflectivity threshold is applied and another vector of values is created. A radar image with a threshold value applied is shown in Fig. 4.
Fig. 4. Radar image with a threshold value applied.
Then, the adjacent points of the reflectivity vector are grouped into blobs based on the following adjacency rule (connected-components labeling). Point k is adjacent to pointl when:
k= [xk,yk], (5)
l= [xl,yl], (6)
xl−d≤xk≤xl+d, (7)
yl−d≤yk≤yl+d, (8) where d is the permitted distance parameter. Blob b is represented by its center and a set of adjacent points P. The center of a blob is estimated asC= [xc,yc] where:
xc= min(xp) +max(xp)·0.5, (9)
yc= min(yp) +max(yp)·0.5, (10)
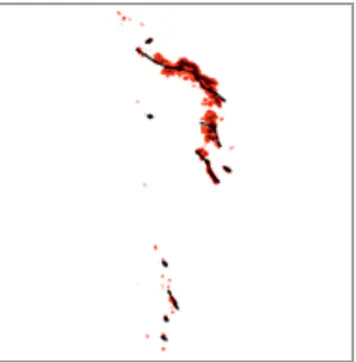
for p∈P. The blobs whose surface area is lower than the minimum applied value are removed from the blob setB. During this study, the minimum threshold was set at 16 points. The detected blobs are presented in Fig. 5.
6. Intermediate Level Entities
To ensure good separation between data acquisition and fusion processes, an additional level of entities was added. Because storms can vary in dimensions and in shape, a dif-ferent representation is necessary. Reflectivity fieldrwas introduced as a primary storm cell representation. A re-flectivity field consists of a set P of adjacent points ex-tracted from the blob, the center of the blob, its dimensions and partitioning set of reflectivity points. The partitioning scheme was based on blob dimensions and storm orienta-tion. Storm orientation is horizontal when its blob width is greater than or equal to its blob height. Otherwise, ori-entation is vertical.Let us consider partitioning setE. E consists of a series of entriese. Entry e= [a,l,u] is the argument of an en-try. When orientation is horizontal, for each distinctxthe coordinates of reflectivity points setPelement pare:
l=min(yp):p= [xp,yp]∈P∧xp=x, (12)
u=max(yp):p= [xp,yp]∈P∧xp=x, (13)
a=x. (14) When orientation is vertical, for each distinctythe coordi-nates of reflectivity points setPelement pare:
l=min(xp):p= [xp,yp]∈P∧yp=y, (15)
u=max(xp):p= [xp,yp]∈P∧yp=y, (16)
Fig. 5. Detected blobs (highlighted as rectangles).
a=y. (17)
Eis structured in the ascending order, based on argumenta. Then, based on the resulting partitioning setE, a subset of characteristic pointsI can be extracted:
E= [e1, . . . ,em], (18) I= [i1, . . . ,in], (19) ik= [uk,vk], k∈ {1, . . . ,n}, (20) i1= ha1,(l1+u1) 2 i , (21) in= ham,(lm+um) 2 i , (22) ik= h ao,lo+uo 2 i ⇐⇒ r (ao−uk)2+ lo+uo 2 −vk 2 ≥d, (23) k∈ {2, . . . ,n−1}, (24) o=2, . . . ,m−1, (25) wheredis the minimum required distance.
After extraction,Iis transformed from the argument value form into the standard Cartesian coordinate formula, based on orientation.
The center of the reflectivity field is a point chosen fromI, at which the difference between distances from it to i0 is minimal. If the characteristic set comprises two elements, the point of average coordinates is computed and chosen as the center. Figure 6 presents the reflectivity field and the set of characteristic points (circle) wit a center (double circle).
Fig. 6. Reflectivity fields with a set of characteristic points. This set of characteristic points is used as a set of descrip-tors. Those descriptors will be used in the data fusion process to determine the position of the storm, its size, velocity and its character.
7. Implementation
The algorithm was implemented in C#. The first element developed was a class representing the data repository of-fering a data download function. Diagram class of data repository is shown in Fig. 7. A repository from the radar-opadow.pl website was used, as it offers different types of historical data (CMAX, CAPPI). This database is essen-tial for testing purposes. Column maximum (CMAX) is a type of radar image which presents the spatial distribu-tion of maximum reflectivity along the vertical profile of the atmosphere. Constant altitude plan position indicator (CAPPI) products present a horizontal cross-section of re-flectivity at a constant altitude.
Fig. 7. Data repository class diagram.
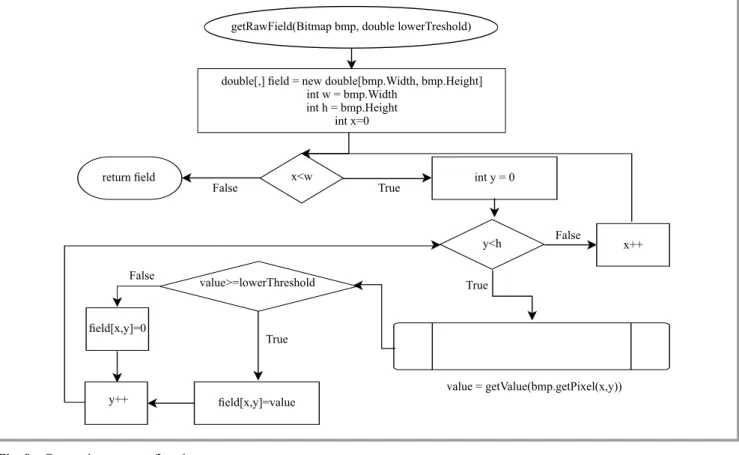
The second step is to convert the bitmap image into a re-flectivity array using a class for conversion with a proper reflectivity scale. It offers a functionality enabling to con-vert bitmaps into reflectivity arrays. For each pixel the demanded threshold is computed by the method shown in Fig. 8. A flowchart of the conversion process is shown in Fig. 9. getValue returns the pixel color value. The distance between the pixel color and each scale color is computed. The minimum distance is chosen according to the following rule:
int Ra = c1.R−c2.R; int Ga = c1.G−c2.G; int Ba = 1.B−c2.B; return
Math.Sqrt (Ra·Ra + Ga·Ga + Ba·Ba);
This approach is used due to transformations (coordinate transformations, color interpolation, scaling, etc.) of the image in the repository. R, G, B are red, green, blue pixel color values.
Fig. 8. Pixel-to-value conversion flowchart.
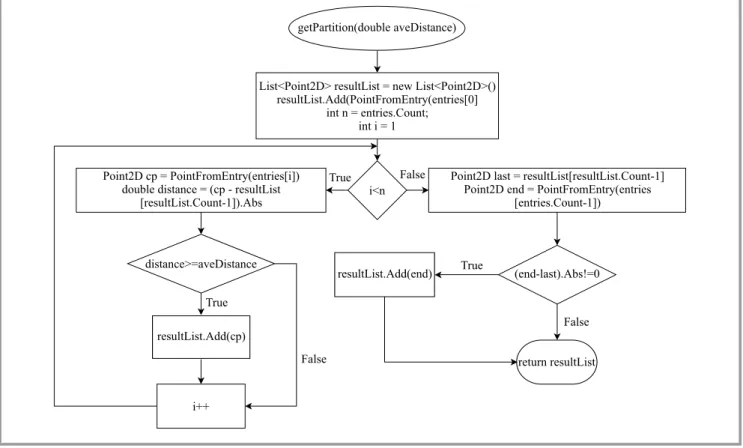
After the reflectivity array has been worked out, it may be transformed into a blob collection based on the adjacency rule (connected-components labeling). The adjacency tol-erance is set at 2 pixels for each direction. This is when the blobs are detected. The next step is to perform proper partitioning and to acquire the descriptors (Fig. 10). Final partitioning may be performed by applying the func-tion shown in Fig. 11.
8. Testing
A set of radar images was compiled using CMAX radar scans collected between 12:00 UTC on August 11th, 2018 and 04:00 UTC on August 12th, 2018. CMAX radar scans present maximum reflectivity along the vertical pro-file. This approach leads to convective cells being clearly visible. Radar scans were taken in 10-minute intervals. 97 radar images were collected for testing. The period between 12:00 UTC on August 11th, 2018 and 04:00 UTC on August 12th, 2018 was chosen due to the pres-ence of a variety of different forms of convection cells.
Fig. 9. Conversion process flowchart.
Fig. 10. Acquisition of descriptors.
A large 300-kilometer bow echo formed in the Czech Re-public and extended through Poland, all the way to the Baltic Sea. It shows a variety of convection cell forms, which was the primary reason behind its selection. Dur-ing the review process, the convection cells were marked. Then, the algorithm was used to extract blobs and descrip-tors. The number of marked cells in the set varied between 1 and 17, with the average value equaling 10.05. The mean
number of cells detected with the use of the algorithm was 9.59. The highest difference related to a specific radar scan was 5. The time distribution of the number of cells ob-served (marked by a meteorologist) and detected by the algorithm is shown in Fig. 12.
This difference stems from the fact that a single multi-cellular storm was detected as one big system, rather than as individual, interconnected heavy rainfall cells. In fact,
Fig. 11. Final partitioning algorithm structure.
Fig. 12. Time distribution of detected and marked cells. the multi-cellular storm referred to as a bow echo may be considered to constitute a single entity, because of its con-tinuous character, persistence and structure. This particu-lar case is shown in Fig. 13. The convection cells which eventually did not produce thunderstorms were detected as well. The algorithm successfully detected convection cells, generated descriptors and extracted blobs. It also detected cells over the Czech Republic that were merging into the bow echo storm. A set of characteristic points of the bow echo storm was established and may be utilized in further tracking algorithms for predicting the motion of storms. 100% convection cells were detected. Up to 90% of them
Fig. 13. Bow echo composed of many connected cells (up) detected as an organized system (down).
were thunderstorms. The 10% difference stems from the fact that not all convection cells actually produce a thun-derstorm.
9. Conclusions
The algorithm developed, based on connected- components labelling with a new technique for detects all convection cells within a representative set. It applies partitioning to blobs. It boasts low computational complexity is based on an easily understandable concept and may be used, after adaptation, in other fields relying use radar data.
Acknowledgements
The inspiration for the research presented in this paper is the result of the STSM visit of Piotr Szuster in within STSM program of the IC1406 COST Action Horizon 2020 project cHiPSet “High-Performance Modelling and Simulation for Big DataApplications”. His work has been supervised by Prof. H. Molina Lopez and prof. J. Kołodziej.
References
[1] A. N. Steinberg and C. L. Bowman, “Rethinking the JDL data fu-sion levels”, inProc. of the MSS Nat. Symp. on Sensor and Data Fusion JHUAPL 2004, Columbia, SC. USA, 2004 [Online]. Avail-able: http://citeseerx.ist.psu.edu/viewdoc/download?doi=
10.1.1.466.3588&rep=rep1&type=pdf
[2] J. Llinaset al., ‘Revisiting the JDL data fusion model II”, inProc. of the 7th Int. Conf. on Inform. Fusion, Fusion 2004, Stockholm, Sweden, 2004, pp. 1218–1230.
[3] J. Gómez-Romero, J. Garc´ıa, M. A. Patricio, J. M. Molina, and J. Llinas, “High-level information fusion in visual sensor networks”, inVisual Information Processing in Wireless Sensor Networks: Tech-nology, Trends and Applications, L.-M. Ang and K. P. Seng, Eds. IGI Global, 2012, pp. 197–223
(doi: 10.4018/978-1-61350-153-5.ch010).
[4] G. Powell, C. Matheus, M. Kokar, and D. Lorenz, “Understanding the role of context in the interpretation of complex battlespace in-telligence”, inProc. of the 9th Int. Conf. on Inform Fusion Fusion 2006,Florence, Italy, 2006 (doi: 10.1109/ICIF.2006.301719). [5] M. Kandefer, S. C. Shapiro, “A categorization of contextual
con-straints”, inProc. of the AAAI Fall Symp., Menlo Park, USA, 2008, pp. 88–93 [Online]. Available: https://www.aaai.org/Papers/ Symposia/Fall/2008/FS-08-04/FS08-04-024.pdf
[6] K. Sycaraet al., “An integrated approach to high-level information fusion”,Inform. Fusion, vol. 10, no. 1, pp. 25–50, 2009
(doi: 10.1016/j.inffus.2007.04.001).
[7] J. Gómez-Romeroet al., “Strategies and techniques for use and ex-ploitation of contextual information in high-level fusion architec-tures”, inProc. 13th Int. Conf. on Inform. Fusion 2010, Edinburgh, UK, 2010 (doi: 10.1109/ICIF.2010.5711859).
[8] J. M. Molina, J. Garc´ıa, J. A. Besada, and J. I. Portillo, “A multitarget tracking video system based on fuzzy and neuro-fuzzy techniques”,
EURASIP J. on Adv. in Signal Process, vol. 14, pp. 1–18, 2005 (doi: 10.1155/ASP.2005.2341).
[9] J. Gómez-Romero, M. A. Serrano, J. Garc´ıa, J. M. Molina, and G. Rogova, “Context-based multi-level information fusion for harbor surveillance”,Inform. Fusion, vol. 21, pp. 173–186, 2015 (doi: 10.1016/j.inffus.2014.01.011).
[10] H. Kong, H. C. Akakin, and S. E. Sarma, “A generalized Lapla-cian of Gaussian filter for blob detection and its applications”,IEEE Trans. on Cybernet., vol. 43, no. 6, pp. 1719–1733, 2013 (doi: 10.1109/TSMCB.2012.2228639).
[11] D. G. Lowe, “Object recognition from local scale-invariant features”, inProc. of the 7th Int. Conf. on Comp. Vision, Kerkyra, Greece, 1999, pp. 1150–1157 (doi: 10.1109/ICCV.1999.790410).
[12] C. Thomas, T. Corpetti, and E. Memin, “Data assimilation for convective-cell tracking on meteorological image sequences”,
IEEE Trans. on Geosci. and Remote Sensing, vol. 48, no. 8, pp. 3162–3177, 2010 (doi: 10.1109/TGRS.2010.2045504). [13] J. Liu and C. Liu, “Convective cells tracking based on
spatio-temporal context and extended maxima transform using satellite im-ages”,The J. of Engin., vol. 2019, no. 1, 2019
(doi: 10.1049/joe.2018.5075).
[14] H. Samet and M. Tamminen, “Efficient component labeling of im-ages of arbitrary dimension represented by linear bintrees”, IEEE Trans. on Pattern Anal. and Machine Intell.”, vol. 10, no. 4, pp. 579–586, 1988 (doi: 10.1109/34.3918).
[15] Glossary of Meteorology: Convective Cell, American Meteorologi-cal Society [Online]. Available: http://glossary.ametsoc.org/ wiki/Main Page
[16] S. E. Yuter and R. A. Houze Jr, “Three-dimensional kinematic and microphysical evolution of Florida cumulonimbus. Part II: Fre-quency distributions of vertical velocity, reflectivity, and differential reflectivity”,Monthly Weather Rev., vol. 123, pp. 1941–1963, 1995 (doi: 10.1175/1520-0493(1995)123<1941:TDKAME>2.0.CO;2). [17] C. A. Doswell III, H. E. Brooks, and R. A. Maddox, “Flash flood
forecasting: An ingredients-based methodology”,Weather and Fore-cast., vol. 11, no. 4, pp. 560–581, 1996
(doi: 10.1175/1520-0434(1996)011<0560:FFFAIB>2.0.CO;2) [18] J. L. Cintineoet al., “An objective high-resolution hail climatology
of the contiguous United States”, Weather and Forecast., vol. 27, no. 5, pp. 1235–1248, 2012 (doi: 10.1175/WAF-D-11-00151.1). [19] E. J. Fawbush and R. C. Miller, “A basis for forecasting peak wind
gusts in non-frontal thunderstorms”,Bull. of the American Meteo-rolog. Soc., vol. 35, no. 1, pp. 14–19, 1954
(doi: 10.1175/1520-0477-35.1.14).
[20] R. Davies-Jones, R. J. Trapp, and H. B. Bluestein, “Tornadoes and tornadic storms”, inSevere Convective Storms, C. A. Doswell III, Ed. Boston, MA: American Meteorological Society, 2001, pp. 167–221 (doi: 10.1007/978-1-935704-06-5 5).
[21] M. J. Bunkers et al., “Predicting supercell motion using a new hodograph technique”, Weather and Forecast., vol. 15, no. 1, pp. 61–79, 2000
(doi: 10.1175/1520-0434(2000)015<0061:PSMUAN>2.0.CO;2). [22] B. F. Smull and R. A. Houze Jr, “A midlatitude squall line with
a trailing region of stratiform rain: Radar and satellite observations”,
Monthly Weather Rev., vol. 113, no. 1, pp. 117–133, 1985 (doi: 10.1175/1520-0493(1985)113<0117:AMSLWA>2.0.CO;2).
Piotr Szuster graduated in Computer Science at Cracow University of Technology, Po-land, in 2016. Currently, he is a research and teaching assistant at Cracow University of Tech-nology and a Ph.D. student at AGH University of Science and Technology. The main topics of his research are Big Data, Data Fusion and Internet of Things. E-mail: [email protected], [email protected]
Cracow University of Technology Warszawska 24
31-155 Cracow, Poland
AGH University of Science and Technology al. Mickiewicza 30
![Fig. 1. JDL data fusion model [2].](https://thumb-us.123doks.com/thumbv2/123dok_us/494242.2558478/2.892.66.424.499.786/fig-jdl-data-fusion-model.webp)