PDF hosted at the Radboud Repository of the Radboud University
Nijmegen
The following full text is a publisher's version.
For additional information about this publication click this link.
http://hdl.handle.net/2066/157655
Please be advised that this information was generated on 2017-12-05 and may be subject to
change.
MRI guided TRUS prostate biopsy – a
viable alternative?
COLOPHON
This book was typeset using LATEX2
ε
.Layout design by Wendy van de Ven, template modified fromLaTeXTemplates.com. Cover design by Rick Wingens (Wingens Webdesign).
Copyright © 2016 by Wendy van de Ven, Nijmegen, The Netherlands. All rights reserved. No part of this publication may be reproduced or transmitted in any form or by any means, electronic or mechanical, including photocopy, recording, or any information storage and retrieval system, without permission in writing from the author.
ISBN 978-94-028-0172-9
P
ROEFSCHRIFTTER VERKRIJGING VAN DE GRAAD VAN DOCTOR AAN DERADBOUDUNIVERSITEIT
NIJMEGEN OP GEZAG VAN DE RECTOR MAGNIFICUS,VOLGENS BESLUIT VAN HET COLLEGE VAN DECANEN IN HET OPENBAAR TE VERDEDIGEN OP MAANDAG4JULI2016
OM10.30UUR PRECIES
DOOR
Wendy Johanna Martina van de Ven
Promotoren: Prof. dr. ir. N. Karssemeijer Prof. dr. J. O. Barentsz
Copromotor: Dr. ir. H. J. Huisman
Manuscriptcommissie: Prof. dr. P. F. A. Mulders Prof. dr. ir. C. H. Slump
Universiteit Twente
Dr. D. M. Somford
Canisius-Wilhelmina Ziekenhuis
The research described in this thesis was carried out at the Diagnostic Image Analysis Group, Radboud University Medical Center (Nijmegen, The Netherlands).
This work was funded by grantKUN 2007-3971of the Dutch Cancer Society.
Financial support for publication of this thesis was kindly provided by the department of Radiology and Nuclear Medicine of the Radboud University Medical Center, Nijmegen, The Netherlands.
1.1 Prostate anatomy 3 1.2 Prostate cancer epidemiology 4 1.3 Prostate cancer diagnosis in current clinical practice 4
1.3.1 Ultrasound guided biopsy . . . 6
1.3.2 Gleason grading of prostate cancer . . . 8
1.3.3 Treatment options . . . 10
1.4 Prostate cancer screening 10 1.5 Drawbacks of current practice 11 1.6 MR imaging of the prostate 12 1.6.1 Prostate cancer diagnosis on MRI . . . 14
1.6.2 MR guided biopsy . . . 16
1.7 MR-TRUS fusion 17 1.7.1 Cognitive fusion . . . 17
1.7.2 Computational fusion . . . 17
1.7.3 Clinical MR-TRUS fusion systems . . . 19
1.8 Outline of this thesis 21
2
A viable alternative?
. . . 253
Required registration accuracy
. . . 313.1 Introduction 33 3.2 Materials and methods 34 3.2.1 Patients . . . 34
3.2.2 MR imaging protocol . . . 34
3.2.3 Histopathology . . . 35
3.2.4 MR tumour annotation . . . 35
3.2.5 Focal volume segmentation . . . 35
3.2.6 Registration accuracy and hit-rate . . . 37
3.2.7 Statistical analysis . . . 37
3.3 Results 38 3.3.1 Proportion and volume of tumour foci . . . 38
3.3.2 Required registration accuracy . . . 39
4
MR-MR registration
. . . 43 4.1 Introduction 45 4.2 Methods 45 4.2.1 Patient data . . . 46 4.2.2 Biomechanical modeling . . . 46 4.2.3 Surface-based registration . . . 47 4.2.4 Registration accuracy . . . 48 4.3 Results 48 4.4 Conclusion 485
MR-TRUS registration
. . . 51 5.1 Introduction 53 5.2 Materials and methods 55 5.2.1 Overview . . . 55 5.2.2 Data collection . . . 56 5.2.3 Segmentation . . . 56 5.2.4 Preprocessing . . . 57 5.2.5 Rigid registration . . . 57 5.2.6 Meshing . . . 575.2.7 Radial surface projection . . . 58
5.2.8 Biomechanical modeling . . . 59
5.2.9 Non-rigid surface-based registration . . . 60
5.2.10 Evaluation . . . 60
5.3 Results 62 5.4 Discussion 64 5.5 Conclusions 68
6
Cancer visibility on TRUS
. . . 696.1 Introduction 71 6.2 Patients and methods 72 6.2.1 Patient selection . . . 72 6.2.2 MR imaging . . . 72 6.2.3 TRUS imaging . . . 72 6.2.4 Histopathology . . . 72 6.2.5 Observer experiment . . . 73 6.2.6 Data analysis . . . 73
6.4 Discussion 77
7
MR-TRUS fusion biopsy
. . . 817.1 Introduction 83 7.2 Patients and methods 84 7.2.1 Patient population . . . 84
7.2.2 Multi-parametric magnetic resonance imaging . . . 84
7.2.3 Biopsy procedure . . . 84 7.2.4 Histopathology . . . 85 7.2.5 Biopsy evaluation . . . 85 7.2.6 Data analysis . . . 87 7.3 Results 87 7.4 Discussion 89
8
Summary & Discussion
. . . 938.1 Summary 95 8.2 General discussion 97 8.3 Future perspectives 100 8.4 Closing remarks 101
APPENDICES
102
Nederlandse samenvatting
. . . 105Bibliography
. . . 110Publications
. . . 125Dankwoord
. . . 131Curriculum Vitae
. . . 1351.1
Prostate anatomy
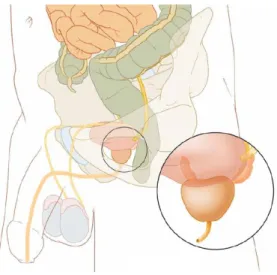
The prostate is a small gland situated in the pelvic cavity and is part of the male repro-ductive system. It is located between the pelvic bones, below the bladder and in front of the rectum (Figure 1.1).1In healthy males, the prostate is about the size of a chestnut and somewhat conical in shape. Its body is partly glandular and partly muscular. The gland is perforated by the urethra, originating in the bladder, and the two ejaculatory ducts, originating at the seminal vesicles. The prostate plays a role in normal sexual functioning. It secretes an alkaline fluid, which is added to the spermatozoa and the seminal vesicle fluid, increasing the motility and lifespan of the sperm. Smooth muscles in the prostate help expel semen during ejaculation.
The prostate can be divided into three different anatomical zones: the peripheral zone, transition zone, and central zone (Figure 1.2).2The central zone surrounds the ejaculatory ducts at the base of the prostate and comprises 25% of glandular tissue in a healthy prostate. Approximately 2.5% of prostate cancers originate in this zone.3The transition zone surrounds the proximal urethra and contains around 5% of the glandular tissue. As individuals age, the transition zone grows substantially in size as the result of benign prostatic hyperplasia (BPH). This is a benign enlargement of the prostate and pushes the central gland away increasing pressure on the urethra. About 10−20% of cancers are found here. Lastly, the peripheral zone is located posterolateral and encompasses the majority of prostatic glandular tissue (up to 70% of tissue in a healthy prostate). Approximately 70−80% of all prostate cancers arise in this zone. In addition to these glandular zones, the prostate usually contains an area of fibromuscular stroma. This area is usually devoid of glandular components and is composed of only muscle and fibrous tissue.
Figure 1.1:Anatomical image of the male pelvis showing the position of the prostate, which is located
immediately under the bladder.
4 CHAPTER 1: Introduction
Figure 1.2:The zonal anatomy of the prostate. In addition to the three anatomical zones (peripheral
zone, transition zone, and central zone) the prostate contains an area of fibromuscular stroma and a periurethral gland region (area around the urethra). Image obtained from De Marzoet al.4
1.2
Prostate cancer epidemiology
On a global level, prostate cancer is the most frequently diagnosed cancer in males, and one of the leading causes of death from cancer.5–7Almost 75% of prostate cancer cases are diagnosed in developed countries.8The main reasons for this are the higher average age of the general population in developed countries compared to developing countries, and secondly, the introduction of prostate specific antigen (PSA) blood tests in developed countries (Section 1.3).
About one man in six is affected by the disease during his lifetime,7and about 3% will die of it.9–11In the USA, the estimated number of newly diagnosed prostate cancers is slightly over 230,000 cases and almost 30,000 men will die from it yearly (Figure 1.3).7,12 In the Netherlands, these yearly numbers are approximately 11,000 new cases, and about 2,500 deaths.13The main reason for this high incidence-to-mortality ratio is that most of the prostate cancers found are indolent, i.e. will not cause death. This is evidenced by both the high 10-year survival rate (77%), as well as the incidence of prostate cancer on autopsy in men who died of other causes.14
Prostate cancer has been known as a disease of elderly men. Autopsy studies have revealed that about 30% of men at age 50 have prostate cancer, at age 80 this increases to about 80%.10,11,15 However, only about 30% of the detected cancers are clinically significant.10,11 Although most prostate cancers diagnosed at an early stage have an indolent course, local tumor progression and aggressive metastatic disease may develop in the long term.16
1.3
Prostate cancer diagnosis in current clinical practice
Prostate cancer is generally detected through a combination of PSA blood serum con-centrations, digital rectum examinations (DREs), and systematic transrectal ultrasound (TRUS) guided biopsies. PSA tests measure the concentration of PSA in the blood in
Figure 1.3:Cancer statistics in the United States in 2014. New cancer cases and deaths are estimated for the ten leading types of cancer, arranged by sex. Image obtained from Siegelet al.7
nanograms per milliliter (ng/mL). PSA is a biomarker that can be useful for the early detection of prostate cancer.17 It is a protease produced in the epithelial cells of the prostate and normally secreted into the glands. In individuals with a healthy prostate, the PSA level will be low as the PSA will be contained in the prostate gland. In individuals with prostate cancer or other prostate disorders (e.g. BPH or prostatitis) the PSA level can increase because of disruption of the glandular structure. The American Cancer Society guideline for the early detection of prostate cancer recommends that patients with a PSA level of≥ 4.0 ng/mL should be referred for further examination.12To increase the sensitivity of the test, many other countries (including the Netherlands) lowered the threshold to 3.0 ng/mL, taking an increase of benign cases into account. The PSA blood test is also widely used in screening studies (discussed in Section 1.4), but remains a source of controversy due to its limited specificity.11,12,18
In a DRE, the urologist will use a lubricated, gloved finger to inspect the surface of the prostate. Healthy prostate tissue is soft and smooth, whereas prostate cancer tends to feel as a firm, stony, and often asymmetrical lump. As only a small portion of the prostate gland can be felt, DRE usually tends to miss the more ventrally located cancers. Additionally, smaller tumors are difficult to detect by DRE. As such, DRE has a limited sensitivity and specificity for the detection of prostate cancer.19,20
6 CHAPTER 1: Introduction
Figure 1.4:TRUS guided prostate biopsy. The patient is in dorsal or lateral decubitus position. The TRUS
probe is inserted into the rectum to position the needle. Image obtained from Baumannet al.29
After initial suspicion of prostate cancer has arisen due to either PSA or DRE, a TRUS guided biopsy is usually performed to make a definite diagnosis. Biopsy specimens are subsequently evaluated by a pathologist using the Gleason Scoring System. These topics will be discussed in Sections 1.3.1 and 1.3.2, respectively.
1.3.1 Ultrasound guided biopsy
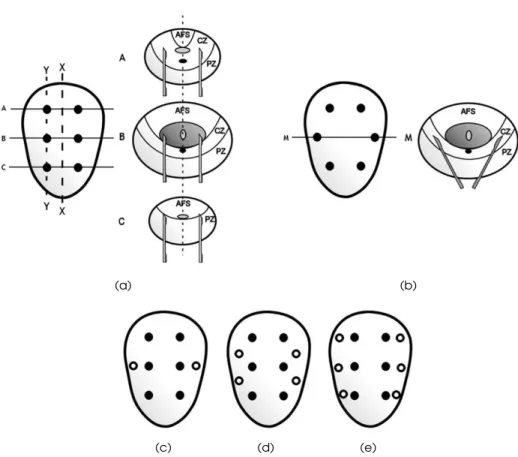
Transperineal biopsies under finger guidance were the most common means of detecting prostate cancer until the introduction of transrectal/transperineal biopsies under tran-srectal ultrasound guidance. Trantran-srectal ultrasound was already introduced in 1968 as a diagnostic device for prostate cancer.21,22However, it was not until the early 1980s when the first TRUS guided biopsies were explored (Figure 1.4). At that time, hypoechoic nodules were seen as the main representation of prostate cancer, and therefore biopsies were merely targeted to these nodules.23,24However, most of these nodules proved to be benign. With the introduction of the PSA test as indication for prostate biopsy, the need for ‘random’ sampling arose. In 1989, Hodgeet al.25introduced the systematic sextant biopsy method. As originally described, six biopsies were obtained in the parasagittal plane halfway between the lateral border and midline bilaterally, from the base, mid-gland, and apex (Figure 1.5(a)). The prostate cancer detection rate increased, but still there was a high false-negative rate.24,26As it became clear that most cancers originated in the
periph-eral zone, Stamey27 suggested a ‘modified protocol’ in which the middle biopsies were moved more laterally to better sample the anterior horns of the peripheral zone (Figure 1.5(b)). Even the modified sextant biopsy scheme showed sampling errors, especially in enlarged glands, leading to various alternatives being explored.24,26Extended biopsy
schemes with eight, ten, or twelve cores were reported, which are currently still in use (Figures 1.5(c)–(e)). No differences were shown between the transrectal and transperineal approach in terms of cancer detection on initial 12-core prostate biopsy.28
(a) (b)
(c) (d) (e)
Figure 1.5:Schematic diagram of the various sampling patterns used. (a) The original sextant biopsy
scheme as described by Hodgeet al.25 The coronal section shows six biopsies obtained in the parasagittal line (Y-Y), halfway between the lateral border and midline (X-X) on both right and left sides, from base, mid-gland, and apex. Images (A)-(C) demonstrate the needle trajectory in the axial plane at points A-C marked on the coronal view. (b) Coronal and axial view illustrating the modified sextant biopsy protocol. A larger amount of the peripheral is sampled by pointing the needle in an anterolateral direction. (c)–(e) Coronal representations showing extended 8-, 10-, and 12-core biopsy schemes, respectively. Image obtained from Rajaet al.24
8 CHAPTER 1: Introduction
Repeat and saturation biopsies
Even with the extended biopsy schemes, the initial biopsy may still be falsely negative.30 Clinical suspicion can persist with e.g. increasing PSA levels. No matter what parameter is used to determine the need for a repeat biopsy, it is important to first address the adequacy of the initial biopsy. Number and direction of previous cores should be considered, as well as the prostate volume. Repeat biopsies should include areas where cancer may have been missed.24,26,28
To minimise sampling error, more aggressive biopsy approaches have been applied. These so called ‘saturation’ biopsies involve≥20 biopsy cores, evenly distributed through-out the gland via the transrectal or transperineal rthrough-oute. Using saturation biopsy, Stewart et al.31 detected cancer in 77 of 224 patients (34%) after previous negative biopsies.
New ultrasound techniques
Localization of malignant tissue on gray-scale ultrasound remains difficult and system-atic TRUS guided biopsies are still routinely used in clinical practice. However, new ultrasound techniques are being explored that might help a targeted approach under ultrasound guidance. Color Doppler and power Doppler are looking for increased vascu-larity, which is a sign for prostate cancer. Targeted biopsy studies have been performed and reported a wide range of sensitivity.23
A second technique is contrast-enhanced TRUS (CEUS), where a microbubble contrast agent is administered intravascular. Sanoet al.32 reported that targeted biopsy using CEUS significantly enhanced cancer detection compared to systematic biopsy.
Lastly, elastography is a technique that measures tissue stiffness to distinguish hard (malignant) from soft (benign) tissue. Sensitivity and specificity have shown to increase when compared to systematic biopsy.33
Post-prostate biopsy morbidity
Potential biopsy-related complications, including pain, infection, and bleeding, have implications on patient care. Rosarioet al.34 measured the effect adverse events within 35 days of 10-core TRUS guided biopsies in 1147 men. Pain was reported by 43.6% of men, fever by 17.5%, and 65.8% reported on haematuria. Anaesthesia can be used for pain control, which is especially necessary for transperineal biopsies. To minimize infection rates of transrectal biopsies, patients will commonly receive some antibiotics.24,28
1.3.2 Gleason grading of prostate cancer
The Gleason Scoring System is named after Donald F. Gleason, who developed it with other colleagues at the Minneapolis Veterans Affairs Hospital during the 1960s.35This
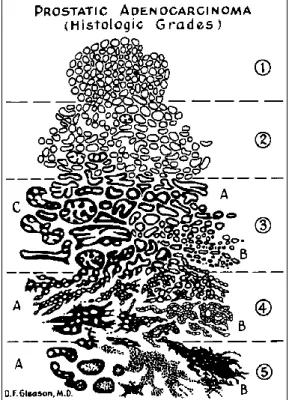
unique grading system for prostate carcinoma was based solely on the architectural pat-tern of the tumor. The system was updated in 2005 by Inpat-ternational Society of Urological Pathology (ISUP) consensus conference.36Gleason grades range from 1−5, where 5 is considered the most aggressive pattern (shown in Figure 1.6). The descriptions of the different patterns are:
Figure 1.6:Schematic representation of the different Gleason grades assigned to histologic patterns of prostatic adenocarcinoma. Image obtained from Humphrey37
1. Very well differentiated, small, closely packed, uniform, glands in essentially cir-cumscribed masses.
2. Similar (to pattern 1) but with moderate variation in size and shape of glands and more atypia in the individual cells; cribriform pattern may be present, still essentially circumscribed, but more loosely arranged.
3. Similar to pattern 2 but marked irregularity in size and shape of glands, with tiny glands or individual cells invading stroma away from circumscribed masses, or solid cords and masses with easily identifiable glandular differentiation within most of them. May be papillary or cribriform, which vary in size and may be quite large, but the essential feature is the smooth and usually rounded edge around all the circumscribed masses of tumor.
4. Large clear cells growing in a diffuse pattern resembling hypernephroma; may show gland formation. Raggedly infiltrating, fused-glandular tumor; glands are not single and separate, but coalesce and branch.
5. Very poorly differentiated tumors; usually solid masses or diffuse growth with little or no differentiation into glands. Can resemble comedocarcinoma of the breast; almost absent gland pattern with few tiny glands or signet cells.
A Gleason score is assigned by the pathologist by summing two numbers; the first number indicates the grade of the most common tumor pattern in the specimen, the
10 CHAPTER 1: Introduction
second number indicates the second most common pattern. If only one pattern is present in the tissue sample, the corresponding grade is multiplied by two to give the score. There is a difference in determining the Gleason score from a biopsy sample and radical prostatectomy specimens. A biopsy sample represents only a small part of tumor. If there are more than two patterns present in the biopsy specimen, the second number should refer to the remaining pattern with the highest grade. In a prostatectomy sample, the pathologist bases the primary and secondary Gleason grades on their prevalence. When a third pattern contains at least 5% of the total tumor volume, a tertiary grade can be included in the Gleason score.
The attending physician will use the biopsy Gleason score and other clinical parame-ters (i.e. PSA level, number of positive biopsy cores) to make a treatment decision.
1.3.3 Treatment options
When diagnosed with prostate cancer, there are several treatments possible. The most common choices are: active surveillance, radical prostatectomy, radiotherapy, and focal therapy.
Active surveillance can be provided to men with a low grade, localized, well-differ-entiated prostate tumor. It involves conservative monitoring of the tumor by repeated PSA measurements, DREs, TRUS guided biopsies, or even MR imaging (see also Section 1.6). Patients will not be treated immediately, though the urologist can intervene when the cancer progresses. Several studies have shown that in men with untreated, low-risk prostate cancer the 10- to 20-year survival rates are similar to an age-matched group of men without prostate cancer,38–40 showing potential for active surveillance. Initial results on active surveillance show that mortality rates are low, with moderate rates of intervention over the first few years.41,42
Radical prostatectomy and radiotherapy are ‘whole gland’ treatment options with intention to cure. Radical prostatectomy involves the complete surgical removal of the cancerous prostate. Radiotherapy can either be external beam radiotherapy or internal brachytherapy. In external beam radiation therapy, the patient receives radiation from an external source. Internal brachytherapy involves the implantation of radioactive seeds into the prostate. Cancer recurrence and survival rates are relatively similar. However, side-effects like urinary leakage and erectile dysfunction are reported and may play a role in the patients’ decision of treatment.43–46
Recently, minimal invasive focal therapies have been under investigation. Several options are available: laser interstitial thermotherapy (LITT), cryo-ablation, and high-intensity focused ultrasound (HIFU). Although initial results are promising, especially for localized, low-grade prostate cancer, they are currently not yet widely available clinically.
1.4
Prostate cancer screening
The growth and aging of the population are causing an increase in the number of prostate cancer diagnoses and an increase in men who will require treatment for their malignancy.
Screening can help find cancer at an early stage when the disease is easily manageable. However, caution is required for potential overtreatment.
Possible methods used in prostate cancer screening are DRE and PSA blood testing, usually combined with subsequent TRUS guided biopsy. DRE or PSA testing is essentially used as a triage test for the more invasive TRUS guided biopsies. PSA testing requires a predetermined cut-off value, which limits the sensitivity of the screening program. The PSA cut-off level is a source of discussion.47–49Lowering the cut-off value will increase the sensitivity, but reduce the specificity.50
Screening trials in Europe and the USA include respectively the European Random-ized Study of Screening for Prostate Cancer (ERSPC) and the Prostate, Lung, Colorectal, and Ovarian (PLCO) Cancer Screening Trial.51–53Results show that screening helps to diagnose prostate cancer at an earlier stage and was associated with an increase in in-cidence.54The ERSPC trial showed a mortality reduction of 20%,52and when adjusted for nonattendance and contamination this reduction increased to approximately 30%.55 However, official statistics tended to overreport prostate cancer as an underlying cause of death, which would overestimate the true effect in favor of screening.56Another side-effect is that screening would cause a large amount of over-diagnosis and over-treatment. To save one life, 1055 men had to be screened and 37 men had to be treated for prostate cancer.53
So there is certainly potential for prostate cancer screening, but currently controversy regarding the effectiveness still exists.54An alternative technique with higher specificity
for prostate cancer might make screening more feasible. Alternatives are being explored (e.g. prostate MRI, Section 1.6).
1.5
Drawbacks of current practice
A PSA test followed by systematic (on average 12 core) TRUS guided biopsy is the currently internationally accepted diagnostic procedure to detect prostate carcinoma and determine patient management.28However, this diagnostic procedure is subject to false-positive as well as false-negative results. First of all, the PSA blood test is often false-positively elevated due to the fact that elevated PSA levels are also measured at benign conditions such as prostatitis or BPH. Its specificity is therefore relatively low.50,57 Also, false-negative results can occur if men with prostate cancer do not have elevated PSA levels. Pelzeret al.58 showed that more than one third of prostate cancer cases occurred in the lower PSA ranges (2.0-3.9 ng/mL).
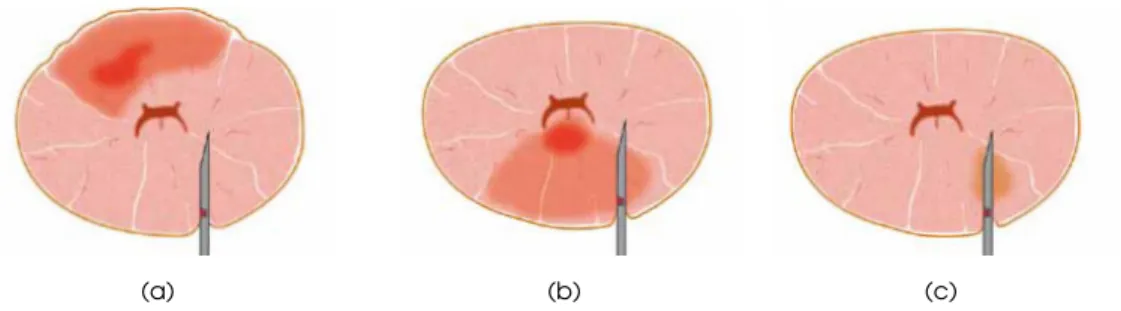
Furthermore, the subsequent TRUS guided biopsies have a relatively poor detection rate due to sampling errors (some examples are shown in Figure 1.7). Reason for this is that localization of malignant tissues on ultrasound is difficult. Up to 30% of the prostate cancer lesions are isoechoic and undetectable by gray-scale ultrasound.23,59
The ultrasound guided approach is thus merely used to guide systematic biopsies in which specific regions throughout the prostate are sampled without knowing where tumors are located, rather than targeted biopsy of a palpable nodule or a lesion visible by
12 CHAPTER 1: Introduction
(a) (b) (c)
Figure 1.7:Cross sections of the prostate showing the limitations of TRUS guided biopsy. (a) The needle
penetrates next to the tumor or does not reach it. (b) Wrong part of the tumor is biopsied causing underestimation of aggressiveness. (c) Insignificant (non-aggressive) tumor is biopsied.
imaging. Systematic TRUS guided biopsy misses nearly a quarter of detectable cancers on the first biopsy session and has a low sensitivity of around 40%.30,60,61Several studies have demonstrated discrepancies between the Gleason score of the biopsy tissue and the subsequent radical prostatectomy specimen.62–65Significant cancers are missed (Figure 1.7(a)) or underestimated (Figure 1.7(b)), and there is overtreatment due to overdiagnosis (Figure 1.7(c)).
Combining the results of PSA testing and TRUS guided biopsies, we can conclude that there is a need for a more accurate method for detecting prostate cancer and correctly determining the cancer aggressiveness.
1.6
MR imaging of the prostate
Magnetic resonance imaging (MRI) of the prostate made its emergence in the 1980s.66 The zonal anatomy of the prostate could be visualized on T2-weighted imaging due to high spatial resolution and high tissue contrast. Current state-of-the-art prostate MRI is characterized by its multiparametric approach. Anatomical T2-weighted imaging is combined with functional imaging techniques such as dynamic contrast-enhanced (DCE), diffusion-weighted imaging (DWI), and magnetic resonance spectroscopic imaging (MRSI). Functional parameters provide additional information on biological properties of prostatic tissue. Modern prostate MRI is usually acquired on a 1.5 or 3 tesla (T) MRI scanner. A radiofrequency-emitting coil is placed next to the prostate using either a (surface) pelvic phased-array coil or an (internal) endo-rectal coil.67
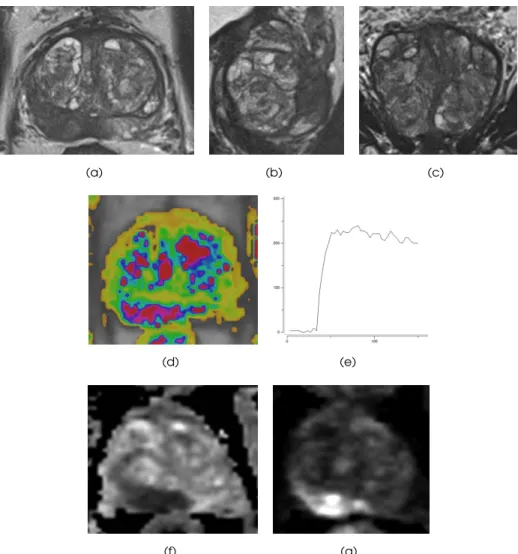
T2-weighted imaging is the best modality for anatomical assessment of the prostate and its surrounding structures. It has the highest resolution and the best soft tissue contrast. Usually three orthogonal views are acquired, i.e. transversal, sagittal, and coronal, with a high in-plane resolution and relatively thick slices (Figures 1.8(a)–(c)). The central zone, transition zone, and fibromuscular stroma are usually hard to differentiate radiologically and are grouped together as the central gland.68 The central zone has usually a dark appearance with a chaotic structure, opposing the bright homogeneous appearance of the peripheral zone.
(a) (b) (c)
(d) (e)
(f) (g)
Figure 1.8: Example of a multiparametric MRI. (a) Transversal weighted image. (b) Sagittal
T2-weighted image. (c) Coronal T2-T2-weighted image. (d) DCE image. (e) Curve of the DCE image. (f) ADC map. (g) DWI withb= 1400.
14 CHAPTER 1: Introduction
DCE imaging is based on the permeability of blood vessels and extravasation of contrast agent into the adjacent tissue.69 A sequential set of T1-weighted images is acquired over time following the administration of an intravenous contrast agent. Leaky endothelial cells have an increased permeability causing fast contrast enhancement, which is a typical feature of prostate cancer. The enhancement pattern can be expressed in different curve types as illustrated in Figure 1.9. Figure 1.8(d) shows an example of a DCE image, the corresponding curve is depicted in Figure 1.8(e).
DWI quantifies the random Brownian motion properties of water molecules in tis-sue.70The degree of restriction to water molecules in biologic tissue is inversely correlated to the cellular density. Tumors often show restricted diffusion compared to benign tissue. The net displacement of molecules is called the apparent diffusion coefficient (ADC), which can be derived from a series of diffusion images using different parameters (i.e. b-values). An example of an ADC map and correspondingb1400 image is shown in Figures 1.8(f),(g) respectively.
MRSI allows to evaluate changes in metabolite concentrations within the prostate.71 The ratio of choline and creatinine relative to citrate is used as marker for prostate cancer.
1.6.1 Prostate cancer diagnosis on MRI
Currently, multiparametric (mp)-MRI is the most sensitive and specific technique for localizing prostate cancer.72It has shown great potential in the localization and grading of prostate cancer.73A combination of anatomical T2-weighted MRI, dynamic
contrast-enhanced MRI, and diffusion-weighted MRI improves the accuracy of prostate cancer detection over T2-weighted imaging alone.74–76Additionally, recent research has investi-gated the correlation between DWI and tumor aggressiveness. The apparent diffusion coefficient (ADC) determined at DWI has proven to be inversely correlated to the Gleason grade in peripheral zone prostate cancer.77–80
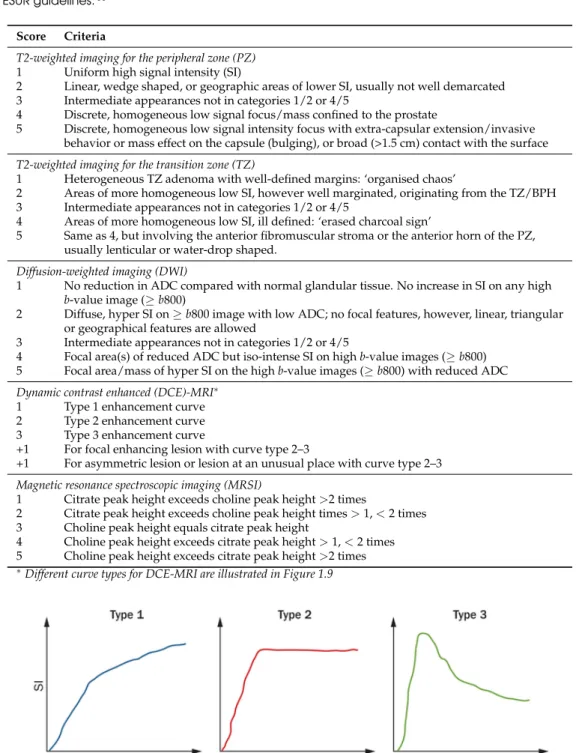
Although MRI for prostate cancer certainly has potential, interpretation of mp-MRI suffers from observer variability81 and requires a high level of experience.82A major issue with broad adaptation was the professional disagreement on what parameters to use and how to interpret them.83,84A group of prostate MR imaging experts have developed a set of clinical guidelines with the aim to standardize prostate MRI: the Prostate Imaging and Reporting Archiving Data System (PI-RADS).85 The PI-RADS scoring system is summarized in Table 1.1. Bomers and Barentsz86 provided a detailed explanation illustrated with examples for every single parameter in mp-MRI. The example in Figure 1.8 shows a lesion scored as PI-RADS 5 for all three parameters.
The ESUR guidelines recommend to perform mp-MRI consisting of at least T2-weighted imaging and two functional modalities (DCE and DWI), with MRSI being an optional parameter. Every modality is scored independently on a 5-point scale. Since no rules are specified for determining the final lesion score, several studies calculated a PI-RADS sum score.88–90An update of the guidelines will prescribe that the ‘dominant’
Table 1.1:PI-RADS scoring system for multiparametric MR imaging of the prostate, as described by the ESUR guidelines.85
Score Criteria
T2-weighted imaging for the peripheral zone (PZ) 1 Uniform high signal intensity (SI)
2 Linear, wedge shaped, or geographic areas of lower SI, usually not well demarcated 3 Intermediate appearances not in categories 1/2 or 4/5
4 Discrete, homogeneous low signal focus/mass confined to the prostate
5 Discrete, homogeneous low signal intensity focus with extra-capsular extension/invasive behavior or mass effect on the capsule (bulging), or broad (>1.5 cm) contact with the surface T2-weighted imaging for the transition zone (TZ)
1 Heterogeneous TZ adenoma with well-defined margins: ‘organised chaos’
2 Areas of more homogeneous low SI, however well marginated, originating from the TZ/BPH 3 Intermediate appearances not in categories 1/2 or 4/5
4 Areas of more homogeneous low SI, ill defined: ‘erased charcoal sign’
5 Same as 4, but involving the anterior fibromuscular stroma or the anterior horn of the PZ, usually lenticular or water-drop shaped.
Diffusion-weighted imaging (DWI)
1 No reduction in ADC compared with normal glandular tissue. No increase in SI on any high b-value image (≥b800)
2 Diffuse, hyper SI on≥b800 image with low ADC; no focal features, however, linear, triangular or geographical features are allowed
3 Intermediate appearances not in categories 1/2 or 4/5
4 Focal area(s) of reduced ADC but iso-intense SI on highb-value images (≥b800) 5 Focal area/mass of hyper SI on the highb-value images (≥b800) with reduced ADC Dynamic contrast enhanced (DCE)-MRI∗
1 Type 1 enhancement curve 2 Type 2 enhancement curve 3 Type 3 enhancement curve
+1 For focal enhancing lesion with curve type 2–3
+1 For asymmetric lesion or lesion at an unusual place with curve type 2–3 Magnetic resonance spectroscopic imaging (MRSI)
1 Citrate peak height exceeds choline peak height>2 times
2 Citrate peak height exceeds choline peak height times>1,<2 times 3 Choline peak height equals citrate peak height
4 Choline peak height exceeds citrate peak height>1,<2 times 5 Choline peak height exceeds citrate peak height>2 times ∗Different curve types for DCE-MRI are illustrated in Figure 1.9
Figure 1.9:Curve types representing enhancement patterns on DCE-MRI. Type 1 represents progressive
enhancement, type 2 represents rapid enhancement with plateauing, and type 3 represents rapid enhancement followed by a rapid wash out of the contrast material. Image obtained from Johnson
et al.87
16 CHAPTER 1: Introduction
Figure 1.10:During the MRI-guided biopsy the worst part of the tumor can be specifically targeted.
parameter should determine the final PI-RADS score, being DWI for peripheral zone and T2-weighted imaging for central gland.86
Several studies have evaluated the performance of the PI-RADS guidelines. These show that the PI-RADS score can help to localize possible prostate lesions and indicate the likelihood of cancer of suspicious lesions.88,89,91
1.6.2 MR guided biopsy
The first MR guided prostate biopsy was done in 1986.92 Since then, MR imaging and biopsy techniques have improved significantly.
MR guided biopsy uses mp-MRI for accurate prostate cancer localization to direct the biopsy needle towards (the most aggressive part of) the prostate cancer, as depicted in Figure 1.10. T2-weighted imaging with additional functional sequences are used to define targets. Most commonly used techniques in clinical studies are DCE and DWI.93–97MR guided biopsies that are targeted to the lowest signal areas on the ADC map within the tumor determine the Gleason grade in exact concordance with prostatectomy in 88% of the cases, which is substantially higher than TRUS systematic biopsy (55%).98MR guided biopsy has resulted in prostate cancer detection rates ranging from 38−59% using far less cores (median 4) compared to systematic TRUS biopsies (8−12 cores).94,95,99–102
The negative predictive value of mp-MRI for excluding significant prostate cancer has shown to be around 90%.103,104This means that mp-MRI can be used to help men at risk and decide whether they should proceed to prostate biopsy. Parts of the prostate that were negative at mp-MRI do not require biopsy, leading to a reduction of the total number of biopsies (up to 50%104). A study on cost-effectiveness showed that total costs
overdiagnosis and overtreatment leads to an improvement in the quality of life.105MR guided biopsy can therefore be a more cost-effective solution than the systematic TRUS guided biopsy.
1.7
MR-TRUS fusion
Despite its versatile capabilities, MRI is not as widely available or as easy to apply to prostate imaging as is ultrasound (US). Issues of cost, access, scanner time, technical requirements and radiologists’ acceptance and understanding of the procedure are con-tinuing challenges.106By combining advantages of both MR and TRUS imaging, MR guided TRUS biopsy is a potentially more accessible and practical solution than in-bore MR guided biopsies. Pre-acquired MR images can be used to enhance TRUS imaging and improve needle guidance by registration of the two modalities.107 Accurate MR-TRUS registration requires to take into account prostate deformation and motion inherent to TRUS probe insertion and prostate scanning. Available methods vary in accuracy, speed, and user-friendliness. Two strategies can be distinguished: cognitive fusion and computational fusion.
1.7.1 Cognitive fusion
Cognitive fusion is the first strategy using MR-TRUS registration. It fuses the two modalities by means of visual or cognitive fusion (sometimes referred to as mental fusion). It is the simplest MR guided biopsy technique and requires no additional equipment. With this technique, the physician performing the TRUS guided biopsy reviews the lesion on MRI and uses this knowledge to aim the biopsy needle at the appropriate prostate area for a targeted MR guided TRUS biopsy.108–110The reported results of cognitive fusion biopsy are contradictory: a study by Puechet al.111did not show a significant difference between computer-assisted MR-TRUS fusion and cognitive fusion, whereas a study by Delongchampset al.112showed that cognitive fusion biopsies do not perform better than systematic TRUS guided biopsies. The main disadvantage of this technique is that it requires experience and training and leads to inaccuracies, subjectivity, variability, and lack of reproducibility.109As the accuracy of cognitive fusion depends very much on the skills of the operating physician, it is likely that this technique is not as effective at locating lesions for biopsy as direct in-bore MR and computer-assisted MR guided TRUS biopsies.
1.7.2 Computational fusion
Computational (or computer-assisted) registration of MR and US images is the second MR-TRUS registration strategy. Compared to cognitive fusion, it is potentially a more accurate way of image fusion requiring less operator skills but more computation time. MR image information is very different from information obtained from US images. Therefore, MR-US registration methods are often surface-based, i.e. the capsule is aligned by registering a surface representation reconstructed typically from cross-sectional contours.
18 CHAPTER 1: Introduction
The main challenge is to compensate for shape differences between MR and US images due to prostate deformation and motion. Computer-assisted registration methods can be roughly subdivided into two categories: rigid and non-rigid registration methods.
Computer-assisted rigid registration is a relatively easy and fast computation-based registration method. Xuet al.113 describe a method for the real-time rigid registration of MR and TRUS images during freehand transrectal biopsy. A reconstructed 3D TRUS volume was manually registered with a 3D MRI volume. Rigid motion compensation is based on an image registration between the reference 3D US volume and the intra-operative 2D US images. However, the prostate gland is not a rigid structure. Prostate motion can arise from a number of causes, of which the most important one is probably the insertion of the TRUS probe. Significant gland motion can therefore occur between MR and TRUS imaging.114The disadvantage of rigid registration is that it does not take any of these motions into account. To reduce potential errors due to prostate deformation on TRUS images, Ukimuraet al.115introduced a plastic outer-frame of the TRUS probe that was placed in the rectum during MR image acquisition.
Computer-assisted non-rigid registration, on the other hand, is able to compensate for deformations of the prostate. Singhet al.116 describe a manual method for the real-time non-rigid registration of MR and TRUS images. This method, however, requires significant user interaction. Automatic registration is more challenging and requires more computation time, but has the advantage of being less dependent on operator skills. Narayananet al.117propose a non-rigid registration that was achieved by an initial deformable registration of the prostate surface, segmented from both the MR and TRUS images, followed by a linear elastic warping of the gland volume using an adaptive focus deformable model with surface point displacements as boundary conditions. Mitra et al.118 present a method to non-rigidly register TRUS and MR images in correspond-ing 2D slices. The Bhattacharyya distance is used to establish point correspondences on manually segmented prostate contours. An extended non-linear thin-plate spline (TPS) algorithm was applied to the corresponding point sets. The performance of the proposed method was compared against traditional B-splines and TPS-based deformable registration methods and has a significantly better registration accuracy. A 3D prostate biopsy tracking system with deformation estimation was published by Baumannet al.29
A volume-swept 3D US-based tracking system solves the patient motion problem with an a priori model of rectal probe kinematics. Prostate deformations are estimated with elastic registration. By incorporating the algorithm proposed by Martinet al.119, MR to 3D TRUS registration is performed for clinical applications. They build a mesh from the MR volume and shape and volume constraints are used to guide surface deformation.
There are many different methods, but in general deformable non-rigid registration is more accurate than rigid registration.112,120,121However, many methods are based on relatively simple volume interpolation that are not always physically plausible.122Image
Internal prostate gland motion and deformation can be better predicted by applying biomechanical modeling using finite element (FE) analysis.123–125A biomechanical model of the prostate can be constructed by assigning boundary conditions and elastic properties to the tissue. The prostate deformation can be simulated and internal gland motion can then be predicted. Alterovitzet al.123 use a biomechanical model based registration algorithm to non-rigidly register MR and MR spectroscopic images. Bharathaet al.124 apply a 3D FE-based deformable registration algorithm to pre- and intraoperative MR studies. A biomechanical model of soft-tissue deformation was also used to predict the actual internal prostate deformation due to a TRUS probe for MR-TRUS registration.125 This method is based on a side-firing TRUS probe and has been applied to transperineal MR guided TRUS biopsies.
1.7.3 Clinical MR-TRUS fusion systems
Multiple MR-TRUS fusion systems based on different computation registration algorithms have been developed. The existing systems with published clinical data are summarized in Table 1.2.109The general workflow is to acquire pre-biopsy diagnostic MR images used
to identify lesions suspicious for prostate cancer. During the biopsy session, MRI and real-time TRUS images are superimposed and displayed either side-by-side or as blended fusion image.
One of the major differences between the different fusion systems is the registration method. Some clinically available devices are based on a rigid registration method, mostly using an electro-magnetic (EM-) tracker placed on the TRUS probe to track movements of the probe. Patient movement or prostate deformation are not taken into account. Other devices do correct for movement and deformation by tracking the organ itself instead of the TRUS probe. These incorporate a non-rigid registration algorithm. Another solution to reduce prostate deformation due to the TRUS probe is by transperineally biopsying the prostate after MR-TRUS fusion. Some systems have the additional option to archive the biopsy location.
Another major difference is the amount of manual operator input. Some methods require manual identification of paired landmarks or manual prostate segmentation. Others are more automated, with automatic segmentation and the ability to correct for motion compensation. Some systems require additional manual ‘fine-tuning’. Less human input increases the reproducibility as there is less room for (manual) errors. Learning curves may also vary between the different systems.109
The overall results of clinical studies show that targeted prostate biopsy using MR-TRUS fusion has a significantly higher tumor detection rate compared to conventional systematic TRUS guided biopsies (Table 1.3).111,112,126–129 These studies use different commercially available clinical fusion systems, and all of them show a higher detection rate with MR guided TRUS biopsy of especially clinically significant prostate cancer when compared to systematic TRUS guided biopsy. Diagnosis of insignificant disease is avoided. MR guided TRUS biopsy upgrades and detects higher Gleason grade cancer in
20 CHAPTER 1: Introduction Ta ble 1.2 : Specification summ ar y of MR-US fusion systems (ada pted fr om Log an et al. 109 ). Fusion system -T rade name (Manufactur er)
Principle investigator location
MRI US Biopsy MRI Parameters Endor ectal/ US image Method of T racking Biopsy # Cor es per used to pelvic coil acquisition image mechanism route MRI lesion/ define tar get registration Comparator UroNav ( In V ivo Bethesda, 3T Philips T2W , DCE, Y es/Y es Manual US Rigid EM tracking T rans-Minimum 2/ Corp./Philips) MD,USA DWI, MRSI 2D sweep. US rectal 12-cor e TRUS Fr eehand manipulation of US pr obe. Artemis Los Angeles, 3T Siemens T2W , DCE, No/No Manual rota-Elastic Mechanical T rans-Mean 2.2/ (Eigen) CA, USA DWI tion along a arm with rectal 12-cor e TRUS fixed axis encoded (US pr obe on joints a tracking arm Urostation Paris, 1.5T Siemens T2W , DCE, Y es/Y es Automatic US Elastic Image-based T rans-Minimum 2/ (Koelis) France DWI pr obe rotation, registration rectal 10-12-cor e TRUS Oslo, 1.5T Siemens T2W , DWI Y es/No thr ee dif fer ent Minimum 2/ Norway volumes 12-cor e TRUS Gr enoble, 3T Philips T2W , DCE, No/No elastically 2/ France DWI register ed 12-cor e TRUS BiopSee Heidelber g, 3T Siemens T2W , DCE No/No Custom-made Rigid Stepper with T rans-Median 4/ (Pi Medical Germany DWI biplane TRUS two built-in perineal 12-cor e TRUS /MedCom) pr obe mounted encoders on a stepper V irtual Paris, 1.5T Siemens T2W , DCE Y es/Y es Manual US Rigid EM tracking T rans-Minimum 2/ Navigator France DWI sweep. Fr ee-US and rectal 10-12-cor e TRUS (Esaote) Lille, 1.5T Philips T2W , DCE No/Y es hand rotation needle Minimum 2/ France DWI of US pr obe. 12-cor e TRUS HI R VS/Real-Chiba, 1.5T Philips T2W , DCE No/Y es Real-time Rigid EM tracking T rans-1-2/ T ime V irtual Japan DWI biplanar TRUS rectal or 10-cor e TRUS Sonography trans-(Hitachi) perineal
24−32% of patients.111,112,128However, this does not (yet) reach the performance of in-bore MR guided biopsy which has shown a 41% reduction of TRUS undergrading.98For correct Gleason grading with MR guided TRUS biopsy, an accurate spatial registration of MR and US images is required. Current MR-US fusion systems may require improvement to be able to (partly) replace in-bore MR guided biopsies. There certainly is potential for fusion biopsy but so far, there is no clear consensus on which methodology is optimal for screening, detection or surveillance, nor on the specific indications.
1.8
Outline of this thesis
Current clinical practice lacks sensitivity for prostate cancer detection. With the increasing number of PSA tests, or even screening in the future, an alternative technique for prostate cancer diagnosis is required. MRI has shown to be much better in prostate cancer detection, but is not ideal for biopsying the increasing number of patients. MR-TRUS fusion is an upcoming technique for prostate biopsies. Recent studies showed that MR-TRUS fusion biopsies are better than the systematic MR-TRUS guided biopsies. However, not much is known about the requirements and whether it is as good as in-bore MR biopsies. It is not yet clear what role MR-TRUS fusion can potentially play in prostate cancer diagnosis. The aim of this thesis is to investigate whether MR guided TRUS fusion biopsy is viable in clinical practice. Both technical requirements and clinical usability are addressed.
In chapter 2, the viability of MR-TRUS fusion biopsies as alternative to systematic TRUS guided biopsies is discussed. It includes a short overview of advantages and disadvantages of MR-TRUS fusion biopsies.
Chapter 3 focuses on the required registration accuracy. Many prostate cancers have a high-grade focal hotspot. Targeting this highest Gleason grade component solely based on fusion requires an accurate registration algorithm. Small targets might be missed with MR guided TRUS biopsies. The goal of this study was to determine the required registration accuracy, and how this is related to tumor volume. An estimation of the technical registration accuracy is made by simulating biopsies on a tumor population.
In chapters 4 and 5 the design of a surface-based registration method with biomechan-ical regularization is presented. Surface-based registration methods have their limitations, especially with respect to registration accuracy. Biomechanical modeling can better con-trol internal prostate deformation. The method developed extends a commonly used non-rigid surface-based registration method with biomechanical modeling. The registra-tion accuracy of this enhanced method was compared to the regular registraregistra-tion method to see whether this indeed improves. Chapter 4 evaluates the accuracy for MR-MR registration. Subsequently, in chapter 5 the method is extended further and applied to MR-TRUS registration.
Chapter 6 is concerned about the cancer visibility on TRUS images. Prostate cancer visible on TRUS using prior knowledge of MRI can be targeted under TRUS guidance, benefitting especially fusion biopsies. The aim of this observer experiment was to
22 CHAPTER 1: Introduction Ta ble 1.3 : P atient-based histological biopsy outcomes b y fusion system (ada pted fr om Log an et al. 109 ). Fusion system -T rade name (Manufactur er)
Principle investigator location Patient inclusion criteria
MRI Biopsy results Defining # Patients Pr ostate cancer Pr ostate P Additional/notable study lesion with MRI-detection in cancer conclusions suspicion suspicious patients with detection for pr ostate lesions MRI lesion TB;SB ∗ cancer (no. patients) UroNav ( In V ivo Bethesda, Aug 2007-Low , Low -123 (21%) 315/582 (54%) 253/315 -TB upgrades and detects higher Corp./Philips) MD,USA Au g 201 2 moderate, (21%); Moderate -patients (80%); Gleason scor e in 36% of patients or high 370 (64%); 255/315 compar ed with TRUS. High suspi-High -89 (15%) patients (81%) cion associated with high upgrade. Artemis Los Angeles, Mar 2010-Scor e 1-5 151/171 (88%) 84/151 (56%) 101/486 cor es 0.001 TB is thr ee times mor e likely to (Eigen) CA, USA Sep t 2011 (normal (20.8%); identify disease than SB with to highly 127/1741 cor es gr eater detection of intermediate-suspicious) (7.3%) to high-risk disease. Biopsy corr elates with MR suspicion. Urostation Paris, Jan 2011-Y es/No 82/133 (62%) 71/82 (87%) 62/82 patients -TB cancer detection significantly (Koelis) France Mar 2012 (76%);44/133 higher than SB. Cognitive TB not patients (33%) significantly dif fer ent fr om SB. Oslo, Dec 2010-Low , 80/90 (89%) 54/80 (67.5%) 60/115 tar gets -10 patients negative MRI all nega-Norway May 2011 medium, patients. Lesions (52%); 6/42 tive SB. 97% MRI tar gets successful, or high -High (55), patients (14%) 52 positive for cancer . Medium (6), Low (4) Gr enoble, Nov 2011-PI-RADS 20/30 (67%) 11/20 (55%) / -Ur ostation has good accuracy for France Aug 2012 tar geting suspicious ar eas on MRI BiopSee Heidelber g, June 2010-Highly Highly suspicious: Overall: 200/347 386/1281 cor es 0.01 TB detects significantly mor e cancer (Pi Medical Germany Dec 2011 suspicious, 104/347 (30%). (58%). Highly (30%); 523/6326 SB and of gr eater significance. /MedCom) questionable Questionable: 149 suspicious: 82.6%. cor es (8.2%) Patients without suspicious MR-or not (43%). Not Questionable: 67% lesions wer e diagnosed with suspicious suspicious 94 (27%) Not suspicous: intermediate-risk disease. 14.8% V irtual Paris, Jan 2011-Y es/No 78/131 (59%) 78/78 (100%) 64/78 patients -Rigid system TB wer e significantly Navigator France Mar 2012 (82%); 60/131 higher than SB. Cognitive TB not (Esaote) patients (46%) significantly dif fer ent fr om SB. Lille, May 2009-1-5 95/95 (100%) -66/95 patients 0.033 Clinically significant cancer 52% SB, France Jan 2011 (unlikely (69%) †; 56/95 67% TB patients ( P = 0.001). Cogni-to highly patients (56%) tive vs platform fusion not signifi-likely) cantly dif fer ent detection/grading. HI R VS/Real-Chiba, Feb 20 07-Y es/No 85/85 (100%) 52/85 (61%) 62/192 cor es < 0.01 TB cor es revealed mor e cancer than T ime V irtual Japan A ug 2009 (32%); 75/833 SB. Sonography cor es (9%) (Hitachi) ∗TB: tar geted biopsy; SB: systematic biopsy †Combination of cognitive and Vnav fusion cor es
termine the proportion of tumors that are visible when using prior knowledge of MRI appearance.
In chapter 7, the clinical feasibility of a MR-TRUS fusion biopsy system is tested. A simple EM-based rigid registration technique can be enhanced with local reference augmentation, thereby optimizing registration accuracy locally around the lesion. Local MR-TRUS fusion biopsy may be a viable method providing a definite diagnosis for a selection of patients. If not, MR guided biopsy will be recommended. Based on the initial results, an indication of the cancer detection rate and the representativeness is given.
This thesis is concluded with a summary of the main results and a general discussion in chapter 8. Clinical implications and future perspectives are provided as well.
2 – A viable alternative?
Wendy J. M. van de Ven, Jelle O. Barentsz
Original title:Prostate cancer: MRI/US-guided biopsy – a viable alternative to TRUS-guidance
26 CHAPTER 2: A viable alternative?
Abstract
MRI/ultrasonography (MRI/US)-fusion biopsy outperforms systematic ultrasonography-guided biopsy, detecting more high-grade prostate tumours while being less able to detect low-grade cancer, thus preventing overtreatment of indolent tumours. Any of several MRI-guided biopsy techniques has the potential, therefore, to replace systematic transrectal ultrasonography-guided prostate biopsies in the future.
Systematic transrectal ultrasonography (TRUS)-guided biopsy is the current clinical standard method for diagnosing prostate cancer. However, TRUS-guided biopsy can miss and undersample aggressive tumours and detect indolent cancers by chance. Multi-parametric (mp)-MRI has been shown to be highly accurate in detecting and localizing intermediately aggressive and highly aggressive cancers. Biopsy under direct MRI or MRI/ultrasonography (MRI/US) guidance is, therefore, rapidly emerging as an alter-native to TRUS-guided biopsy. Siddiquiet al.128 are one of the first groups to report a large prospective study comparing MRI/US-fusion-guided biopsy with systematic TRUS-guided biopsy. They show that targeted MRI/US-fusion-guided biopsy detects a higher number of aggressive cancers than TRUS-guided biopsy, and avoids detection of indolent cancers. These results are in line with other studies.111,112,129
However, caution is required before embarking on immediate large-scale implemen-tation of MRI-guided biopsy techniques for men with suspected prostate cancer. An experienced MRI radiologist is crucial for obtaining good biopsy samples, as optimal acquisition and standardized interpretation of mp-MR images is essential. Acquisition and interpretation of the mp-MR images requires skills that can only be obtained by good training and experience. Minimal requirements for prostate mp-MR image acquisition and standardization for reporting (PI-RADS) have recently been published,85which will help to improve the general reliability of the techniques.
Furthermore, any MRI-guided biopsy technique used clinically should be state-of-the-art. Several MRI-guidance techniques – including direct ‘in-bore’ MRI-guided, MRI/US-fusion-guided, and cognitive-fusion-guided biopsy – exist,110 but not all are equally
accurate. Direct MRI-guided biopsy95is likely to be the most accurate technique as it is less prone to fusion and motion errors. Thus, direct image-guided biopsy is used in most oncologic applications and can easily locate a lesion detected on a previous MRI study, enabling very accurate targeting. With this technique, aggressive cancers as small as 2 mm in diameter can be targeted. Hambrocket al.98 compared direct MRI-guided biopsy to TRUS-guided biopsy using prostatectomy as reference standard. Using direct MRI-guided biopsy resulted in a 41% reduction of TRUS undergrading of intermediately aggressive and highly aggressive tumours. This result is greater than the 32% reduction after using MRI/US-fusion-targeted biopsy reported by Siddiquiet al.128However, direct MRI-guided biopsy also has potential disadvantages: it is not yet widely available and can be relatively expensive compared with TRUS-guided biopsy. However, cost effectiveness has not been studied for this technique, so it remains unclear what the effects are on the total cost for health-care systems and the potential improvement in patients’ quality of life.
The second MRI-guided biopsy method is MRI/US-fusion-guided biopsy. This might seem an attractive alternative to direct MRI-guided biopsy, because of the limited avail-ability of the latter technique. However, as it is indirect, it is, therefore, prone to a large variation in accuracy. Furthermore, collaboration of a skilled MRI radiologist and a urolo-gist familiar with MRI – which is not available in all centres – is a prerequisite for carrying
28 CHAPTER 2: A viable alternative?
out the biopsy procedure. Siddiquiet al.128have reported excellent results, as their group contains two highly skilled prostate MR-radiologists, who were directly involved in the biopsy procedure. Furthermore, they used an advanced technique compensating as much as possible for changes in prostate shape between MR and TRUS images. Additionally, their procedure included motion correction during scanning. Any misregistration will negatively affect the biopsy outcome. Some MRI/US-fusion techniques provide similar technologies, but others do not include these advanced solutions – their registration often does not compensate for difference in prostate shape and motion correction and the target registration accuracy is, therefore, expected to be less optimal. Thus, each different MRI/US-fusion technique needs to be validated before its widespread use.
To achieve good results with MRI/US-fusion-guided prostate biopsies, optimal regis-tration accuracy is critical. Van de Venet al.130have shown that a registration accuracy of 1.9 mm is required for correctly grading 95% of tumours with MRI/US-fusion biopsy. To our knowledge, only one study125has reported the actual target registration error of MRI/US-fusion. That particular technique resulted in a median target registration error of 2.4 mm. At this accuracy, it is likely that smaller (3–5 mm) lesions are missed. Siddiqui et al.128do not report on their target registration error. To compensate for this potential error, they sample 2–3 cores per lesion, which is more than usually required with direct MRI-guided biopsy. However, it remains unclear whether small, highly aggressive focal tumour ‘hot spots’ were accurately sampled using this approach. A further critical tech-nological element is the ability to accurately register an MR image to an ultrasonograph image during biopsy in real-time.
Another drawback of MRI/US-fusion is that it relies on accurate prostate segmenta-tion. This means that the prostate needs to be outlined – manually or semiautomatically – on both MR and US images. This segmentation is a time-consuming task and is operator dependent. Siddiquiet al.128 do not report the time needed for prostate segmentation, nor provide details about the used method and its accuracy.
Furthermore, with MRI/US-fusion it is tempting and very easy for the urologist to take random biopsy samples at the same time and, therefore, find insignificant cancer, thereby removing one of the advantages of targeted biopsies.
The third MRI-guided prostate biopsy method is cognitive-fusion. With this technique the physician performing the TRUS-guided biopsy reviews the lesion on mp-MRI and uses this information to select the appropriate area for a targeted TRUS-guided biopsy. The reported results of cognitive-fusion biopsy are contradictory: a study by Puech et al.111 did not show a significant difference between MRI/US-fusion and
cognitive-fusion, whereas a study by Delongchampset al.112showed that cognitive-fusion biopsies do not perform better than TRUS-guided biopsies. As the accuracy of the cognitive-fusion technique depends very much on the skill of the operator, it is likely that this technique is not as effective at locating lesions for biopsy as direct MRI and MRI/US-fusion biopsy.
Overall, we agree with the conclusion drawn by Siddiqui and colleagues,128who
MR image acquisition and standardized (PI-RADS) interpretation, combined with accu-rate MRI-guided biopsy, is essential. Advanced targeted MRI/US-fusion guided biopsy techniques are already more accurate than systematic TRUS-biopsies. However, targeting lesions relies solely on the accuracy of the fusion method used, so one must keep in mind that small (3–5 mm) focal hot spots of aggressive cancer are prone to being missed even with optimal MRI/US-fusion techniques. Thus, small lesions or lesions that are difficult to reach with MRI/US-fusion biopsy should be biopsied under direct MRI-guidance. Larger lesions can be targeted using MRI/US-fusion alone. Future studies should be performed to determine the threshold tumour size and to compare the accuracy of both techniques.
3 – Required registration accuracy
Wendy J. M. van de Ven, Christina A. Hulsbergen-van de Kaa, Thomas Hambrock, Jelle O. Barentsz, Henkjan J. Huisman
Original title:Simulated required accuracy of image registration tools for targeting high-grade cancer components with prostate biopsies
32 CHAPTER 3: Required registration accuracy
Abstract
Objectives:To estimate the required spatial alignment accuracy for correctly grading 95%
of peripheral zone (PZ) prostate cancers using a system for multiparametric magnetic resonance (MR) guided ultrasound (US) biopsies.
Methods:PZ prostate tumours were retrospectively annotated on multiparametric MR
series using prostatectomy specimens as reference standard. Tumours were grouped based on homogeneous and heterogeneous apparent diffusion coefficient (ADC) values using an automated ADC texture analysis method. The proportion of heterogeneous tumours containing a distinct, high Gleason grade tumour focus yielding low ADC values was determined. Both overall tumour and high-grade focal volumes were calculated. All high-grade target volumes were then used in a simulated US biopsy system with adjustable accuracy to determine the hit-rate.
Results: An ADC determined high-grade tumour focus was found in 63% of the PZ
prostate tumours. The focal volumes were significantly smaller than the total tumour volumes (median volume of 0.3 mL and 1.1 mL respectively). To correctly grade 95% of the aggressive tumour components the target registration error (TRE) should be smaller than 1.9 mm.
Conclusions:To enable finding the high Gleason grade component in 95% of PZ prostate
tumours with MR guided US biopsies, a technical registration accuracy of 1.9 mm is required.
3.1
Introduction
Prostate cancer is the second most common diagnosed malignancy in men in the Western World, and one of the leading causes of death from cancer.131The current routine clinical standard method for making a definite diagnosis of prostate cancer is transrectal ultra-sound (TRUS) guided biopsy. As prostate cancer is rarely visible on grey-scale ultraultra-sound, TRUS is merely used to guide systematic biopsies. This systematic approach misses nearly a quarter of detectable cancers on the first biopsy.30Furthermore it substantially underestimates the true Gleason score compared to radical prostatectomy specimens. In about 40% of Gleason scores≥7 on prostatectomy, the biopsy revealed a lower Gleason score.62,64,98So the number of correctly detected aggressive tumours is rather low with TRUS guided biopsy. For correct treatment decision and risk stratification, improved methods for correctly determining the Gleason score on biopsy are needed.
Magnetic resonance (MR) guided MR biopsy is a very promising technique for prostate biopsies. Firstly, multiparametric MR imaging (MRI) has proven to be an effec-tive technique to localize prostate cancer.73A combination of anatomical T2-weighted
MRI, dynamic contrast-enhanced MRI, and diffusion weighted MRI (DWI) improves the accuracy of prostate cancer detection over T2-weighted imaging alone.75,76Secondly, it
has been shown that MR guided MR biopsy significantly increases the tumour detec-tion rate as compared to TRUS systematic biopsy.94 Additionally, recent research has
investigated the correlation between DWI and tumour aggressiveness. The apparent diffusion coefficient (ADC) determined at DWI has proven to be inversely correlated to the Gleason grade in peripheral zone (PZ) prostate cancer.77–79MR guided MR biopsies are therefore targeted to the lowest signal areas on the ADC map within the tumour. It has moreover been shown that ADC guided biopsy determines the Gleason grade in exact concordance with prostatectomy in 88% of the cases, which is substantially higher than TRUS systematic biopsy (55%).98However, disadvantages of MR guided MR biopsies are that such a system is not widely available and is costly.
MR guided TRUS biopsy is potentially a more cost-effective alternative. The question remains however whether this can also result in a correct sampling of the most aggressive part of the tumour and thus accurately predict its true aggression. An important aspect of this method is the correct spatial alignment of the MR and TRUS images using fusion methods. For merely detecting the tumour, MR-TRUS fusion with reasonable accuracy may be sufficient. But accurate Gleason grading depends on accurate targeting of biopsies to the most aggressive tumour component. Many clinically significant tumours show different Gleason patterns within the same tumour.132,133These so-called heterogeneous tumours thus require a more accurate registration method for a correct Gleason grading as the biopsy needs to be targeted to the smaller high-grade tumour volume component.
Fusion of MR and TRUS images is considered difficult and topic of current research in image registration. Recent works have investigated several MR to US registration methods, including rigid as well as nonrigid methods able to compensate for deforma-tions. Reported mean surface error is 3.3 mm, increasing to up to 12.7 mm in apex and
34 CHAPTER 3: Required registration accuracy
base.116However, this is based on the root mean square distance between TRUS-based and MRI-based segmentations of the prostate. Reported median target registration er-rors (TREs) are 5.1 (rigid) and 2.4 mm (nonrigid) in the mid plane, but increase at apex and base.125Clinical studies using rigid registration reported a significantly increased tumour detection rate upon targeted prostate biopsy with MR-US fusion compared to conventional TRUS guided biopsies.127,134Accurate Gleason grading depends however on accurate targeting of biopsies in the most aggressive tumour component.
In this article, we investigate the required accuracy of the registration for a correct Gleason grading with MR guided US biopsies. The current required accuracy is based on the widely used cutoff value of 0.5 mL for clinically significant tumour volumes.121,125 We hypothesize that for a correct Gleason grading of heterogeneous tumours, a higher accuracy is required. This registration accuracy depends on the size of the most aggressive tumour component, which we define as the high-grade tumour focal spot. Aggressive tumour components can be distinguished on multiparametric MRI (especially ADC) but not on US. We therefore used the ADC map to automatically determine the volume of the focal spot within an annotated tumour region. We first investigate the proportion of tumours being heterogeneous on ADC. Secondly, we determine the volume distribution of the most aggressive component of the heterogeneous tumours. Using this volume distribution, we then estimate the required maximal technical registration error for taking a representative biopsy of the most aggressive component under MR to US guidance by using a simulation system.
3.2
Materials and methods
3.2.1 Patients
Between August 2006 and January 2009, 56 consecutive patients with PZ prostate cancer, scheduled for radical prostatectomy, were referred from the departments of urology at the Radboud University Nijmegen Medical Centre and Canisius Wilhelmina Hospital in Nijmegen, The Netherlands, for clinically indicated routine MRI of the prostate. In all patients, prostatectomy was performed within 6 weeks of MR imaging. The requirement to obtain institutional review board approval was waived.
Five of the 56 patients were excluded owing to severe motion artifacts (n = 3), widespread intraprostatic hemorrhage (n =1), or severe ghosting artefacts on the MR images (n=1). The remaining data set contains 51 patients with 62 PZ tumours.
3.2.2 MR imaging protocol
Multiparametric MR imaging was performed on a 3.0-T MR system (Trio Tim; Siemens, Erlangen, Germany) with the use of both an endorectal coil (Medrad, Pittsburgh, PA, USA) and a pelvic phased-array coil. The endorectal coil was filled with a 40 mL perfluorocar-bon preparation (Fomblin; Solvay-Solexis, Milan, Italy). Peristalsis was suppressed with intramuscular administration of 20 mg butylscopolamine bromide (Buscopan;
Boehringer-Ingelheim, Boehringer-Ingelheim, Germany) and 1 mg of glucagon (Glucagen; Nordisk, Gentofte, Denmark).
The imaging protocol included anatomical T2-weighted turbo spin-echo MR imaging in transverse, coronal, and sagittal planes, covering prostate and seminal vesicles. Axial DWI was performed using a single-shot echo-planar imaging sequence with diffusion-module and fat-suppression pulses. Water diffusion was measured in three directions usingb-values of 0, 50, 500, and 800 s/mm2. The ADC maps were automatically calculated by the imager software using all fourb-values and a mono-exponential decay fit.
3.2.3 Histopathology
After radical prostatectomy, prostate specimens were uniformly processed and entirely submitted for histological investigation. After histological staining, all specimens were evaluated by one expert urological pathologist with 19 years of experience. The entire tumour volume was outlined on each step section (Figure 3.1(a)). Each individual tumour was graded according to the 2005 International Society of Urological Pathology Modified Gleason Grading System36and staged according to the 2002 TNM classification. See Hambrocket al.78 for a summary of the clinical and pathological tumour characteristics.
3.2.4 MR tumour annotation
Retrospectively, annotations of MR images (Figures 3.1(b)–(c)) were performed in con-sensus by one radiologist and one urologist. All annotations were performed using an in-house developed MR viewing and reporting system.135ADC maps were acquired in the same orientation and with similar thickness as the histopathology step sections. A pre-viously described translation technique was used to match the tumour-containing regions on prostatectomy specimens to ADC maps.78Using histopathology as reference standard, a region of interest was placed on the ADC map over the whole tumour-containing region (Figure 3.1(c)).
3.2.5 Focal volume segmentation
We used an automated method to determine the presence and size of a tumour focal spot (cluster of low ADC values within annotated tumour region). To summarise, it was first evaluated if the tumour was heterogeneous on ADC and thus contained a dark ADC tumour focus. Second, the focal spot was automatically detected and its volume determined.
Low ADC values within the tumour annotation were considered aggressive compo-nents for the purpose of this study as aggressiveness showed an inverse relationship with ADC values and MR guided MR biopsies are targeted to these low signal areas on ADC. Therefore, we defined the darkest connected tumour region within the annotation on the ADC map as the aggressive tumour focus.
The segmentation of the high-grade focus was done by means of a 3D region g