Effective and Efficient Methodologies for Social
Network Analysis
Long Pan
Dissertation submitted to the faculty of the Virginia Polytechnic Institute and State University in partial fulfillment of the requirements for the degree of
Doctor of Philosophy In
Computer Science and Applications
Eunice E. Santos, Chair Elisa D. Sotelino Yang Cao Ezra Brown Eugene Santos, Jr. Dec 11th, 2007
Blacksburg, Virginia, USA
Keywords: Social Network Analysis, Parallel/Distributed Computing, Anytime-Anywhere Methodology
Effective and Efficient Methodologies for Social
Network Analysis
Long Pan
ABSTRACT
Performing social network analysis (SNA) requires a set of powerful techniques to analyze structural information contained in interactions between social entities. Many SNA technologies and methodologies have been developed and have successfully provided significant insights for small-scale interactions. However, these techniques are not suitable for analyzing large social networks, which are very popular and important in various fields and have special structural properties that cannot be obtained from small networks or their analyses. There are a number of issues that need to be further studied in the design of current SNA techniques. A number of key issues can be embodied in three fundamental and critical challenges: long processing time, large computational resource requirements, and network dynamism.
In order to address these challenges, we discuss an anytime-anywhere methodology based on a parallel/distributed computational framework to effectively and efficiently analyze large and dynamic social networks. In our methodology, large social networks are decomposed into intra-related smaller parts. A coarse-level of network analysis is built based on comprehensively analyzing each part. The partial analysis results are incrementally refined over time. Also, during the analyses process, network dynamic changes are effectively and efficiently adapted based on the obtained results. In order to evaluate and validate our methodology, we implement our methodology for a set of SNA metrics which are significant for SNA applications and cover a wide range of difficulties. Through rigorous theoretical and experimental analyses, we
demonstrate that our anytime-anywhere methodology is an effective and efficient approach for large and dynamic social network analysis.
Acknowledgements
First, I would like to give my sincere thanks to my advisor Dr. Eunice E. Santos for her expert guidance and full support. Her inspiration makes this research work possible and her direction leads to the accomplishment of my thesis. Moreover, what she has done enriches my mind and sheds light on my future career.
Also, I am thankful to all my committee members, Dr. Ezra Brown, Dr. Elisa D Sotelino, Dr. Yang Cao, and Dr. Eugene Santos, Jr. They have awarded me with generous support and encouragement during my time at Virginia Tech. Their criticism and assistance are invaluable in my academic process.
Special thanks to Dustin Arendt, Morgan Pittkin, and Huadong Xia for their help and collaboration in various parts of this work. Their suggestions and critiques helped me to avoid a tortuous path in my research and their support helped the fast progress of my work.
Last but not least, I want to express my deep thanks to my family for everything that they have done for me. Especially, my parents and my wife have given me unconditional love and support. They are the most important people in my life. Thanks for giving me a happy family.
This work was supported in part by the Air Force Office of Scientifics Research, and by the Defense Threat Reduction Agency.
Table of Content
Table of Figures ... vii
Table of Tables ... ix
1. Introduction ...1
1.1 Social Network ...2
1.2 Social Network Analysis ...8
1.3 Current Social Network Analysis Software ...11
1.4 Summary ...13
2. Large Social Network Analysis ...14
2.1 Large Social Networks ...14
2.2 State-of-Art in Large Network Analysis...17
2.3 Challenges of Large Social Networks Analysis ...20
2.4 Summary ...23
3. Methodology Design ...24
3.1 Parallel/Distributed Framework ...24
3.2 Anytime-Anywhere Properties ...25
3.3 Our Methodology...27
3.4 Focuses of Our Methodology ...34
3.5 Summary ...35
4. Methodology Analyses and Validation ...36
4.1 Fundamental Definitions and Terminologies ...36
4.2 Centrality Measurements in SNA ...38
4.3 Maximal Cliques ...43
4.4 Algorithms for Measuring Closeness Centralities ...44
4.5 Algorithms for Measuring Ego-Betweenness Centralities...48
4.6 Algorithms for Maximal Clique Enumeration...52
4.7 Comparisons and Summarizations of Selected SNA Metrics ...56
4.8 Summary ...60
5. Domain Decomposition & Initial Approximation Phases Implementation...61
5.1 Domain Decomposition Phase Implementation...61
5.2 Initial Approximation Phase Implementation...66
5.3 Summary ...67
6. Recombination Phase Implementation ...68
6.1 General Anytime Recombination Algorithm’s Design ...68
6.2 General Anywhere Recombination Algorithm’s Design ...69
6.3 Ego-Betweenness Centrality Recombination Approach ...71
6.4 Closeness Centrality Recombination Algorithm I – The Anytime Approach ...74
6.5 Closeness Centrality Recombination Algorithm II – The Anywhere Approach...81
6.6 The Anytime Anywhere Recombination Approach for Closeness Centrality
...90
6.7 Maximal Clique Enumeration Recombination Algorithm I – The Anytime Approach...92
6.8 Maximal Clique Enumeration Recombination Algorithm II – The Anywhere Approach...93
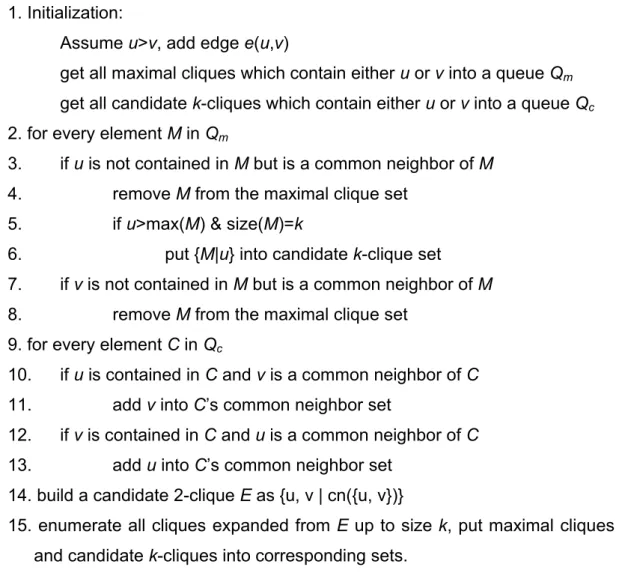
6.9 The Anytime Anywhere Recombination Approach for Maximal Clique Enumeration...100
6.10 Summary ...101
7. Experimental Results and Analysis...103
7.1 Experiments Setup ...103
7.2 Experiments on Ego-Betweenness Centrality Measurement ...104
7.3 Experiments on Closeness Centrality Measurement...111
7.4 Experiments on Maximal Clique Enumeration...125
7.5 Summary ...133
8. Conclusion & Future Work ...134
Table of Figures
Figure 1-1. A friendship network of a small class...4
Figure 1-2. Examples of different types of social networks ...8
Figure 2-1. World-Wide Web page network ...15
Figure 3-1. Our anytime-anywhere methodology’s architecture...29
Figure 4-1. An example social network. ...41
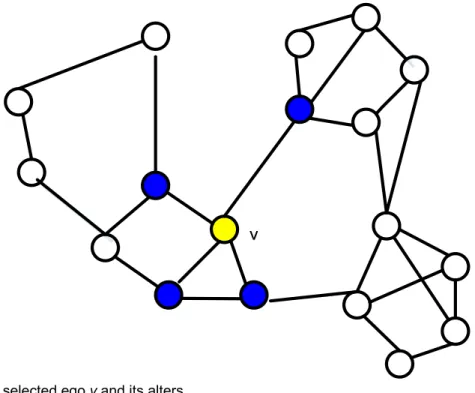
Figure 4-2. The selected ego v and its alters. ...42
Figure 4-3. The ego-network of node v. ...42
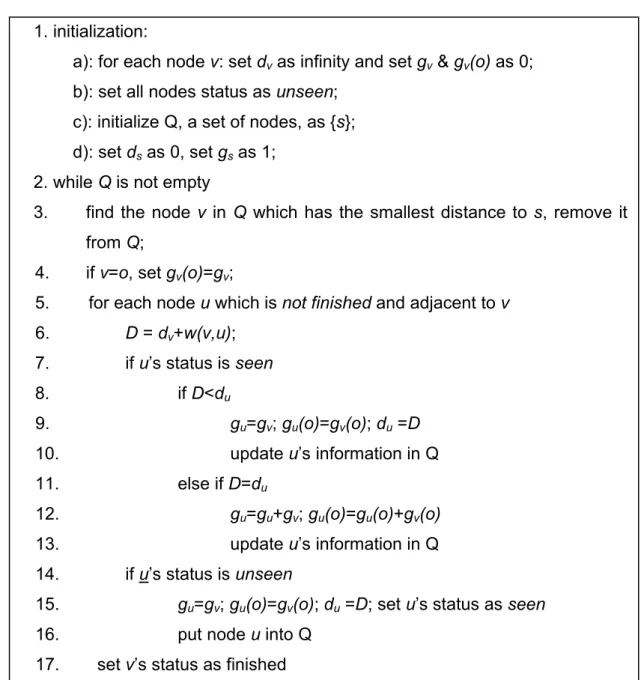
Figure 4-4. Pseudo-code of Dijkstra’s algorithm. ...45
Figure 4-5. Pseudo-code of Floyd’s algorithm. ...47
Figure 4-6. Pseudo-code of modified Dijkstra’s algorithm for ego-betweenness measurement...51
Figure 4-7. An example graph of maximal clique enumeration problem ...55
Figure 5-1. The architecture of the Domain Decomposition phase. ...62
Figure 5-2. The structure of graph domain decomposition approach...64
Figure 6-1. An example of the ego-betweenness dynamic change’s effect range ...72
Figure 6-2 Algorithm I: the anywhere recombination approach for ego-betweenness centrality measurement...73
Figure 6-3. An example of super-graph based on decomposition of original graph ...75
Figure 6-4. Algorithm II: the anytime recombination algorithm for closeness centrality measurement...77
Figure 6-5. The super-graph obtained based on partitioning of the example graph ...78
Figure 6-6. Edge pool for shortest paths at P1...79
Figure 6-7. Algorithm III: the anywhere recombination algorithm for closeness centrality measurement when edge weight is decreased...83
Figure 6-8. Algorithm IV: the fully dynamic anywhere recombination algorithm for closeness centrality measurement...85
Figure 6-9. Algorithm V: the anytime anywhere recombination algorithm for closeness centrality measurement...91
Figure 6-10. Algorithm VI: the anytime recombination algorithm for maximal clique enumeration...93
Figure 6-11. Example for finding maximal cliques with edge addition...95
Figure 6-12. Algorithm VII: the anywhere recombination algorithm for added edge for maximal clique enumeration. ...96
Figure 6-13. Algorithm VIII: the anywhere recombination algorithm for added edge for maximal clique enumeration. ...98
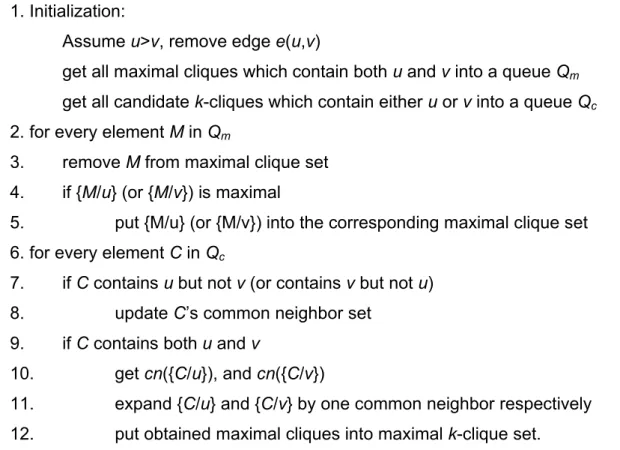
Figure 6-14. Algorithm IX: the fully dynamic anywhere algorithm for maximal clique enumeration...99
Figure 6-15. Algorithm X: the anytime anywhere recombination algorithm for maximal clique enumeration ...101 Figure 7-1. Ego-betweenness centrality measurement: serial vs. parallel. ...106 Figure 7-2. Time cost for adopting 64 random edge changes for
ego-betweenness centrality measurement...108 Figure 7-3. Performance comparison between handling random changes and handling max degree changes for ego-betweenness centrality measurement. 109 Figure 7-4. Relative cost for adopting 64 edge changes for ego-betweenness centrality measurement...111 Figure 7-5. Running time comparison of UCINet and our serial algorithm for closeness centrality measurement...112 Figure 7-6. Closeness centrality measurement: serial vs. parallel. ...114 Figure 7-7. The anytime property of our approach...115 Figure 7-8. The time cost of our system to incorporate an edge with decreased weight. ...117 Figure 7-9. Performance comparison between handling random increased edge weights and handling max degree increased edge weights for closeness
centrality measurement...118 Figure 7-10. The relative cost for adopting an increased edge weight for
closeness centrality measurement...120 Figure 7-11. The time cost of our system to incorporate an edge with decreased weight. ...122 Figure 7-12. Relative costs for adopting a decreased edge weight for closeness centrality measurement...123 Figure 7-13. The relative cost for adopting a decreased weight for closeness centrality measurement...125 Figure 7-14. Time costs for finding all maximal cliques contained in graphs. ...127 Figure 7-15. The anytime property of our approach for maximal clique
enumeration...129 Figure 7-16. The performance of our maximal clique enumeration anytime
approach for dense graphs. ...131 Figure 7-17. Time costs for adopting one random dynamic change for maximal clique enumeration...132 Figure 7-18. Relative cost for adopting one dynamic edge change for maximal clique enumeration...133
Table of Tables
Table 1-1. The social data about friendships between students in a small class. .4
Table 4-1. Summary of selected SNA metrics. ...60
Table 7-1. Maximal cliques contained in each graph ...126
Table 7-2. Maximal cliques contained in graphs with density as 10%...130
Table 7-3. Maximal cliques contained in graphs with density as 15%...130
1. Introduction
Understanding the nature of relationships and connections between entities is key towards understanding a variety of phenomena throughout multiple disciplines. The concepts of how a disease is spread, or how people are influenced by information are all examples of the need to understand and analyze interactions and relationships.
These concepts are the building block in the field of Social Network Analysis. Social Networks (SN) are graphs employed to represent the structure of interactions/relationships among people, or any types of entities. Social Network Analysis (SNA) has been studied by researchers for more than a century. As the broad application of electronic data, numerous large social networks emerge from various fields.
While there have been a multitude of results and analysis techniques that have been used in SNA, as we will discussed, current-day approaches are not able to effectively deal with social networks that are large-in-scale and dynamic. As such, this will be the primary focus of this dissertation. Large network analysis is a non-trivial task. It introduces new challenges due to long processing time, large computational resource requirement, and graph dynamism. In order to effectively and efficiently analyze large and dynamic social networks, new techniques and methodologies need to be developed. In this dissertation, we describe an anytime-anywhere methodology based on a parallel/distributed computational environment for large social network analysis. In our methodology, large social networks are decomposed into small parts and a coarsen-level analysis (partial results) of the network is generated based on analyzing each part. These partial results are incrementally refined over time. Also, during the analysis process, network dynamic changes will be effectively and efficiently adapted.
In what follows, we first provide a brief introduction of social network and social network analysis. Then, we will specifically discuss about popularity, importance, and special properties of large social networks. According to the challenges of large social network analysis, we present the design of our anytime-anywhere methodology. Next, we provide both theoretical and experimental evaluation and validation by implementing our methodology on a selected set of SNA metrics. Finally, we present our conclusion and discuss future work. Part of the work and figures presented in this dissertation have already been published in [SantosPAXP’06, SantosPAP’06]. Discussion and results can also be found in [SantosPA’07]
Before we discuss specific research and design issues for large and dynamic social networks, we will first provide important background information and introduction of fundamental concepts of social networks and social network analysis (SNA).
1.1 Social Network
In this section, we will present key definitions in the field of social networks, types of social networks, and ways in which social network data are gathered.
a) Background Definitions
Social networks have typically been defined as graphs representing social
relationships between people or organizations. Each node, also called an actor
or vertex, in a graph represents an individual person or a group of persons. An
edge connecting two nodes, also called a tie, represents relationship between
the objects represented by these two nodes. Using graphs to represent social data enables social analysts to completely and rigorously describe, manipulate, and analyze the structural information embedded in social relationships. Also,
graph-theoretic concepts grant researchers a mathematical and systematic framework that can extend researchers’ methodologies to other fields. In a general point of view, social networks can be used to represent, identify, and measure any type of correlations between any kind of entities, such as words, web pages, people, organizations, animals, cells, computers, and other information or knowledge processing entities [Krebs’06]. Thus, Social Networks have broad and successful applications in sociology, epidemiology, biology, criminology, and economics [Kadushin’05].
b) Examples of Social Networks
Throughout physics, biology, social sciences and engineering, an abundant number of systems take the form and structure of networks. In order to facilitate a clear understanding of social networks, we present one example below. This example is just a simple graph which is used to help readers to understand basic concepts in social networks. This graph is a network of friendships between students in a small class.
First assume that we have already obtained data about friendships among students which are shown in Table 1-1. Details about ways for gathering such social data will be discussed in a later section. In this table, the diagonal elements are all blanks. This is due to the fact that in friendship analysis, we do not need to consider if a person is a friend of himself/herself. The other elements in the table are binary. This means that data in the table only represents that two people are either friends or not. Based on the data contained in Table 1-1, we can build the network of friendships between students in the small class. The network is shown in Figure 1-1.
Table 1-1. The social data about friendships between students in a small class.
John Susan Tom Jack Alice Jeff Mike Tiger Jane
John -- 0 1 1 0 0 0 0 0 Susan 0 -- 0 0 0 0 0 0 0 Tom 1 1 -- 1 0 0 0 0 0 Jack 1 0 1 -- 0 1 1 1 0 Alice 0 0 0 0 -- 1 0 0 0 Jeff 0 0 0 1 1 -- 1 1 0 Mike 0 0 0 1 0 1 -- 1 0 Tiger 0 0 0 1 0 1 1 -- 0 Jane 0 0 0 0 0 0 0 0 --
In this network, each node represents a student in the class. Two nodes are connected with an edge if they are friends. In this example, two students are friends if the value of the corresponding element in the table 1-1 is 1. If the value is 0, these two nodes are not friends and not directly connected.
c) Social Network Data Gathering
In the previous section, we presented several examples of social networks of different kinds of entities and interactions. We also provided a simple example to show how to build social networks based on the obtained social data. However, before building social networks, there is a very important problem researchers have to face: how to acquire elementary data elements for building social networks? In order to give a complete and accurate description of interactions between individuals, researchers have done a lot of work on social data gathering techniques focusing on how to identify the population, how to measure relationships, etc. Since this is not our research focus, rather than going into specific details about this topic, we will instead provide a brief overview of popular social network data collection methods in the following part of this section. For interested readers who want further details on this topic, please refer to the second chapter of the textbook [CarringtonSW’05], or the first chapter of the online textbook [HannemanR’05].
Currently, there are mainly two kinds of approaches for social network data gathering: elicitation and registration [NooyMB’05]. Elicitation acquires interaction information via the questionnaire/survey. Registration acquires interactions through extracting from registered information, such as membership lists, email records, author records of scientific articles, etc.
In the early SNA research, questionnaire/survey was the method primarily used. In this method, questions about interactions are proposed and respondents are required to report their answers. Data gathered by this kind of method may be quite inaccurate and subjective [AlberB’02, CarringtonSW’05, Newman’03a, NooyMB’05]. It is hard to obtain complete set of data by survey/questionnaire. Also, the gathered data are affected by subjective biases of respondents. For example, people will have different definitions of friendships and different perceptions on friendship strength. A social network of people’s friendship built based on data gathered by this type of method will seriously skewed due to
different definitions/perceptions of friendship. A comprehensive review of this topic can be found in [Marsden’90]. Moreover, survey/questionnaire method has high-labor cost. It will take social scientists and network researchers a myriad of efforts to gather data for a network of even middle size (several thousands of nodes). This intensive labor cost considerably limits the size of networks to be studied.
Through fast developments of computer technologies and universal applications of computers, automated data acquisition are found in most, if not all, fields. Interactions between objects can be stored as or implicated by electronic data. For example, co-authorship of research articles can represent the collaboration between research scientists. If two authors appear on the same paper, there will be a collaboration connection between them. Through rapid growth of network size and data-sharing techniques, huge databases of social interactions have emerged in various fields. For instance, there are many large databases that maintain records of article authors in publications of miscellaneous research fields [BarabasiJNRSV’02, Newman’01]. MEDLINE for example, the database that covers published papers on biomedical research, has about 2 million records from 1995 to 1999 [Newman’01]. Electrical registered information can provide even larger amount of data. Using electronic data, we can have more objective definitions of interactions. For example, the cooperation between scientists can be measures as the number of publications they published together. However, for some cases, how to interpret the physical meaning of the interaction data gathered by this mechanism and how to mapping them to system behavior needs more consideration.
d) Types of Social Networks
According to broad applications of SNA, there are many types of social networks. Social networks can be classified based on the combination of attributes and measurements of nodes and ties. In social networks, there could be different kinds of nodes or the same kind of nodes with various weights. For instance,
affiliation networks [WassermanF’94] contain two kinds of nodes: events (such as corporations/organizations) and actors. Ties between events and actors usually represent relationships of membership/participation [CarringtonSW’05]. Nodes in a social network can have various weights that can indicate, for example, their importance.
Similarly, a social network could contain multiple types of ties or the same type of ties with different weights. A network with multiple relations are called multi-relational network. A multi-relational network, for example, may contain relationships as friendship, collaboration, and co-membership. These relationships could have different importance or strength which is represented as the edge weight in a graph. Taking a friendship network as an example, people may use a number from 0 to 5 to indicate the strength of friendships between them. Also, relationships between objects may be non-symmetric. Still discussing friendship networks, person A taking person B as a friend does not necessary requires that B takes A as a friend too. Thus, ties may have directions. Symmetric ties can also be taken as directed ties on both directions.
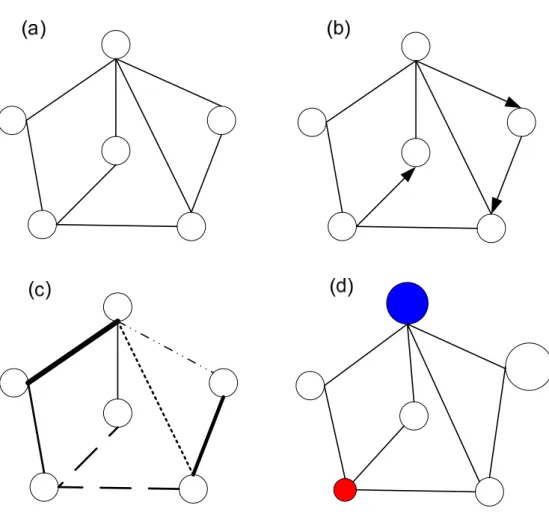
We summarize the types of social networks in Figure 1-2. A real social network can be a combinatory of network types shown in this figure. The examples provided are simple and fundamental social networks. Clearly, there are various types of social networks. A comprehensive review can be found in [CarringtonSW’05, NooyMB’05, WassermanF’94]. In our research, we mainly focus on the most popular and fundamental type of social networks: graphs which have only one type of actors with the same weight and only one type of ties but with various weights. Without specific declaration, networks analyzed in this document are this type of graphs.
Figure 1-2. Examples of different types of social networks: (a) a social network with single type of nodes and undirected ties, (b) a social network with directed and undirected ties, (c) a social network with various types and weights of ties, (d) a social network whose nodes have different types and weights
1.2 Social Network Analysis
In previous sections, we have introduced definitions and types of social networks. Also, we discussed different ways to gather social data and build networks. However, knowing how to build networks does not imply understanding the contents contained in networks. How to “dig up” embedded structural information from social networks falls into the field of Social Network Analysis.
a) What Are Analyzed in Social Network Analysis?
Researchers define SNA as (a) “the mapping and measuring of relationships and flows between people” [Krebs’06], (b) the techniques “focusing on uncovered patterns of people’s interaction” [Freeman’02], (c) a set of methods for the investigation of relational aspects of social structures [Scott’92]. Essentially, these definitions are equivalent. They all emphasize that social network analysis is focused on the study of structural information contained interactions between entities.
The study of SNA is primarily focused on interactions between entities instead of entities themselves. In other words, measurements and analysis of social networks are mainly based on ties/edges between actors/nodes other than just attributes of actors. This does not indicate that attributes of actors are useless. In many cases, actors’ attributes will help researchers to verify hypothesis of social behaviors and analyze specific social phenomena. For example, in a friendship social network of students in colleges, researchers may find a universal social phenomenon and draw the conclusion that ethnicity has considerable effects on friendships between people.
However, the study of SNA is mainly from aspects of structural properties and patterns of entities’ interactions. Patterns of people’s interactions are important features of lives of individuals who display them [Freeman’02]. Most SNA researchers, if not all, have the same assumption that structure implicates and affects functions. What SNA measures/analyzes are structural properties of individuals or groups of individuals in a network. These measurements includes how individuals are connected with others, how individuals will affect connections between others, how groups of individuals are connected in a network. Also, from a global point of view, SNA researchers are usually interested in such questions as Is the whole network connected?; Is the network densely connected?; Can the network be decomposed into blocks based on the individuals connections?; etc.
b) Social Network Analysis Broad Applications
As we discussed, social network analysis techniques can be applied to study structures of any types of interactions/relationships between any kinds of entities. From late 1970s, SNA techniques have gained massive attentions, considerable developments, and successful applications in broad fields [CarringtonSW’05]. For example, SNA techniques are used in organization management. In current companies and government agents, there is more and more cooperation and information sharing between workers. Using SNA tools on collaboration and/or information-sharing networks, managers can easily find the “important to go people”, and build appropriate management strategies to improve efficiency. Combating terrorism is another field where SNA techniques have important and successful applications. Terrorist organizations have special structures on recruitment, evolution, and radical ideas diffusion [Ressler’06]. SNA tools can be used to identify these unique organization structures and provide critical information for terrorist detection and terrorism prediction.
Social Network Analysis techniques also have been successfully applied in epidemiology. A lot of researchers try to analyze the spread of diseases based on the interactions between people.
A SNA researcher, Valdis Krebs, listed a number of recent successful applications of SNA in [Krebs’06]. A selected set of applications are listed below:
• “Examine a network of farm animals to analyze how disease spreads from one cow to another
• Discover emergent communities of interest amongst faculty at various universities
• Reveal cross-border knowledge flows based on research publications
• Determine influential journalists and analysts in the IT industry
• Map executive's personal network based on email flows
• Discover the network of Innovators in a regional economy”
1.3 Current Social Network Analysis Software
Modern social network analysis has been studied for more than seventy years and many researchers and commercial companies have put huge amounts of efforts on developing computer software tools for social network analysis. Currently, numerous commercial/free SNA software tools are available. These tools can perform comprehensive analysis on small social networks and provide significant insights for fine-grain interactions or small domain spaces.
a) Popular Social Network Analysis tools
Currently, there are many comprehensive tools developed for SNA, such as UCINET [BorgattiEF’02], Pajek [BatageljM’04], Agna [Benta’04], NetDraw [Borgatti’02], NetMiner [Cyram’04], MultiNet [RichardsS’03], StOCNET [BoerNHSSZ’04], etc. A brief review of these software tools can be found in [CarringtonSW’05].
From functionality, SNA software tools can be primarily classified into two types. One type, including NetDraw, NetMiner, and Pajek, focuses on the visualization of networks. Developers of these tools believe that human eyes are powerful network analytic tools. Visualizing networks will help analysts easily understand structure information contained in them. The other type of tools is based on text reports of SNA measurements and analysis. UCINET, Agna, and MultiNet all belong to this type. These two types of tools are usually employed jointly to facilitate a more comprehensive analysis of social networks.
There is a special type of tools, such as StOCNET, which provides statistical analysis of networks. This type of tools is built based on statistical models of
social networks and can provide a global-scale analysis of networks based on a set of statistics, such as degree variance, index of heterogeneity, dyad and triad census, etc [CarringtonSW’05].
b) Issues in Current Social Network Analysis Software
Although various types of SNA software tools have gained a lot of success in extensive research fields, their development is still maturing. There are still considerable problems in these tools. One of the most critical problems is that current SNA software tools lack scalability and cannot be used to analyze large-scale and dynamic interactions.
Currently, most SNA software tools are designed for analyzing small social networks. This is due to the history of social network applications. Modern social network analysis theory originated in the 1930’s [BarabasiJNRSV’02]. As we mentioned, at that time, survey/questionnaire was the primary method used. This labor-intensive method substantially limited the size of networks obtained. The social networks analyzed at that time were usually in sizes of tens, at most several hundreds, of nodes. SNA software packages are primarily designed according to requirements of these classical small networks. Most approaches used in current SNA tools are built based on serial algorithms. Moreover, usability of software tools for visual exploration/analysis of social networks will seriously degrade, even become useless, as the size of networks increases. When a network is large and complex, using human eyes to identify/extract structural information is not only quite burdensome but also near-impossible to achieve a complete and accurate analysis. What is even worse is that a lot of elementary SNA measurements cannot be obtained in current SNA tools due to the large size of networks. For example, few of current SNA tools can measure
centrality (defined in later chapters), one of the most used SNA metrics, when a network is large. As we show in [SantosPAXP’06, SantosPAP’06, SantosPA’07], using a computer with 512MB of memory, the maximum size of a network for UCINET to load and perform closeness centrality measurement is about 15,000
actors. For Pajek, the maximum allowable network size is about 5,000 actors. However, there are many social networks with size larger than 15,000. For example, a large citation network presented in [Redner’98] has 783,339 nodes. Moreover, current SNA software and algorithms are “all-or-none” approaches. That is, there is no means to stop algorithms in midway to obtain a meaningful partial result. In fact, it is not simply the means to stop but the fact that these approaches typically would provide non-meaningful results except for the final results. For time-critical applications, providing a coarse-level useful analysis of the network within a short time may be quite helpful for analysts.
Furthermore, current SNA tools cannot adapt dynamic behaviors of large networks. To the best of our knowledge, no current SNA software tools have the ability to incorporate dynamic changes in networks into on-going processing of network analysis. If a network whose connection structure has been changed during processing, the only way to get a meaningful analysis of the current network is to stop, re-load, and re-analyze it from scratch. For small networks, this approach seems to be feasible since it only takes a short time for re-analyzing. However, this kind of approach will have significant costs in large networks analysis. We will discuss details of this problem in Chapter 2.
1.4 Summary
In this chapter, we discussed general definitions and broad applications of social networks and social network analysis. We also introduced available SNA software tools. Currently, SNA computer tools have the ability to provide significant insights for studying small-scale interactions between objects. However, they have critical issues for analyzing large and dynamic social networks.
2. Large Social Network Analysis
Social network analysis has been applied in a broad range of research fields. Due to the wide usage of computerized data acquisition and rapid developments of networked information-sharing techniques, numerous types of large social networks have emerged in a wide range of research fields. These large networks play critical roles in studying structural properties, understanding social phenomena, and predicting system behaviors from the point of view of large-scale interactions. However, analyzing large and complex social networks introduces specific crucial and fundamental problems which have not been considered nor addressed in current SNA tools.
2.1 Large Social Networks
There are many large social networks that have emerged from various fields. These include networks of acquaintance/communication [Compbell’04, NowellNKRT’05, LiveJournal, MySpace, FaceBook], phone calls [AielloCL’00], collaboration [Newman’01, BarabasiJNRSV’02], sexual contact [LiljerosEASA’01], paper citation [Redner’98], metabolic networks [GuimeraA’05], World-Wide Web (WWW) pages networks [Adamic’99, BroderKMRRSTW’02], the Internet networks [GovindanT’00], food webs [WinemillerL’03], linguistic networks [CanchoS’01], etc. In following paragraphs, we will briefly introduce several popular large networks obtained based on real-world databases.
a) Networks of Acquaintance/Communication
Currently, there are various social utilities on the Internet, such as LiveJournal (LJ) (www.livejournal.com), MySpace (www.myspace.com), FaceBook (www.facebook.com) etc. These tools provide a platform for social
communication and a mechanism for people to connect with their friends and build their communities. Social networks, which are built on registered data of these social utilities, can help social analysts to study large-scale interactions between people in the aspect of acquaintance/friendship. Usually, the size of these social networks can be very large and the data are inherently changing and evolving. For example, by Oct 9th, 2006, LJ has a total of 11,322,901 users out of whom 1,889,233 users are active. There are approximately 50,000 updates within every 24 hours.
b) Networks of World-Wide Web Pages
Researchers recently began to build and study large networks of World-Wide Web pages [Adamic’99, BroderKMRRSTW’02] in order to a) understand the sociology of content creation of the Web, b) analyze the behavior of and provide valuable insights into Web algorithms for gathering, searching and discovering information, c) and predict the evolution of Web structures. For example, a Web page network studied in [BroderKMRRSTW’02] has over 200 millions pages and 1.5 billion links. In this network, nodes are web pages (documents). Edges are hyperlinks (URL’s) pointing from one document to another [AlberB’02]. A simple example network of World-Wide Web pages is shown in Figure 2-1.
Home Page
c) Collaboration Networks: Co-Authorship Networks and Movie Actor Networks
Studying human collaboration is always an important topic in sociology. Currently, there are two popular types of networks employed by researchers to analyze large-scale interactions between people based on their collaborations. They are movie actor collaboration networks and science co-authorship collaboration networks.
Most movie actor networks are built based on the Internet Movie Database (www.imdb.com) which contains all movies and their casts since the 1890s. In these networks, nodes represent actors and ties between nodes represent that the connected actors acted in the same movie at least once. Obviously, this network is dynamic since new movies and actors keep joining the database. For example, in 1998, the movie actor network contained 225,226 nodes [WattsS’98]. In 2000, the size of network increased to 449,913 [Newman’00].
Studying the co-authorship of scientific papers is an effective way to investigate the collaboration between scientists. In co-authorship networks, nodes are authors and two nodes are connected by an edge if the corresponding two authors write at least one paper together. Two examples of large co-authorship networks can be found in [Newman’01, Barabasi01]. The size (number of nodes) of the co-authorship network based on the database MEDLINE (biomedical research) is 1,520,251 [Newman’01]. The size of co-authorship network for neuron-science is 209,293 [Barabasi01].
d) Citation Networks
Usually, citation networks are based on databases of scientific publications. These networks are employed to study scholar communication, as well as popularity and evolution of technologies. In this network, nodes are scientific papers. One node will be connected with another by a directed edge if its corresponding paper cites the paper represented by the other node. An example
of large citation network can be found in [Redner’98]. In this example, the network has the size of 783,339.
e) Linguistic Networks
Linguistic networks are special networks employed to study language organization and generation based on word interactions. These networks are built based on words co-occurrences. In a linguistic network, nodes are words. Two words are connected by an edge if they appear next to or one word apart from each other. Details of linguistic networks can be found in [CanchoS’01]. The size of the word network presented in [CanchoS’01] is 460,902.
Currently, there are numerous other large networks being studied in various research fields. Due to the space limitation, we cannot introduce all of them. For interested readers who want further details of this topic, please refer to comprehensive reviews of large and complex networks in [AlberB’02, Newman’03a].
2.2 State-of-Art in Large Network Analysis
Large and complex social networks have already attracted considerable attentions from SNA researchers. There are many papers discussing special structural properties obtained from large networks. Most of these researches are done in a statistical fashion. A good review of this topic can be found in [AlberB’02, Newman’03a]. Here, we will only briefly discuss the contributions that have been made and the potential pitfalls in their approaches.
a) Special Structural Properties of Large Social Networks
To the best of our knowledge, most, if not all, current researches on large and complex networks are dealing with using some form of statistical parameters to describe and analyze structural characteristics of large networks. Based on their
results, researchers found that the graph model which can be used to generate real-world’s large networks is quite different from the classical random-graph model, the Erdös-Renyi model [Erdös59], which is proposed in 1959 and used to analyze small networks. Recently, various theories and graph models have been proposed for large and complex social networks [AlberB’02, Newman’03a]. All these models and theories are mainly built based on three observed special structural properties of large networks. These properties are listed below.
• Small-world effect [Milgram’67, Adamic’99, WattsS’98]: most pairs of
nodes are connected by short paths through networks. In other words, the distance between any pair of actors is much smaller than the graph size. Usually, the average value of shortest paths is increased as a logarithm of network size.
• Degree scale-free distribution [Price’65, DorogovtsevM’01, Strogatz’01]:
node degree is defined as the number of edges that connect this node with others. The distribution of node degree in a network follows the power-law. More precisely,
α − ∝k pk
where pk is the probability that a node has a degree as k, and α is a constant and usually α is a value between 1.6 and 3.0 [Newman’03a]. This means that in a large network, we have a great amount of nodes with small degrees and a small tail of nodes with large degrees.
• High clustering coefficient [AlberB’02, FronczakHJS’02, Newman’03a]: in
[Newman’03a] the cluster coefficient is defined as:
vertices of triples connected of number network the in triangles of number C= 3×
This property is also called as high transitivity. Real-world large networks have much higher transitivity than networks generated by the random graph model presented in [ErdosR’59].
These three properties are detected by statistical analysis from a great amount of real-world’s large social networks. It seems that they are common properties for
real-world large social networks. These properties have shown differences between large-scale interactions and small-scale interactions, and highlighted the necessity and importance of large social network analysis.
b) Pitfalls in Current Large Network Analysis Approaches
Although the achievements of current SNA research on large social networks are exciting, they are far from satisfactory. First, all results/theories presented in the previous subsection are only based on a few basic and simple structural measurements of large social networks, such as node degree, network density, connectivity, and diameter, etc. Many complicated but more crucial structural explorations including centrality measurements, cohesive subgroup detection, roles and positions detection, and blockmodeling, which are frequently used in classical SNA on small-scale interactions, have not been studied yet. This is not because such investigations are not important. Rather, the reality is that current SNA software tools have poor ability to handle large networks.
Second, most of these analyses of large networks are done in the aspect of statistics, which means that networks are explored from the global-scale. Usually, researchers use some statistics, such as clustering coefficient, degree distribution, to represent the structure of the whole network. Besides the problem for choosing appropriate statistics for large networks, details of individuals inside a network are omitted. However, local-scale analysis is indispensable in social network analysis. No matter how large the network size is, detecting and analyzing actors or groups of actors with different structural characteristics is always one of the essential tasks for SNA.
Lastly, the common method used to achieve statistics of these large networks is sampling. Based on some strategies, SNA researchers sample a large network, and statistics of the whole network is generated from the analysis of these samples. New questions are introduced by this kind of approaches such as How to sample the network to get the best analysis results?; How many samples are
enough to obtain reliable results?; And how accurate is the analysis obtained by these samples? In order to answer all these questions, quantitative tools for social network analysis is required.
2.3 Challenges of Large Social Networks Analysis
Analyzing large social networks is not a trivial task. Large social network analysis introduces a multitude of new research issues. Before discussing its challenges, let us first explain why we should bother with analyzing large social networks.
a) Why Should We Analyze Large Social Networks?
First of all, large social networks have their own special structural properties. These properties cannot be obtained by simply scaling up small networks. It has been shown that large social networks have graph models which differ from those of small networks [AielloCL’00, AlberB’02, Newman’03a]. The structural properties of large networks and corresponding decisions-making strategies based on large social network analyses cannot be directly borrowed from what we achieved from the analysis of small networks.
While some researchers may argue that their interests are only focused on a small number of nodes and ties so that large social network analysis seems unimportant to them. In some cases, researchers can use some priori-knowledge of the problem to designate the nodes/ties they want to analyze. However, in many cases, researchers usually have no clear idea about which nodes/ties are relevant to their study. Moreover, most, if not all, small social networks are contained in and/or extracted from large-scale interactions. Individuals or groups of individuals are nested in large networks and relevant/useful objects are always coupled within their contexts. Without elaborative analysis of every element in networks, it is near-impossible to achieve an accurate and complete data set for small-scale analysis.
As we discussed in chapter 1, SNA tools can successfully handle small networks. However, they are not suitable for analyzing large-scale interactions. This is because that due to historical reasons, these tools are originally designed for analyzing small networks. Comparing with small social networks, large and complex social networks introduce new challenges, which are not addressed in current SNA tools. After carefully studying problems of large and complex social network analysis, we found that there are mainly three fundamental challenges needed to be addressed if an approach wants to effectively and efficiently analyze large social networks. These challenges are: long processing time, large computational resource requirement, and graph’s dynamism. In the following paragraphs, we will briefly discuss these challenges.
b) Long Processing Time
An obvious characteristic of large networks introduced in chapter 2.1 is the huge network size (number of nodes contained in a network). Sizes of most of these large networks are easily at least several tens of thousands. The size of the friendship/acquaintance network based on the LiveJournal database is even more than 10 million. Moreover, these networks keep expanding. Through rapid developments and broad applications of electronic monitoring techniques, more and more large social networks will arise and current social networks will become larger and larger. As network size increases, the time for analyzing networks grows rapidly. Usually this growth is not linear. The growth of work load for comprehensively analyzing a large network can easily go to the second or third order of graph size. Consider the problem of measuring how far away each actor is from each other (all-pairs shortest distances). The computational work increases approximately at the speed of n3 where n is network size. Although computer power has been grown fast, handling large networks will take a great amount of time even if we use the fastest single processor available. However, in many applications, time is vital. For some time-critical applications such as criminal/terrorist detection and disease spread mitigation, it may be too late to
prevent disasters from happening by the time analysis results are returned from SNA tools.
c) Large Computational Resource Requirement
Processing large social networks will require a great amount of computational resources, such as memories in computers. Every social network analysis package runs on a single computer making it bottlenecked both by processor
speed and memory size. A 32 bit processor cannot address more than 232 bytes
of memory limiting the total system memory to approximately 4GB. Computing the shortest paths for all pairs of actors requires n2 memory where n is the number of actors. If we allow 4 bytes per actor then the maximum number of actors allowable in an all in memory serial SNA is 2 4 16,000
32 ≈
actors. Thus, we can see that it is infeasible to employ a single processor to perform analysis on large social networks.
d) Graph Dynamism
Almost all networks are dynamic. Communities in friendship/acquaintance networks keep evolving as people join new groups or quit old ones. There are always new papers or collaborative work inserted in citation or co-authorship networks. Physical connecting backbones of the Internet keep changing as new routers are added and current ones fail. At any minute, there are new web-pages/information put onto the Internet and outdated ones vanished. In fact, almost all networks keep changing at various rates. The dynamism does not seem to be quite troublesome for analyzing small networks. This is because that when a network is small, it usually only takes a very short period of time for analyzing it. During the analyses process, dynamic changes may have little chance to happen. Also, if the some dynamic change happens, users can take this changed network as a new input and generate a new set of results within very short time. However, dynamism is vital for large network analysis process. As we discussed, analyzing large networks will take a very long time. In some cases, the whole network’s structure may have already changed by the time
analysis results are returned from SNA tools. Thus, what we obtained from SNA tools may not be valid anymore. In some cases, after dynamic changes, the structure is altered only in a small part (or parts) of the large network. However, current tools cannot provide the information about which part of results and how they are affected by the dynamic change. In order to obtain a useful analysis of the network, current software tools have to take the changed network as a new input and perform the analysis from scratch. Clearly, this will introduce a formidable overhead especially when the graph size is large. In order to achieve effective and efficient analysis of dynamic large networks, how to effectively adapt the dynamic behavior of networks must be considered in methodology design.
2.4 Summary
Recently, numerous large and complex networks have emerged and been studied in various research fields. Significant insights of large-scale interactions are obtained only by primitively analyzing them on simple SNA metrics. We have confidence to believe that, under large social networks, there is much more important information waiting to be investigated. Analyzing large and complex networks is an important and promising task. However, the poor ability of current SNA software tools prevents further successes of current large social network analysis. In order to achieve a comprehensive and profound understanding of large-scale interactions, it is vital to develop key researches and design appropriate methodologies for analyzing large social networks.
3. Methodology Design
The special structure information (introduced in chapter 2) contained in large-scale interactions and the poor ability of current SNA software tools on handling large networks spotlight the need for reconsidering SNA methodology design. New techniques need to be specially developed for analyzing large social network. In order to design an effective and efficient methodology for analyzing large social networks, we should consider and combine approaches from following different fields:
• graph theory
• optimization
• parallel/distributed computation
• algorithm design
• networking/communication
In this chapter, we will first introduce fundamental and significant concerns for designing methodologies for large social network analysis. Then, according to these concerns, we will propose our methodology, an anytime-anywhere methodology based on a parallel/distributed computational framework. Following this, detailed discussions about the architecture of our methodology and design and function of each component in our methodology are presented.
3.1 Parallel/Distributed Framework
Serial algorithms are not suitable for analyzing large networks. Long processing time and large computational resource consumption are apparently two of main challenges which must be addressed if we want to effectively analyze large social networks. Some large social networks, such as friendship/acquaintance
networks based on the LiveJournal database (www.livejournal.com), even cannot be loaded into the memory of a single machine. Many basic SNA metrics, such
as all-pair shortest paths, require O(n2) (or higher order) storage space and
processing time. Also, some complicated but useful analyses processes, such as the maximum clique detection, node role assignment, and checking automorphic equivalence [BrandesE’05], are NP-hard or NP-Complete. Obviously, due to the lack of scalability, serial algorithms are typically ineffective towards handling large social networks.
An alternative to serial approaches is parallel/distributed processing. We find that using multiple processors for large social network analysis is an important endeavor. This is because, for one, employing connected computers/processing-units to analyze large social networks will relieve the limit on computational resources. Moreover, parallel/distributed computation can accelerate the analysis process. Thus, we believe that utilizing a parallel/distributed computational framework is a more effective means to provide large social network analysis.
3.2 Anytime-Anywhere Properties
Even using multiple processors, building comprehensive analysis for large social networks inevitably requires large periods of time. “All-or-none” mechanisms will become infeasible for large social network analysis. Here, the term “all-or-none” represents the idea that an algorithm cannot be stopped in the midway to provide useful partial results. Users are either waiting for the complete solution or receiving the complete/final solution for the whole network. By and large, current SNA tools work in this way. “All-or-none” approaches seem to be fine when network size is small. This is due to the reason that the processing time for a small network is very short. However, these approaches have vital pitfalls when dealing with large social networks, especially for time-critical cases. For example, assume that a group of epidemiologists are studying a communication/interaction network of people in a big city, such as Beijing China, to prevent the spreading of
a serious infectious disease, such as SARS. This network may contain tens of millions nodes. Even if we have the ability to handle this large network, analyzing this large graph (predicting the spread of the disease, detecting important persons for effectively and efficiently blocking the spreading of the disease, and helping analysts to making proper decisions) will take a huge amount of time which can be several months. After such a long time, due to the late response, the spread of the disease may be so broad that it cannot be controlled. Furthermore, the network is not static. Individuals may be infected or recovered during this long time. The analyses returned will be too “old” to represent the current status of the disease spread in the city and cannot help relevant health agencies to take proper reactions.
In order to effectively solve these problems, methodologies for large social network analysis should have at least two properties. First, they should be able to be interrupted midway in order to provide useful partial or coarse-level results for quick response. Also, the quality of these partial results can be refined and finally the exact (or a good approximate) analysis results of the whole network can be obtained. Second, they should have the ability to easily incorporate new information in networks during their analysis process.
These two properties are not new to the field of algorithm design and analysis. In fact, these concepts have been studied and have been given the terms anytime
and anywhere properties [SantosSW’99]. Anytime-property was proposed to
balance execution time with solution quality [DeanB’88]. Four characteristics of anytime-algorithms differentiate them from traditional algorithms: quality measurement, predictability, interruptability, and monotonicity. Quality measurement means that partial results’ quality can be estimated. Predictability is used to refer the ability that the time cost for obtain partial results at some stage can be estimated or bounded. Interruptability represents that programs can be interrupted and present obtained partial results to users. Monotonicity is used to constrain the quality of partial results. It requires the partial results quality can
be only non-decreasing. By having an anytime-property, algorithms can provide users partial solutions with the good quality that can be achieved within the given time. As time evolves, the partial solutions will be refined step by step.
Anywhere-property originally was used to refer to the idea of information
sharing for problem-solving [SantosSW’99, Santos’01]. It represents that algorithms have the ability to accept complete or partial solutions generated elsewhere and incorporate external solutions into its own processing. It is necessary for a parallel/distributed framework of large social network analysis. As we mentioned, when a social network is large, due to the limit of computational resources, it is typically infeasible for a single processor to handle the whole network. In parallel/distributed computational environments, it is necessary for each processor to handle only a part of the graph. For some SNA metrics, in order to achieve complete analysis results on each processor, the program may need partial/complete results obtained on other processors. In this dissertation, the term “anywhere” is employed to emphasize another idea. That is no matter where and when changes happen, they should be first incorporated in the analysis locally and the new information/solution will be propagated through
the whole network as time evolves. In other words, an anywhere property refers
to the ability of algorithms to adapt the new information in the network during the algorithm processing.
3.3 Our Methodology
Based on the important issues discussed in the previous sections, it is clear that there must be a focus on designing an anytime-anywhere methodology on a parallel/distributed computational framework for large social network analysis. Using a parallel/distributed framework will to enlarge computational resources and accelerate processing process. When the problem to be solved requires large computational work, usually we can decompose it into smaller sub-problems and use a set of processors to solve it in the way that each processor
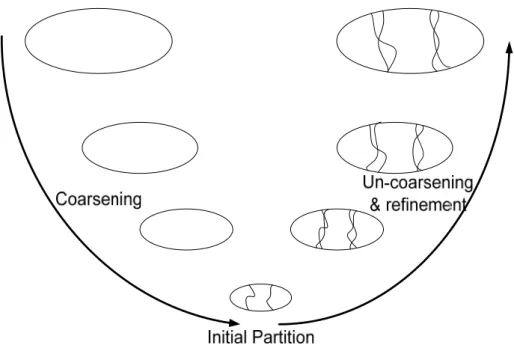
only handles a single sub-problem. Although based on local sub-problems each processor can only obtain partial solutions, these partial results will provide significant insights for the original problem if it is carefully decomposed. Thus, these results can be used as an initial approximation of the solution for the original large problem. In order to obtain the exact or an accurate enough solution, the partial results need to be refined. For complex problems, this refinement usually takes a long period of time. In order to provide users with various levels analyses (from coarse to fine), the refinement is incrementally achieved stage by stage. By each stage, the obtained partial results can be presented to the user with an estimated quality. Also, during the processing, problem’s dynamic information needs to be adapted. When problem’s inputs change, we do not recalculate solutions from scratch. In order to effectively and efficiently handle problem’s dynamism, the dynamic change adoption is accomplished by refining affected results based on the obtained partial solution. Thus, in our methodology, we will decompose a large social network into small parts, build a coarse-level of network analysis based on the analysis of separated parts of the network, and incrementally refine these partial results stage by stage. A graph’s dynamic changes will be adopted during the analysis process based on the obtained partial results.
a) Methodology Architecture
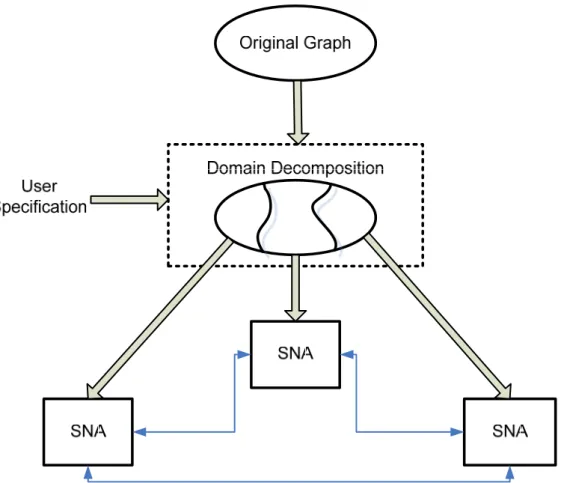
According to working processes, our methodology mainly consists of three phases, Domain Decomposition (DD) phase, Initial Approximation (IA) phase, and Recombination (RC) phase. The architecture of our methodology is shown in Figure 3-1.
Figure 3-1.Our anytime-anywhere methodology’s architecture.
Our methodology works as follows. The DD phase is the first phase used in handling large networks. The DD phase takes the charge of breaking a large graph into small-ones. According to general criterion and specific requirements posed by users and SNA applications, the original large network will be cut into several parts in the DD phase within a relative small amount of time. After graph partitioning, sub-graphs are distributed to a set of SNA agents which can be one or a group of processors. At each agent, current SNA technologies or specially designed approaches are applied and the analyses of the sub-graphs are generated. We take these analyses as an initial approximation of the original network. Thus, this phase is called Initial Approximation phase. The function of RC phase is to incrementally build the exact (or a good approximate) solution of the whole network. In this phase, each agent may iteratively communicates with each other, refine local solutions with the results obtained on its own or at other
agents, incorporates graph’s dynamic information during processing. The anytime-anywhere property of our methodology is mainly embodied in functions of this phase.
One of our main goals is to build a framework for large social network analysis which can be used in a broad range of applications. Thus, our system is designed based on modular architecture since it provides good flexibility. In our system, there is one module corresponding to a single phase and each module is a plug-and-play component. Algorithms and mechanisms employed in each component may change. However, by the plug-and-play design, the framework of the system does not change. In the following paragraphs, we will provide details of each component design.
b) Domain Decomposition Phase
As we mentioned, it is not feasible for each processor to handle the whole network. We need to partition the large graph into small parts. The Domain Decomposition phase takes the charge of partitioning a large graph into computationally tractable intra-related balanced sub-graphs.
The Domain Decomposition phase is important for our methodology. From the methodology architecture, which is shown in Figure 3-1, we can see that how well a graph is decomposed will affect the quality of the initial approximation of the whole graph and the work load remaining in the recombination phase.
Arbitrary/random graph partition is not suitable for the DD phase. The Domain Decomposition phase has its own requirements on graph partitioning. First, sizes of sub-graphs generated by the DD phase should be small enough to meet the limits of SNA agents/processors. Second, all these sub-graphs should have balanced sizes. Dividing a big problem into balanced small parts will help us to improve the system’s efficiency. Third, generated sub-graphs should be “isolated” from each other. Since we want to use the results from each sub-graph
to initially approximate the solution of the whole graph, the more isolated sub-graphs, the more accurate approximation we will get and the less work remained in the RC phase.
During the design of the domain decomposition, it is vital to consider the balance of the work in dividing and combination. Putting all the work on dividing, such as quick sort algorithm [BaaseG’00], or leaving all the work to combining, such as merge sort algorithm [BaaseG’00] are both unsuitable for our methodology. Putting a lot of efforts on dividing, we can obtain initial approximation with very good quality. However, this will break the ability for making quick response. Putting main efforts on combination, we can get the decomposition done within a very shot time. Nevertheless, the obtained quick analysis should be useful. We cannot afford to miss a lot of important information in the graph in the initial approximation. Thus, it is necessary to design a specific algorithm for decomposing a large graph into intra-related small parts within a relatively short period of time.
Obviously, in the DD phase, we can check the connectivity of a graph and put each connected component onto a single processor. Checking graph’s connectivity does not cost long time. However, for a large network, its biggest connected component may be also large. Usually, for a large graph, we have to partition it with discarding some connections in the graph.
In order to improve the quality of initial approximation of a network and balance the work between dividing and combining, there are many metrics that may be considered for guiding the process of graph decomposition. The number of cut-edges is one of the most fundamental factors for graph partitioning. Cut-cut-edges are defined as those edges whose endpoints belong to different sub-graphs. The sum of cut-edges’ weights is defined as graph cut-size. When we partition a graph, we will remove cut-edges and convert the graph into several disconnected components/sub-graphs. The more edges cut, the more information we will lose.
In order to alleviate the work in combination and achieve more accurate initial approximation, cut-size should be optimized. Actor degree is another significant factor we may need to consider during graph partitioning. For many cases, nodes with high degrees are centers of communities. It is not good to place nodes with high degree on or close to the boundary of sub-graphs. Here, a sub-graph’s boundary is defined as the set of nodes with which cut-edges are incident. In some cases, we should also consider the similarity between actors during partitioning a graph. Putting similar actors into the same part will provide non-trivial insights for social network analysis. According to various types of social networks and applications, there are many other factors which may be considered in the domain decomposition, such as the importance of each node, the connectivity property of each node and the sub-graph we generated, etc. When to use them and how to use them will be determined by the specific social network and its application.
Essentially, the DD phase can be treated as a multi-objective optimization process. The objective function will be determined by general criteria for graph decomposition and specific concerns required by applications or users. The task of the DD phase is to find an optimized graph partition within a relatively small time.
c) Initial Approximation Phase
After the DD phase, a large network is partitioned into small sub-networks. These small graphs can be easily analyzed by current SNA techniques or specially designed approaches. Comparing with analyzing the whole large graph, analysis results for sub-graphs can be obtained within a much smaller period of time. These results can be used as a preliminary approximation of the original network. These initial approximation results can help SNA users to establish the fundamental feeling, recognize the basic structure, and identify primary important components and properties of the network. In the IA phase, tools employed at each SNA agent can be current commercial SNA software packages or some
specially designed algorithms.
d) Recombination Phase
The function of the RC phase is to adopt graph’s dynamic change and incrementally refine partial results over time, based on results obtained locally and/or externally, so as to achieve the exact (or a good approximate) analysis of the original network. The anytime-anywhere property of our methodology is mainly demonstrated in this phase.
From the methodology architecture (Figure 3-1) we can see that SNA agents/ processors are connected to communicate with each other through physical networks. The analyses of the local sub-graph are generated at each SNA agent in IA phase. Then, each agent refines its local solutions based on local information and solutions obtained elsewhere (if needed), and propagates its new solutions through the whole network stage by stage.
Since networks are dynamic, there will be changes happening in large networks during analyses processes. In the RC phase, no matter where and when these changes happen, they will be adapted locally by each SNA agent. Then, if needed, the relevant information will be transmitted to other agents and the effects of these changes will be incrementally propagated through the whole network.
For both anytime and anywhere approaches in the RC phase, there are two significant concerns which should be considered. First, we should have the ability to predict or check the convergence of algorithms. In other words, we should know when the obtained results are exact or accurate enough. Second, it is necessary for us to measure or predict for users the accuracy of partial solutions obtained in the RC phase.
3.4 Focuses of Our Methodology
Currently, in the field of SNA, social networks are analyzed based on numerous types of SNA metrics which have different requirements and properties. Unsurprisingly, such variations imply diverse SNA methodological constructs. In our anytime-anywhere methodology design presented in this dissertation, we focus our attention on a broad group of on SNA metrics that have certain structure or criteria.
In particular, we consider, SNA metrics which can be recursively defined. In other words, the metric value on the next stage can be calculated from partial results obtained at current stage and/or previous stages. This requirement is easy to understand. If a metric cannot be recursively defined, then after obtaining partial results on each stage, we need to do the recalculation from scratch for the next stage. Comparing with methods which directly calculate the exact results, this will introduce a great amount of overhead.
In order to effectively and efficiently handle a graph’s dynamic information during analysis process, we determine elements in partial or accurate results which are affected (or non-affected) by the dynamic change. Without this ability, we may have to work on all elements in the obtained results. It is similar as recalculating whole results from scratch. If we can identify the affected elements, we can focus our efforts on making proper changes for these affected elements. Also, in order to achieve better efficiency, the effects of dynamic changes should be able to be calculated either based on obtained results or from only a portion of original problem inputs.
3.5 Summary
In this chapter, we proposed an anytime-anywhere methodology for effectively and efficiently analyzing large and dynamic social networks. According to working processes, our methodology can be decomposed into three main phases: Domain Decomposition, Initial Approximation, and Recombination. The anytime-anywhere property of our methodology is mainly implemented and expressed in functional design of the Recombination phase. Our met