Volume 44
Article 21
3-2019
Update Tutorial: Big Data Analytics: Concepts,
Technology, and Applications
Hugh J. Watson
University of Georgia, [email protected]
Follow this and additional works at:
https://aisel.aisnet.org/cais
This material is brought to you by the AIS Journals at AIS Electronic Library (AISeL). It has been accepted for inclusion in Communications of the Association for Information Systems by an authorized administrator of AIS Electronic Library (AISeL). For more information, please contact
Recommended Citation
Watson, H. J. (2019). Update Tutorial: Big Data Analytics: Concepts, Technology, and Applications. Communications of the Association for Information Systems, 44, pp-pp.https://doi.org/10.17705/1CAIS.04421
C
ommunications of the
A
ssociation for
I
nformation
S
ystems
Tutorial DOI: 10.17705/1CAIS.04421 ISSN: 1529-3181
Update Tutorial: Big Data Analytics: Concepts,
Technology, and Applications
Hugh J. Watson
Department of MIS University of Georgia
[email protected] Abstract:
In 2014, I wrote a paper on big data analytics that the Communications of the Association for Information Systems published (volume 34). Since then, we have seen significant advances in the technologies, applications, and impacts of big data analytics. While the original paper’s content remains accurate and relevant, with this new paper, I update readers on important, recent developments in the area.
Keywords: Big Data, Analytics, Adoption, Hadoop, Spark, Data Lakes, Algorithmic Transparency.
This manuscript underwent editorial review. It was received 07/18/2018 and was with the authors for 1 month for 1 revision. Indranil Bose served as Associate Editor.
1
Introduction
Big data analytics has received considerable attention over the past 10 years. The collection, storage, and analysis of high volume, velocity, and variety data (the three Vs) initiated a new decision support generation (Watson, 2017). In 2014, I published a popular tutorial in CAIS that described big data concepts, technology, and applications (Watson, 2014). Though the original paper remains accurate and relevant, important developments have emerged that merit attention, such as:
• The continuing adoption of big data analytics
• Interesting and significant applications
• Changes in the technologies in the Hadoop ecosystem
• Data lakes and their relationships to data warehouses
• Advanced analytics models and their deployment, and
• The increasing importance of analytics transparency.
I cover each topic in this update to the original tutorial on big data analytics.
2
The Adoption of Big Data Analytics
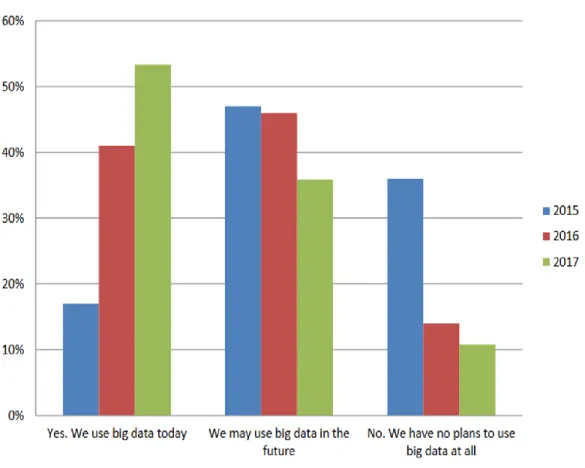
Companies’ use of big data analytics continues to grow, which recent surveys, such as one from Dresner Advisory Services (2017), reflect. Continuing studies conducted in 2015 and 2016, Dresner Advisory Services surveyed over 200 IT and line-of-business executives around the world in 2017 about whether and how their companies use big data. As Figure 1 shows, the survey revealed a significant increase in how many companies use big data in 2017 compared to previous years. Over 50 percent of the surveyed organizations use big data and over 35 percent said they would possibly do so in the future. Fewer companies now have no plans to use big data. Not surprisingly, the survey found that large organizations had higher adoption rates than smaller ones.
Figure 1. The Adoption of Big Data from 2015 to 2017 (Dresner Advisory Services, 2017)
Big data has moved beyond the hype stage as we now better understand possible use cases, additional practical and achievable projects, and more mature technologies. The survey found that more organizations
use big data analytics for data warehouse optimization than for any other purpose. Data warehouse optimization refers to integrating big data platforms (e.g., Hadoop, data warehouses) into an organization’s decision support data infrastructure in order to best meet business needs at the lowest possible cost. Some of the surveyed organizations have implemented or begun to implement data lakes (see Section 5) as a staging area to prepare data for a data warehouse, as a data platform for analytics, or for long-term data storage. The survey showed that organizations also use big data analytics to analyze social media, analyze clickstreams, detect fraud, and analyze data streams from the Internet of things (IoT).
Changes have also occurred in the Hadoop ecosystem. The survey found that Spark (see Section 4) has passed MapReduce in popularity. However, MapReduce remained important since more companies used MapReduce in 2017 compared to the number that used it in 2015. While some legacy and other appropriate applications use MapReduce, Spark is faster, has a higher capacity, and works with a wider range of applications.
Since relational database systems emerged in the 1980s, most companies have used SQL to store and access relational data. Indeed, millions of system developers can write SQL queries. With the emergence of new, non-relational platforms (e.g., Hadoop), developers want to still be able to write SQL-like queries, and technology vendors responded. One can observe this development in the most popular methods that organizations used to access big data—Spark SQL and Hive/HiveQL, which took first and second place, respectively.
The study found four major Hadoop vendors at the top: Cloudera, Hortonworks, Amazon, and MapR. All four have grown in popularity as the level of big data adoption has grown. The market leader, Cloudera, focused on commercial offerings. Hortonworks took an open-source approach. Amazon targeted the mass market and MapR focused on enterprise deployments. In October 2, 2018, Cloudera and Hortonworks announced plans to merge.
2.1
Adoption Challenges
While more companies now use big data analytics, many have experienced adoption challenges. Surveys have found that the current shortage of people with the requisite analytical and technical skills to be the most significant issue (Kyvos, 2018; Bange, Grosser, & Janoschek, 2015). While all employees now need increased analytical skills, organizations face the most difficulty in finding people with the ability to do advanced analytics (e.g., data scientists with machine learning expertise). A shortage of people with the technical skills that organizations need to create and operate high-performance big data architectures (e.g., real-time data warehouse, Hadoop) also exists.
Universities have responded to this shortage by introducing new courses, concentrations, and degree programs, but it will take time before new graduates can fill existing needs. Most schools can better train students on the algorithms that they need for analytics than provide hands-on training on big data platforms (though the movement of analytics to the cloud makes the latter somewhat easier).
Data privacy and security represents another challenge. This topic constantly appears in the news and keeps CIOs and CEOs awake at night. Many of the use cases for big data analytics center on the customer: understanding and predicting customer needs, desires, and behaviors. Organizations need to automate, store, and analyze customer data in ways that comply with laws, regulations, and ethical standards while also protecting the data from attacks.
A final challenge concerns the performance of big data platforms. The high volumes of data and the need to support real-time applications currently challenge the capabilities of today’s technologies and the people who create, operate, and manage big data infrastructures.
3
Big Data Applications
We have also seen growth in the number and variety of big data applications. Among the most significant and interesting are those that involve natural language processing (NLP) and visualization systems.
3.1
Natural Language Processing / Digital Assistants / Chatbots
How people interact with computers has changed over the years. The Job Control Language (JCL) interface for batch jobs gave way to command language interfaces and then were replaced by graphical user interfaces. The natural language processing era has arrived as users can increasingly interact with
computers in their natural spoken or written language. Deep learning algorithms make natural language interfaces possible (see Section 6) (Watson, 2017).
Digital assistants (also called virtual assistants) such as Siri and Google Assistant for smartphones and Alexa and Google Assistant for the home have changed people’s experiences and perceptions about how to interact with computers. These digital assistants have also created new business opportunities for some companies by making it easier for customers to make purchases and conduct their daily lives. Take, for example, Amazon’s Echo and Echo Dot, which use Alexa as their digital assistant. These amazing devices are sold for less than $200 and $50, respectively. While they may not be thought of as traditional “loss leaders,” these relatively inexpensive devices do generate significant revenue streams though customers’ ability to easily make purchases from Amazon and the Echo “skills” (apps, such as turning on your sprinkler system) that help drive customers to Amazon’s business partners.
These conversational interfaces have also started to change how users access business intelligence and analytics-related information. For example, one can use the Zoomdata BI platform with Echo to allow users to ask questions such as “Who was the leading sales person in the northeast region last week?” and receive a voice response (Zoomdata, 2016). Currently, a person has to predefine the questions that Echo can answer, but we can expect this requirement to change over time.
Chatbots, which simulate human conversations, have also seen increased use, especially for customer support. For example, on the U.S. Army’s recruiting website (www.goarmy.com), the chatbot “Sgt. Star” answers questions about the army (for fun, ask Sgt. Star if military service is dangerous). One can give interesting personalities to chatbots.
Simple chatbots rely on rules and can respond only to anticipated queries, while more advanced chatbots employ advanced AI techniques and can learn based on interactions with users. The CNN chatbot on Facebook Messenger exemplifies a simple chatbot. Companies that introduce chatbots that learn have to carefully monitor their interactions. To illustrate, in 2016, Microsoft introduced Tay (an acronym for “thinking about you”) that mimicked the language patterns of a 19-year-old American girl and learned from interacting with human users on Twitter. Unfortunately, trolls taught Tay to give racist and sexually charged replies, and Microsoft had to take Tay down after only 16 hours.
In addition to providing customer service, chatbots have great revenue-producing potential, which explains why messaging services such as Facebook Messenger have begun to invest heavily in them. For example, assume that you text a friend about getting together for dinner. A chatbot might pop up to say that an excellent Italian restaurant (one of your known, favorite cuisines) operates nearby and to ask if you want to make a dinner reservation for 7:00 (it knows when you normally eat). You tell the chatbot to do so, and, after the chatbot makes the reservation, it asks you if you want to schedule an Uber pickup at 6:45 (you live 10 minutes away from the restaurant). After confirming with you, the chatbot says that it will send you a reminder at 6:30.
In this example, the chatbot reduces “customer friction” by making it easier to do business; in this case, with the restaurant and Uber. Further, the messaging service receives compensation for sending customers to them. Notice that everything takes place in the messaging app; you do not need to use separate apps to find a restaurant, make a reservation, and schedule a ride. In integrating chatbots into their messaging systems, companies believe that people will prefer the convenience of an intelligent single app rather than having to use multiple apps.
3.2
Visualization Systems/Drones/Facial Action Coding Systems
Visualization systems have become ubiquitous. Facebook can tag photos. Customs agents at (some) airports can identify people who should not be admitted to a country. Diagnostic systems can assist in reading mammograms.
Drones equipped with cameras have also become increasingly common. While they sometimes receive criticism due to their potential for invading privacy and their use in war (e.g., drone strikes), they also have highly beneficial applications, such as when employed to assist with disasters (Eastern Kentucky University, 2018). One can use video drones to assess unsafe or otherwise inaccessible situations on the ground. For example, after the 2015 earthquake in Napal, drones took pictures that disaster relief personnel used to create 3D maps and models through image processing software. These maps and models were used to
assess the damage, run search and rescue operations, coordinate relief efforts, and reconstruct damaged buildings.
Further, some visualization systems can not only recognize objects (e.g., people, cancer cells) but also interpret what they “see” (Watson, 2017). Consider, for example, Facial Action Coding Systems (FACS). Based on facial movements (say from a video), it detects basic emotions such as joy, anger, surprise, fear, contempt, sadness, and disgust based on facial movements (i.e., microexpressions). Apple, Google and Microsoft represent just some companies that have begun to work on applications of the technology. The systems have prominent applications in marketing, but companies are also working on applications in homeland security, healthcare, and user interfaces.
The consumer goods giant Proctor & Gamble (P&G) provides an interesting marketing example. The company conducted a focus group to gauge reactions to possible scents for a new detergent. In addition to recording participants’ comments about the scents, the company used facial coding software to analyze their reactions. At the end of the session, participants could take home the detergent with the scent they preferred. Interestingly, the facial coding software’s predictions proved more accurate about what the participants selected than what they said verbally.
While “cool”, FACS can also invade people’s privacy (I discuss privacy concerns about big data analytics in Section 7). To illustrate, in the future, assume a car dealership surreptitiously employs the technology to asses a buyer’s interest in a car and uses this information to bargain for a higher selling price on the customer’s favorite car. Would this practice be fair to the car buying public?
4
Recent Developments with Hadoop/Spark
Hadoop’s massively scalable parallel processing architecture and capabilities have facilitated the storage and analysis of big data. The Hadoop Distributed File System (HDFS) manages the data across all servers. MapReduce provides a processing and analysis framework for efficiently analyzing the vast amounts of data that HDFS stores. While a good first-generation technology, MapReduce’s limitations spawned the Apache Spark project (i.e., software) (Olson, 2015). As I mention in Section 2, Dresner Advisory Services’ survey found that Spark has become more popular than MapReduce.
Several Spark capabilities give it an advantage. It does analytics in memory, which provides greater analysis speed. It also works with both batch and real-time workloads, unlike MapReduce, which only supports batch processing—an important point given the increase in streaming and critical event processing data. It also better supports queries that machine learning applications need. It is easier to program than MapReduce (which requires considerable Java code) and more easily connects to Apache projects and other software in the Hadoop ecosystem. It also processes jobs efficiently and works well with analytics programming languages such as Python and R. Traditional MapReduce tools such as Hive and Pig also run on Spark. Figure 2 shows Spark’s core components (Melvin, 2016). Spark SQL allows one to run SQL-like queries on structured data. Spark streaming uses micro batch processing to provide near real-time data processing capabilities. When one needs true real-time processing, such as with automated stock trading, one needs to use software such as Apache Storm. MLib provides a library of machine learning algorithms and utilities. GraphX provides algorithms for applications that structure data as graphs so that one can, for example, identify potential friends or connections on social media. These and other Apache software programs, open-source programs, and commercial software programs provide a powerful ecosystem for performing analytics on Hadoop.
Figure 2. Spark’s Components (Melvin, 2016)
5
Data Lakes
Organizations now collect massive amounts of raw data and store it in HDFS on Hadoop or other platforms. Many companies use Amazon Simple Storage Service (Amazon S3) to store their big data. People commonly refer to this collection of data as a data lake. James Dixon, the founder of the open-source BI company Pentahoe, first introduced this term and has said that one can envision a data lake in the following way (Dull, 2015):
If you think of a data mart as a store of bottled water—cleansed and packaged and structured for easy consumption—the data lake is a large body of water in a more natural state. The contents of a data lake stream in from a source to fill the lake, and various users of the lake can come to examine, dive in, or take samples.
The source systems for a data lake include both operational systems and big data such as IoT, websites, and social media. A data lake accepts data in its native (i.e., original) format, and it does not require a predefined data model (e.g., entity-relationship model). This schema-on-read approach accepts data in any format, and data preparation does not arise until an application reads it for analysis purposes. However, data in a data lake that is going to be used for known, specific purposes, such as for OLAP, can be stored in a data model (e.g., star schema) appropriate for its intended use. One can store the data in a data lake long term for possible future use, processed and fed to a data warehouse or mart, or analyzed directly. Programmers, skilled analysts, and data scientists who know how to access and analyze the data are a data lake’s typical users. Vendors have made strides in developing tools for accessing and analyzing data in data lakes.
Companies should not store data “just in case” they need it (Watson, 2015). This “store it and they will come” mentality does not make good business sense. Companies should implement governance processes to decide what data they store and for how long. They should have a solid business case for any data they place in a data lake. Companies should also make sure that there is metadata for the data lake. Without it, IT and especially users will not know what data the data lake contains, its quality and lineage, or how to access it. Data lakes have the potential to be “data swamps” unless a company carefully thinks about, manages, and controls them.
Because many companies do not follow these guidelines, many data lakes fail. However, when done correctly, Gartner says a company can have a data reservoir (i.e., a carefully considered and managed data lake). With a reservoir, a company manages the flow of water (i.e., data) and filters it, transforms it, and makes it secure and portable (i.e., fit for analysis).
5.1
The Data Warehouse is not Dead
Some people argue that data lakes can replace data warehouses (Smith, 2017) based on the rationale that organizations typically create data warehouses to 1) provide easy access to needed data, 2) analyze data at the speed of business thought, and 3) provide a single version of the truth. All of these objectives can at least conceptually be met by a data lake, but there are requirements that must be satisfied. For instance, data management professionals should transform and model some of the data for certain applications, such as applications that involve OLAP. Further, to use a data lake rather than a data warehouse, an organization needs strong master data management (MDM) so that IT, applications, and users know what data it stores,
what data can be accessed, and how to access the data. Software advances in MDM and data catalogs (which often employ AI) have made it easier to store, catalog, and access data in a data lake. The potential advantages of data lakes include lower costs, the ability to store data of any structure, and the ability for data scientists to access raw (i.e., unprocessed) data, which they sometimes prefer for model building. Gartner and other experts argue that companies should treat data lakes as an addition to their decision support data infrastructure rather than as a replacement (Wells, 2017) based on the strong argument that many companies have already heavily invested in the hardware and software, ETL processes, data models, metadata, training, and so on that data warehouses require. The data warehouse serves an analytics production function for queries, reports, OLAP, and dashboards/scorecards. Business users can easily access the data in a traditional data warehouse, and data warehouses can handle more queries and concurrent users than data lakes. The data in the warehouse is “squeaky clean”, which is especially important for compliance reporting and reports that the CEO and/or CFO have to sign off on.
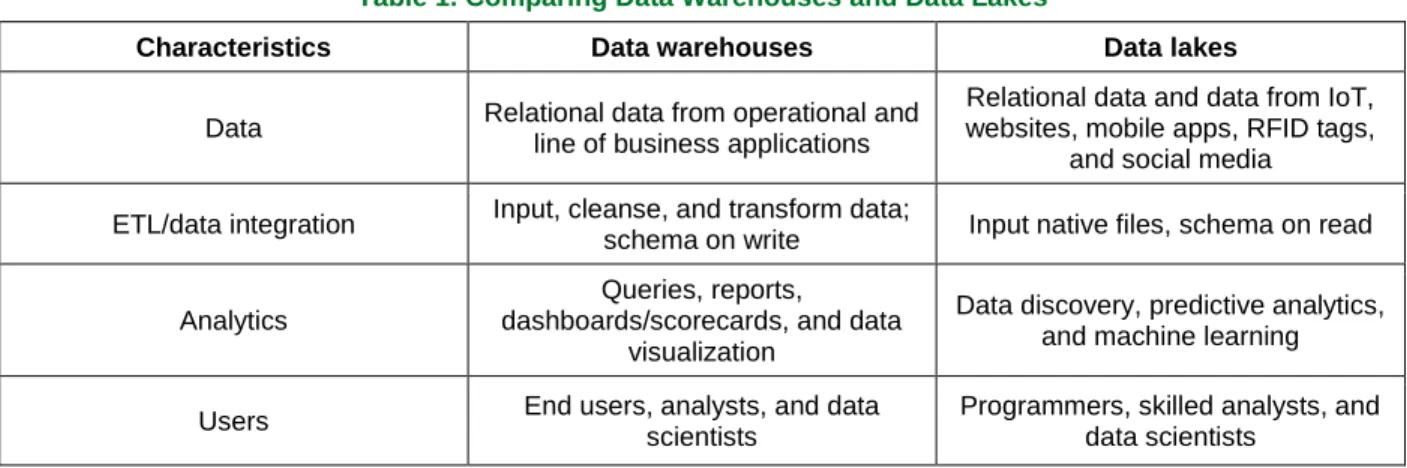
Table 1 compares data warehouses and lakes at a high level. This landscape is changing rapidly, however, as database technologies are evolving to handle data of any structure in a single database and to be part of a larger, virtual (e.g., federated) data infrastructure with interconnected components. As a result, the distinctions between data warehouses and lakes will likely blur in the future. Gartner uses the term “logical data warehouse” to conceptually refer to the integration of data lakes and data warehouses (with real-time and historical data).
Table 1. Comparing Data Warehouses and Data Lakes
Characteristics Data warehouses Data lakes
Data Relational data from operational and line of business applications
Relational data and data from IoT, websites, mobile apps, RFID tags,
and social media ETL/data integration Input, cleanse, and transform data;
schema on write Input native files, schema on read
Analytics
Queries, reports, dashboards/scorecards, and data
visualization
Data discovery, predictive analytics, and machine learning
Users End users, analysts, and data
scientists
Programmers, skilled analysts, and data scientists
6
Advanced Analytics Models
WWII saw the development of analytical solutions for large, complex logistical and supply problems. Mathematical programming, simulation, and Markov processes represent just some of the modeling methods that took hold and remain popular with management science and operations research professionals.
While these methods are useful, companies have paid more attention to descriptive analytics such as reporting, dashboards/scorecards, and alerts. However, their focus has begun to expand as they move along the analytics maturity curve and develop predictive analytics models (Watson, 2017). Much of this interest comes from the ability to collect, store, and analyze big data and advances in computing power, algorithms, and software to analyze the data.
Organizations and individuals have used statistical models such as multiple regression for predictive purposes for many years. These predictive models use statistical criteria such as minimizing the squared deviation off the regression equation. Artificial intelligence models that mimic human cognitive processing capabilities have also existed for many years but have become much more popular in the last decade. Machine learning algorithms that often combine statistical and AI methods to analyze vast quantities of data on high-performance clusters of computers are used for many of the new, exciting applications, such as natural language processing and vision systems.
Neural and hierarchical neural networks (commonly referred to as deep learning) that learn data representations rather than use task-specific algorithms to analyze data represent perhaps the most significant development in analytics models. They function in an analogous way to how webs of neurons in
the human brain process data (Vandegrift, 2016). Practitioners and academics sometime refer to them as artificial neural networks to differentiate them from biological neural networks.
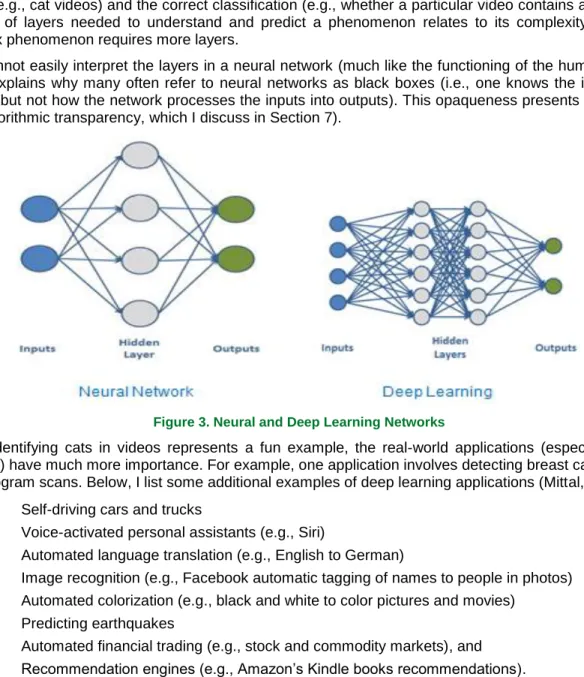
Figure 3 shows simple neural and hierarchical neural networks (i.e., deep learning). To perform an analysis, an analyst inputs vast amounts of data for the phenomenon of interest to the neural network algorithm. A classic example involves using a neural network to identify cats (as opposed to, for example, other animals) in YouTube videos. The videos and information about whether they contain a cat serve as the inputs. Cats’ characteristics do not serve as an input; the neural network learns these characteristics much like a child learns the characteristics associated with cats. The neural network algorithm requires that the analyst code each video as to whether it contains a cat. Coding can be challenging when one deals with a large amount of training/testing data; thus, one may find it helpful to employ creative approaches such as crowdsourcing tools.
In a simple neural network, the inputs connect to a “hidden” layer of nodes that represent the neurons. In contrast, a more complex hierarchical network has multiple layers that pass their analysis results on to the next layer in order to provide a more complete, higher-level understanding of the relationship between the inputs (e.g., cat videos) and the correct classification (e.g., whether a particular video contains a cat). The number of layers needed to understand and predict a phenomenon relates to its complexity—a more complex phenomenon requires more layers.
One cannot easily interpret the layers in a neural network (much like the functioning of the human brain), which explains why many often refer to neural networks as black boxes (i.e., one knows the inputs and outputs but not how the network processes the inputs into outputs). This opaqueness presents a problem with algorithmic transparency, which I discuss in Section 7).
Figure 3. Neural and Deep Learning Networks
While identifying cats in videos represents a fun example, the real-world applications (especially deep learning) have much more importance. For example, one application involves detecting breast cancer from mammogram scans. Below, I list some additional examples of deep learning applications (Mittal, 2017):
• Self-driving cars and trucks
• Voice-activated personal assistants (e.g., Siri)
• Automated language translation (e.g., English to German)
• Image recognition (e.g., Facebook automatic tagging of names to people in photos)
• Automated colorization (e.g., black and white to color pictures and movies)
• Predicting earthquakes
• Automated financial trading (e.g., stock and commodity markets), and
• Recommendation engines (e.g., Amazon’s Kindle books recommendations).
One can develop applications using a wide variety of neural network software that range from cloud-based Amazon SageMaker, Microsoft Computer Toolkit, and Google TensorFlow to the desktop-based Neural
Designer. Most of the software is open source and accessed through an application programming interface (API).
6.1
Deploying and Monitoring Analytics Models
After an accurate model is created, it must be implemented, monitored, and updated as needed [Wexler, Thompson, and Aponte, 2013]. A firm in the early stages of analytics maturity may have only a few models with few updates and can manage them in an ad hoc manner: someone builds a model, writes and inserts the model’s code into the application, monitors the model’s performance, and repeats the process whenever the model no longer meets performance expectations. This process becomes costly and untenable, however, when the number of models runs into the thousands, multiple people deal with the models, and/or conditions change rapidly. For example, an out-of-date mortgage application model that scores lending applications can cost millions if it incorrectly predicts/scores borrowers who ultimately file for bankruptcy or face foreclosure. As a firm becomes more analytically mature, it must implement the kinds of well-defined, automated processes associated with production systems.
The need for model management dates back to decision support systems (DSS) and recognizes the importance of systems that allow users to build, store, use, and update models (Sprague & Watson, 1975). Current model management goals include (Bailey, 2016):
• Support for building models with repeatable, reliable results that do not depend on any single person
• Schedule the running of models on an ongoing basis to obtain timely results
• Make model results available to users and applications in a timely and usable manner
• Monitor model performance on an ongoing basis to ensure quality and generate alerts and actions when there are degradations in performance
• Support automated model rebuilding and reintegration into production environments, and
• Maintain version control when there are changes to models over time.
Companies follow a variety of model-management strategies (Bailey, 2016). As I suggest above, to update a small number of models infrequently, one can use a manual approach. However, over time, this strategy typically becomes problematic and leads to more automated methods. For example, one can employ Window Scheduler to run Windows batch processes on a scheduled basis. Most database vendors (e.g., Teradata) have in-database analytics and scoring capabilities that help users to develop and execute scoring applications (e.g., propensity-to-buy). Firms can write or acquire customized software as middleware to help analysts execute various tasks in an integrated way. Both commercial (e.g., SAS, IBM) and open-source (e.g., Rapid Miner) software vendors have developed model management capabilities, and we can expect to see further progress in this area due to its importance.
7
Algorithmic Transparency
Today, companies collect, store, and analyze vast quantities of personal data. Notable examples include the large digital natives such as Facebook, Twitter, and Google that analyze people’s posts, page views, likes, location, contacts, social networks, and email. Their business models depend on generating revenue based on creating targeted ads for clients. To illustrate, suppose that a person sends an email via Gmail to a friend about a possible trip to Las Vegas or searches online for Las Vegas hotels. Soon afterwards, pop-up ads appear for Las Vegas hotels, travel, entertainment, and activities. The company(s) (e.g., Facebook) that created the ads receives compensation for their targeted marketing.
Companies of all sizes employ digital marketing. They use some combination of in-house capabilities, outsourcing, or the platforms of companies such as Facebook. Even mom-and-pop stores can relatively easily create ads. For example, on Facebook, one needs only create an ad account, a business page, and an ad; identify the characteristics of the target audience; select the ad’s placement, budget, and timing; order the ad; and monitor its success (Marinho, 2017).
Most people in the USA willingly give up their personal data. For example, they download an app for their phone, quickly scroll through an overly long agreement that uses small font and legalese, and give up the right to use and share personal data with business partners. By clicking on “I agree”, people give up control over a treasure trove of personal data.
The popular dating app Tinder provides a good example. Tinder uses data from an individual’s Facebook account to help find matches (Thompson, 2013). It looks at your friends, the interests you share with your friends, where you went to school, and who you swipe “yes” or “no” to. It also monitors how you use the app. It looks at how often and you talk with people on the site and for how long to see if it should show you other similar Tinder users.
Companies also use personal data and algorithms to make decisions that significantly affect people’s lives, such as whether they get a car loan, whether they receive an invitation to interview for a job, and even how long they go to prison for. While these applications can facilitate decision making, they potentially pose a risk. Cathy O’Neil (2016), in her influential book Weapons of Math Destruction, argues that algorithms can increase inequality. They can amplify structural discrimination, produce errors that deny services to individuals, and influence election results (Diakopoulos & Friedler, 2016).
7.1
The Creepiness Scale
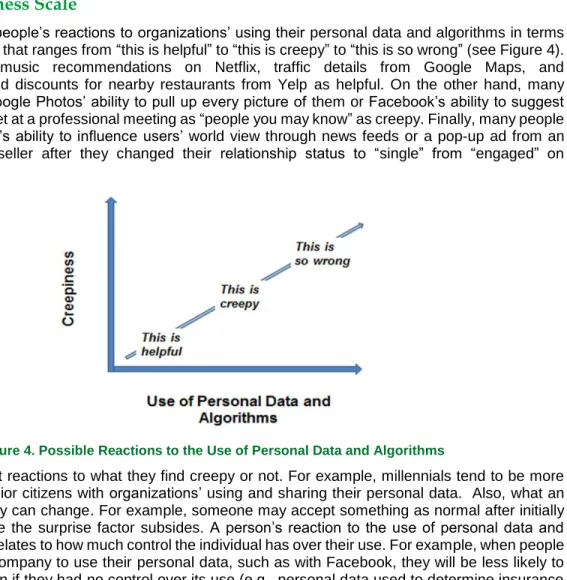
We can think about people’s reactions to organizations’ using their personal data and algorithms in terms of a creepiness scale that ranges from “this is helpful” to “this is creepy” to “this is so wrong” (see Figure 4). Most people see music recommendations on Netflix, traffic details from Google Maps, and recommendations and discounts for nearby restaurants from Yelp as helpful. On the other hand, many people would see Google Photos’ ability to pull up every picture of them or Facebook’s ability to suggest someone they just met at a professional meeting as “people you may know” as creepy. Finally, many people would see Facebook’s ability to influence users’ world view through news feeds or a pop-up ad from an engagement ring reseller after they changed their relationship status to “single” from “engaged” on Facebook as wrong.
Figure 4. Possible Reactions to the Use of Personal Data and Algorithms
People have different reactions to what they find creepy or not. For example, millennials tend to be more comfortable than senior citizens with organizations’ using and sharing their personal data. Also, what an individual finds creepy can change. For example, someone may accept something as normal after initially finding it creepy once the surprise factor subsides. A person’s reaction to the use of personal data and algorithms normally relates to how much control the individual has over their use. For example, when people opt in to allowing a company to use their personal data, such as with Facebook, they will be less likely to object to that use than if they had no control over its use (e.g., personal data used to determine insurance rates). Also, a person may not mind sharing some personal information, such as where they work, but not want to share other information, such as their current location. People normally do not mind sharing their personal information, such as their location, with Google Maps or Waze when such apps require that information to provide a service they want (e.g., provide directions) but they may object if Google (which owns both apps) later shared it with other companies without their permission. Even when a person opts out of sharing personal data with a company (at least in the USA), the company could still acquire the data from a third-party data integrator. These companies collect vast amounts of demographic and behavioral (e.g., websites visited, products purchased), store and analyze the data on specialized data-management platforms (e.g., Oracle DMP, Adobe Audience Manager), and sell the data and analyses to client firms.
7.2
Algorithmic Transparency Defined
The public and governments have begun to express more concern about how companies collect, store, share, and use personal data and algorithms. Multiple reasons drive this concern: greater awareness and use, high-profile security breaches, foreign meddling (e.g., Russia’s meddling in the 2016 election), and greater news coverage. This focus has led to calls for greater algorithmic transparency (also referred to as accountability) from companies and government organizations that use personal data and algorithms. Algorithmic transparency refers to openness about how organizations use personal data and algorithms to make decisions and take actions. It encompasses:
• What personal data organizations collect, store, use, and share
• How individuals can access and correct errors in personal data
• What variables and algorithms organizations use in their models
• How organizations use the algorithmic-created information
• How individuals can request explanations for decisions made and seek redress, and
• How organizations develop, test, review, and govern the algorithms (Watson & Nations, 2018).
7.3
Algorithmic Transparency Principles
Companies need to be careful in how they use personal data and algorithms. Inappropriate use can damage a company’s brand, which occurred with Target when it received unfavorable national media attention for sending pregnancy-related coupons to a teenage girl (Hill, 2012). It can also decrease a company’s market value. Facebook’s stock decreased over US$100 billion following news coverage of a data breach involving Cambridge Analytica (it recovered its market value quickly, however) (Shen, 2018). If a company violates laws or regulations, the fines can be substantial. The recently enacted General Data Protection Regulations (GDPR), which cover how organizations can collect and use the personal data of all European citizens, carries potential fines of four percent of their global revenues or €20 million (whichever is greater) (Drolet, 2017).
The Association for Computing Machinery (ACM) in the US and Europe, working both separately and together, have codified seven principles for ensuring that organizations use personal data and algorithms fairly (Garfinkel, Matthews, Shapiro, & Smith, 2017). They provide a good starting point for a company to think about and develop its policies and practices.
1) Awareness: individuals should know what personal data organizations collect, store, use, and share and the extent to which a decision is automated (i.e., made by an algorithm). Ideally, rather than a blanket agreement, apps should ask for permission when they need data and explain why.
2) Access and redress: mistakes can occur with algorithmic decision making; as such, people should be able to investigate how and why a decision was made, and if they find an error, have it corrected.
3) Accountability: it is not acceptable to say “the algorithm did it”. The companies, managers, and professionals who build algorithms need to accept responsibility for the accuracy and consequences of the models they develop.
4) Explanation: firms should be able to explain a model’s logic in ways that humans can understand. Some predictive models are easier than others to explain, such as regression analysis in comparison to deep learning. Firms need to have an algorithmic interpreter role to explain model logic and output to people both internal and external to the firm. Companies should also explain how they build, test, and use algorithms.
5) Data provenance: people should be able to learn what data sources an organization used to create an algorithm. Organizations should know its entire data lineage and make it available for review. The data in these sources should be accurate and free from bias.
6) Audit-ability: organizations should record the processes they use to build algorithms with a development methodology such as CRISP-DM or SEMMA. They should also implement systems to respond to queries about the process, which can lead to greater customer confidence.
7) Validation and testing: organizations should ensure that their automated systems perform as intended. They should develop and test the algorithms they use with scientifically accepted
procedures. They should review algorithms that affect people’s lives carefully and ensure they comply with all laws and regulations. They should also recognize that algorithms become out of date and, thus, that they need to update them.
7.4
The Importance of Governance
Effective algorithmic transparency requires governance. As such, organizations need to ensure that they have the necessary people, committees, processes, and technology in place. The people include senior managers who provide the business strategy that analytics will enable, analytics managers who develop the analytics roadmap and select and oversee analytics projects, and data scientists who develop specific algorithms and applications. Additionally, business managers bring a common-sense perspective to how customers will likely react to the particular ways that organizations use data and algorithms. Governance also requires lawyers to ensure that the ways in which an organization uses personal data and algorithms do not violate laws and regulations. Finally, other people can bring an ethics lens to determine whether an application poses any moral issues. Further, a C-level executive such as a CIO, chief data officer, or director of data science should lead the committee that directly oversees algorithmic applications.
New initiatives should go through a review process that ensures that they are legal, ethical, and in the best interests of the public and the company. Due to the shifting legal and societal landscape, organizations also need to monitor and review their existing algorithmic applications.
Technology can support governance efforts. For example, some software allows one to map data and trace its lineage to better understand data flows and history. Organizations cannot use some data, such as race and gender, due to federal laws and regulations. To ensure that they do not inadvertently do so, they can implement access control through database technology. They should also implement systems to monitor unfavorable reactions to how they use algorithms, such as in news media reports and social media posts.
7.5
Concerns about Security
The high-profile security breaches at companies such as Yahoo!, Equifax, and Uber have raised the public’s concerns about the security of their personal data (Armerding, 2018). These breaches typically affect a large number of people, can damage a company’s brand, result in financial losses, and have vast legal repercussions. While such breaches pose many challenges, companies can mitigate their big data security risks by taking appropriate actions.
By its very nature (i.e., three Vs), big data magnifies security issues. Big data flows from a variety of sources (some of which have weak security), comes in quickly, arrives in a variety of formats, and has high volume. New repositories that have relatively weak built-in security protection (e.g., non-SQL databases) store some of that data. Big data exacerbates the security issues associated with smaller-scale data.
External parties who either want to steal sensitive data or do malicious damage may target big data. Customer data and intellectual property represent attractive targets. Disgruntled former employees and competitors may want to degrade a company’s ability to compete. Internal workers also pose a security threat through intentional malicious actions or, more typically, by careless employees who share log-in information, fail to log off systems, or access information through public Wi-Fi.
Organizations must monitor source data, such as from sensors, to detect fraudulent data. For example, the undetected malicious insertion of fake sensor data that masks a machine’s overheating could result in significant damage. End-to-end encryption helps prevent third parties from accessing data while it travels its source to its destination (e.g., a data lake). An increasing amount of data resides in public clouds. Cloud providers often do not encrypt the data flows because they transfer so much data and constant encryption/decryption slows things down (Bekker, 2018). Companies should carefully check that their cloud providers have a high level of security. Threat-monitoring software can help an organization identify and stop network intrusions and attacks on servers. They need to maintain detailed audit information about attacks to understand what happened, prevent future intrusions, and comply with laws and regulations. Further, they can enhance the security of employees’ smart phones and laptops with well thought out bring-your-own-device (BYOD) policies and mobile device-management software.
In order to help protect the privacy of personal data, organizations can anonymize it by deleting or masking personal identifiers and related information. Organizations reduce the potential that intruders will inflict damage if they cannot access data that shows a user’s name, address, or telephone number. Organizations especially need to anonymize personal data when the law regulates it (e.g., HIPAA regulations on medical
record use). However, anonymizing does not always hide a person’s identify because analyzing available personal data with other publicly available information can often reveal it.
As an example, in 2016, the Australian Government released an anonymized data set that contained the medical billing records for 2.9 million people (Solon, 2018). Even though the records did not contain people’s names or other identifying features, researchers at the University of Melbourne found it easy to identify people and learn about their entire medical history by comparing the dataset to other publicly available information. The Australian Government quickly removed the data from its website but not before individuals had downloaded it 1,500 times. A more humorous example involved Bradley Cooper and Jessica Alba: various individuals found that they did not tip well when they compared nameless New Your taxi logs with paparazzi shots at locations around the city.
References
Armerbring, T. (2018). The biggest data breaches of the 21st century. CSO. Retrieved from https://www.csoonline.com/article/2130877/data-breach/the-biggest-data-breaches-of-the-21st-century.html
Bailey, D. (2016). Making analytics work in a production environment. Elder Research. Retrieved from https://www.elderresearch.com/blog/making-analytics-work-in-production
Bange, C., Grosser, T., & Janoschek, N. (2015). Big data use cases: Getting real on data monetization.
BARC. Retrieved from http://barc-research.com/research/big-data-use-cases-2015/
Bekker, A. (2018). Buried under big data: Security issues, challenges, concerns. ScienceSoft. Retrieved from https://www.scnsoft.com/blog/big-data-security-challenges
Diakopoulos, N., & Friedler, S. (2016). How to hold algorithms accountable. MIT Technology Review. Retrieved from https://www.technologyreview.com/s/602933/how-to-hold-algorithms-accountable/ Dresner Advisory Services. (2017). Big data adoption: State of the market. ZoomData. Retrieved from
https://www.zoomdata.com/master-class/state-market/big-data-adoption
Drolet, M. (2017). How much will non-compliance with GDPR cost you? CSO. Retrieved from https://www.csoonline.com/article/3234685/data-protection/how-much-will-non-compliance-with-gdpr-cost-you.html
Dull, T. (2015). Marketers ask: Isn’t a data lake just the data warehouse revisited? SAS. Retrieved from
https://blogs.sas.com/content/customeranalytics/2015/08/28/isnt-a-data-lake-just-the-data-warehouse-revisited/
Eastern Kentucky University. (2018). 5 ways drones are being used for disaster relief. Retrieved from https://safetymanagement.eku.edu/resources/articles/5-ways-drones-are-being-used-for-disaster-relief/
Garfinkel, S., Matthews, J., Shapiro, S. S., & Smith, J. S. (2017). Toward algorithmic transparency and accountability. Communications of the ACM, 60(9). Retrieved from
https://cacm.acm.org/magazines/2017/9/220423-toward-algorithmic-transparency-and-accountability/fulltext
Hill, K. (2012). How target figured out a teen girl was pregnant before her father did. Forbes. Retrieved from
http://www.forbes.com/sites/kashmirhill/2012/02/16/how-target-figured-out-a-teen-girl-was-pregnant-before-her-father-did/
Kyvos. (2018). BI on big data adoption survey report. Retrieved from https://info.kyvosinsights.com/hubfs/Kyvos_Content/Kyvos-Insights-BI-on-Big-Data-Adoption-Survey-Report.pdf
Marinho, R. M. (2017). How to create a Facebook ad 2018—from start to finish [video]. YouTube. Retrieved from https://www.youtube.com/watch?v=sxgDwSto3mM
Melvin, L. (2016). Quick introduction to Apache Spark [video]. YouTube. Retrieved from https://www.youtube.com/watch?v=TgiBvKcGL24&t=4s
Mittal, V. (2017). Top 15 deep learning applications that will rule the world in 2018 and beyond. Medium. Retrieved from https://medium.com/@vratulmittal/top-15-deep-learning-applications-that-will-rule-the-world-in-2018-and-beyond-7c6130c43b01
Olson, M. (2015). What is Apache Spark [video]? YouTube. Retrieved from https://www.youtube.com/watch?v=SxAxAhn-BDU
O’Neil, C. (2016). Weapons of math destruction. New York, NY: Broadway Books.
Shen, L. (2018). Facebook stock is in the red for the year after the FTC confirms investigation. Fortune. Retrieved from http://fortune.com/2018/03/26/facebook-stock-ftc-investigation-cambridge-analytica/ Solon, O. (2018). Data is a fingerprint: Why you aren't as anonymous as you think online. The Guardian.
Retrieved from https://www.theguardian.com/world/2018/jul/13/anonymous-browsing-data-medical-records-identity-privacy
Smith, S. J. (2017). The demise of the data warehouse. Eckerson. Retrieved from https://www.eckerson.com/articles/the-demise-of-the-data-warehouse
Sprague, R. H., Jr., & Watson, H. J. (1975). Model management in DSS. In Proceedings of the 7thAnnual Meeting of the American Institute for Decision Sciences (pp. 213-215).
Thompson, C. (2013). What companies are doing with your intimate social data. CNBC. Retrieved from https://www.cnbc.com/2013/10/30/what-companies-are-doing-with-your-intimate-social-data.html Vandegrift, D. (2016). How to tell if a cat is handsome: An introduction to neural networks. Medium.
Retrieved from https://medium.com/@DavidVandegrift/how-to-tell-if-a-cat-is-handsome-an-introduction-to-neural-networks-3511ebae2ad4
Watson, H. J. (2014). Tutorial: Big data analytics: Concepts, technologies, and applications.
Communications of the Association for Information Systems, 34, 1247-1268.
Watson, H. J. (2015). Data lakes, data labs, and sandboxes. Business Intelligence Journal, 20(1), 4-7. Watson, H. J. (2017). Preparing for the cognitive generation of decision support. MISQ Executive, 16(3),
153-169.
Watson, H. J., & Nations, C. (2018). Addressing the growing need for algorithmic transparency (working paper). University of Georgia.
Wells, D. (2017). Counterpoint: The data warehouse is still alive. Eckerson. Retrieved from https://www.eckerson.com/articles/counterpoint-the-data-warehouse-is-still-alive
Wexler, J., Thompson, W., & Apontem K. (2013). Time is precious, so are your models: SAS provides solutions to streamline deployment. In Proceedings of theSAS Global Forum.
Zoomdata. (2016). Zoomdata +Amazon Echo [video]. YouTube. Retrieved from https://www.youtube.com/watch?v=1GCCEiShqEk
About the Authors
Hugh J. Watson is a Professor of MIS and a holder of a C. Herman and Mary Virginia Terry Chair of Business Administration in the Terry College of Business at the University of Georgia. He is a leading scholar and authority on business intelligence and analytics, having authored 25 books and over 200 scholarly journal articles. Hugh helped develop the conceptual foundation for decision support systems in the 1970’s, researched the development and implementation of executive information systems in the 1980’s, and for the past twenty years has specialized in data warehousing, BI, and analytics. He is a Fellow of the Association for Information Systems and The Data Warehousing Institute and is the Senior Editor of the
Business Intelligence Journal. He is also the founder and a Fellow of the Teradata University Network, a free portal for faculty and students who want to learn about data warehousing, BI/DSS, analytics, and database. For 20 years, Hugh was the consulting editor for John Wiley & Sons’ MIS series.
Copyright © 2019 by the Association for Information Systems. Permission to make digital or hard copies of all or part of this work for personal or classroom use is granted without fee provided that copies are not made or distributed for profit or commercial advantage and that copies bear this notice and full citation on the first page. Copyright for components of this work owned by others than the Association for Information Systems must be honored. Abstracting with credit is permitted. To copy otherwise, to republish, to post on servers, or to redistribute to lists requires prior specific permission and/or fee. Request permission to publish from: AIS Administrative Office, P.O. Box 2712 Atlanta, GA, 30301-2712 Attn: Reprints or via e-mail from [email protected].