SP DISCUSSION
PAPER
NO.9805
20048
The Hungarian
Pension
System
in Transition
Robert
Palacios
Roberto
Rocha
April 1998
ILrot
ton
LABOR MARKETS, PENSIONS SOCIAL ASSISTANCE
Public Disclosure Authorized
Public Disclosure Authorized
Public Disclosure Authorized
THE HUINGARIAN
PENSION SYSTEM IN TRANSITION
by
Robert Palacios and Roberto Rocha
*November 1997
* The authors are in the World Bank's country operations division for Central Europe and in the World Bank's Central European office in Budapest, respectively.
This paper reflects the authors' collaboration with the Hungarian pension reforn working group and with various consultants who have advised the working group during the preparation of the Hungarian reform. In particular, we would like to thank Patricio Arrau, Judit Ban, Rita Ban, Andrew Dilnot, Ferenc Dunai, Donald Duval, Peter Galambos, Istvan Gyorfi, Istvan Hamecz, Stefan Hepp, Konrad Nicklewicz, Rafael Rofman, Dimitri Vittas, Edward Whitehouse, and Patrick Wiese. Zoltan Vajda provided valuable research assistance.
Table of Contents
.A bs tract ... iv
I .Introduction ... I II. Performance of the Pension System in the Post War Period ... 2...2
The Maturation of the PAYG System ... 2
Pension Finances during the Transition to a Market Economy ...5
The Future of the PAYG Scheme in the Absence of reforms ... 12
III. The Quest for Pension Reform in Hungary ... 17
IV. The Hungarian Pension Reform ... 21
A General Description ... 21
Switching Strategies ... 25
Transition Strategies ... 26
Simulating the Fiscal Impact of the Multipillar Reform: The PAYG Reforms ... 28
Simulating the Fiscal Impact of the Multipillar Reform:Introducing the Second Pillar. 33 V. Tentative conclusions and Lessons for Other Transforming Economies ... 38
References ... 43
Annex 1: Description of the Hungarian Pension Reform Model ... 47
Background ... 47
The Fiscal or Aggregate Module ... 47
Demographic Subroutine ... 48
Expenditure Subroutine ... 48
The Revenue Subroutine ... 50
Modeling A Multi-Pillar System ... 50
The Individual Model ... 51
Annex 2: Analysis of the Opt-Out or Switching Decision ... 53
General Switching Analysis ... 53
Intemational Experience ... 54
The Switching Analysis in Hungary ... 55
Tables
Table 1. Maturation of the Hungarian Pension System, 1950-1995 ...3
Table 2. Public Pension Finances in Hungary during the Transition ...7
Table 3a. Decomposition of Pension Revenues in Hungary during the Transition ...9
Table 3b. Decomposition of Public Pension Expenditures in Hungary during the Transition ... 10
Table 4. Summary of Economic and Demographic Assumptions for Baseline Pension Projections, Hungary 1997-2050 ... 13
Table A.] Switching Model, Baseline Assumptions ... 56
Figures Figure 1. Payroll Tax Revenue vs. Pension and Health Expenditures, Hungary 1970-1995 ... 4
Figure 2. System vs Old Age Dependency Ratio, Hungary vs Selected Countries ...5
Figure 3a. Deficits in the Public Pension Scheme in the Absence of Reform. 1996-2050 ... 15
Figure3b. Old Age vs System Dependency Ratio in Absence of Reforms, 1996-2050 ... 15
Figure3c. Payroll Tax or Replacement Rate Required to Eliminate Deficits, 1996-2050 ... 17
Figure 4. Deficits in Public Pension Scheme with Original Reform Package, 1996-2050 ... 30
Figure 5. Deficits in Public Pension Scheme After Final Changes, 1996-2050 ... 31
Figure 6. Deficits in Public Pension Scheme Before and After Opt-out, 1996-2050 ... 34
Figure 7. Accumulation of Assets in Hungarian Private Pension System, 1998-2050 ... 36
Figure 8. Savings in the Hungarian Multipillar Pension System, 1998-2050 ... 37
Figure A. 1 Persons Opting into Funded System in the UK by Age and Sex ... 54
Figure A.2 Males Opting into Mixed Scheme in Argentina by Age ... 55
Figure A.3 Switching Decision for Average Hungarian Worker by Age in 1998 ... 57
Figure A.4 Switching Decision for Average Hungarian Worker by Age in 1998 ... 58
Abstract
After discussing the evolution of the policy dialogue in Hungary, the paper broadly describes the reform of the pay-as-you-go public pension system and its partial privatization as legislated in July 1997. Through a combination of a debt and tax financed transition, the first partial pension privatization in Central Europe is shown to generate increased national savings while placing the pension system on a more sustainable course. The potential positive impact on savings was diminished by politically-motivated compromises. Outstanding issues include problematic features of the "second pillar" and the reemergence of pay-as-you-go deficits in the long run. This suggests that further reforms, such as raising the retirement age beyond 62, will eventually be required.
I. Introduction
The Hungarian public pension system is a defined benefit scheme financed on a pay-as-you-go (PAYG) basis that has reached a high degree of maturation. Like PAYG schemes in many aging countries, the Hungarian pension system is characterized by high system dependency ratios, large expenditures relative to GDP, high contribution rates, and a precarious financial situation. In addition to the inevitable impact of demographic aging, the deterioration of pension finances in Hungary is also strongly related to policies prevailing under the socialist regime, such as a low retirement age, and to certain strategies followed during the transition to a market economy, such as the liberal use of disability pensions to ease transitional unemployment.
Despite very high payroll taxes and reductions in the average pension through manipulation of various indexation parameters. earmarked revenues have not covered expenditures in recent years. Expenditure pressures will intensify after the tum of the century, when dependency ratios are projected to increase significantly. Meanwhile, the scope for keeping these expenditures under control through ad-hoc adjustments to indexation parameters is narrowing. Explosive deficits could come sooner, if the high payroll tax rates and the diminishing confidence in the public PAYG scheme continue to drive economic activity into the informal sector, further eroding the tax base. A shrinking tax base and growing pension expenditures would result in either larger General Govemment deficits or higher payroll taxes. Neither outcome would be acceptable, given the Govemment's efforts to correct the large fiscal disequilibria of the early 1990s (7-8 percent to GDP), and to reduce the extremely high payroll tax rates, which constitute more than 40 percent of labor costs, defined as gross wages plus employer contributions.
The challenge for Hungary is to design and implement a pension reform capable of restoring long-run financial viability and reducing economic distortions while protecting the most vulnerable groups during the transition. In May 1996, the Hungarian Govemment announced its intention to take on this challenge by introducing a multipillar system in Hungary. The draft legislation was submitted to Parliament in May 1997, after one year of intense technical work and
discussions with the major social partners. The law was passed by Parliament in July 1997 and full implementation will begin during the first half of 1998. With this timetable, Hungary will be the first former socialist country to implement such a systemic change.
This paper examines the recent evolution of the Hungarian pension system and the reforrn proposal passed by the Hungarian Parliament in the summer of 1997. The paper is structured as
follows: The next section identifies the problems of the current PAYG system and presents long-run deficit projections in the absence of reform. The third section briefly examines the policy discussion surrounding the reform effort. The fourth section describes the reforrm program and presents an assessment of its medium and long-run economic impact. The fifth section concludes
and identifies preliminary lessons for other transforming socialist countries.
II. Performance of the Pension System in the Post War Period
The Maturation of the PAYG System
Hungary's PAYG system matured rapidly during the post-war period, as coverage expanded and the retirement age was reduced from its pre-war levels of 65/60 to 60/55 for men and women, respectively.1 Table I shows this maturation as reflected in the rapid increase of the system dependency ratio (the ratio of pensioners to workers), which surpassed the old age dependency ratio (the ratio of persons aged 60 and above to those aged 20-59) in the mid-1970s. The growing difference between the two ratios was partly due to the low retirement age of women, who comprised an increasing proportion of the pensioner population, and whose life expectancy at retirement rose from 20 to 23 years over the last three decades. Benefit levels also rose, driven both
by longer average contribution periods, as well as more generous benefits and more permissive eligibility rules. These developments, typical of PAYG schemes around the world, led to a steadily increasing ratio of pension spending to GDP (Figure 1).
Table 1
Maturation of the Hungarian Pension System, 1950-1995
Ratio of Ratio of Ratio of Ratio of
Pensioners Pensioners to Pension Persons aged 60+ Average Pension to
Year to Employed Age Population <' to those aged 20-59 Average Net Wage
(in %) (in %) (in %) (in %)
1950 12.9 39 21.2 21.5 1955 - 38 - 24.9 1960 15.2 43 25.9 32.4 1965 - 59 - 32.3 1970 26.4 56 32.2 34.4 1975 - 71 - 42.2 1980 35.8 83 30.6 55.5 1985 40.8 93 - 56.2 1990 46.1 105 35.9 66.1 1995 74.8 130 36.0 61.0
Notes: 1/ Pension age population refers to women over age 55 and men over 60. Sources: Bod (1995); Pension Insurance Fund (1996); Mitchell (1992).
According to Szalai (1991), the retirement age was reduced in 1944 but the war ended before the change took effect. However, the new Social Security Act retained the lower age limits.
It is difficult to assess the balance of the pension system during the post war period, as payroll tax revenues financed both pension and health expenditures, without any clear distinction between the two classes of expenditures within the overall social insurance budget. In the first two decades after the war there were years when revenues exceeded expenditures, even though payroll taxes were lower at that time. Between 1970s and 1983, payroll tax revenues were not sufficient to cover outlays on both health and pensions (Figure 1), suggesting that the PAYG system started experiencing deficits during that period. Payroll taxes were increased in the latter half of the 1980s allowing the social insurance budget to generate a surplus equivalent to 1 percent of GDP in 1989. Deficits returned in the early 1990s, however, as the pressures on the PAYG system increased again, with the start of Hungary's economic transformation.
Figure 1: Payroll Tax Revenue vs. Pension and
Health Expenditures, Hungary 1970-1995
2015
5 *0
1970 1975 1980 1985 1990 1991 1992 1993 1994 1995 Pension Expenditure Health Expenditure + Payroll TaxRevenues
0
Pension Finances during the Transition to a Market Economy
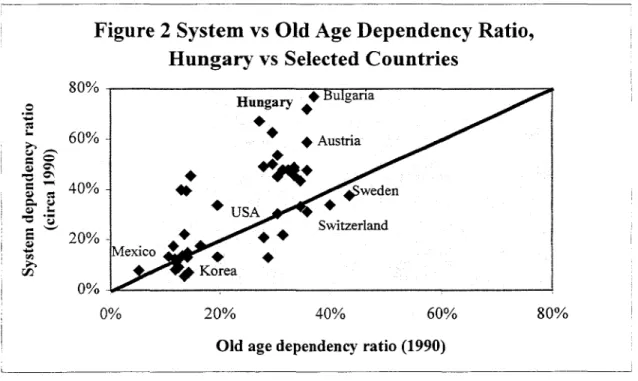
As in many former socialist countries, pressure on Hungarian pension finances took the form of a dramatic increase in the system dependency ratio between 1991 and 1995. This increase occurred despite a temporary pause in the demographic aging process, as indicated by the stability of the old age dependency ratio between 1990 and 1995 (Table 1). By 1995, the relationship between the old age dependency ratio and the system dependency ratio was among the most skewed in the world (Figure 2). Therefore, recent pressures on the pension system are not directly related to population aging, but to policies prevailing during Hungary's transition towards a market economy.
Figure 2 System vs Old Age Dependency Ratio,
Hungary vs Selected Countries
80% o0 Hungary
*
Bulgaria 660%
Austria
40^5=,
EAo%*USAA
*u
20% Switzerland IMexico
*
Korea 0% 0% 20% 40% 60% 80%Old age dependency ratio (1990)
Sources: World Bank (1994); Pension Insurance Fund (1996).
Specifically, the increase in the system dependency ratio was due to: (i) a reduction in labor force participation (which fell from 85 to 76 percent between 1990 and 1994), (ii) increased unemployment (which rose from nearly zero in 1990 to around 10 percent in 1994), and (iii) an
increase in the rate of new early retirement and disability claims; The abuse of the disability system was of particular importance, because it affected both the numerator and the denominator in the ratio. From 1985 to 1990, the rate of new disability claims in the non-agricultural sector averaged approximately 85 per ten thousand covered workers, whereas in 1995 this ratio had jumped to 160.
The exact impact of these shocks to the finances of the PAYG system is difficult to assess, despite the separation of the Pension and Health Insurance Funds (PIF and HIF, respectively) in
1992. This difficulty is due to the shift of certain pension spending outside the PIF budget (e.g., disability pensions for younger workers were shifted to the HIF and agricultural pensions were shifted to the State budget), a convoluted web of transfers between the central budget, the FHF and the PIF, and certain special revenue items in the PIF budget. The PIF itself has experienced deficits of around 0.3 percent of GDP since its creation despite charging payroll tax rates of 30.5 percent on gross wages.3
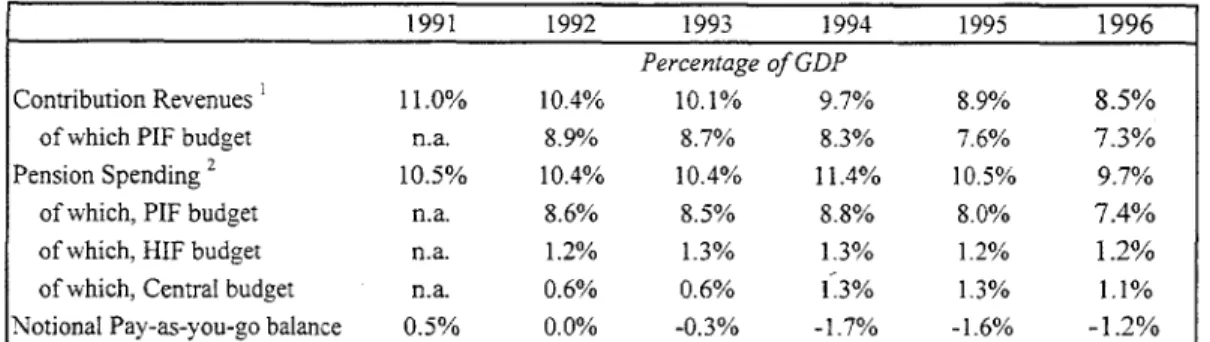
The overall deficit of the PAYG pension system (defined as the difference between all pension expenditures and contribution revenues) is significantly larger. As shown in Table 2, covering all pension expenditures in 1992 (including under-age disability pensions and agriculture pensions) would have required a notional contribution rate of 35.5 percent, or roughly 5 percentage points higher than the rate charged by the PIF. However, the revenues generated from this high notional contribution rate would have fallen short of covering total pension expenditures by approximately 1.5 percent of GDP between 1994 and 1996.
2 See OECD (1995) for a discussion of special early retirement programs between 1990 and 1993. The total tax on gross wages for health and pensions was 54 percent for most of the period. When the PIF and the HIF were established, the 54 percent rate was split in two parts--a rate of 30.5 (24.5/6 employer/employee) percent to finance the PIF and a rate of 23.5 percent (19.5/4 employer/employee) to finance the HIF. Adding the contributions to unemployment insurance payroll taxes represented 60 percent of the gross wage or more than 40 percent of labor costs, defined as gross wage plus employer contributions--among the highest in the world.
Table 2 Public Pension Finances in Hungary during the Transition
1991 1992 1993 1994 1995 1996
Percentage of GDP
Contribution Revenues ' 11.0% 10.4% 10.1% 9.7% 8.9% 8.5% of which PIF budget n.a. 8.9% 8.7% 8.3% 7.6% 7.3% Pension Spending2 10.5% 10.4% 10.4% 11.4% 10.5% 9.7% of which, PIF budget n.a. 8.6% 8.5% 8.8% 8.0% 7.4% of which, HIF budget n.a. 1.2% 1.3% 1.3% 1.2% 1.2% of which, Central budget n.a. 0.6% 0.6% 1.3% 1.3% 1.1% Notional Pay-as-you-go balance 0.5% 0.0% -0.3% -1.7% -1.6% -1.2% Notes:
1/ Payroll tax considered here is 35.5% which is the rate required to generate contribution revenues sufficient to cover all pension spending in 1992. Intragovemmental transfers on behalf of the unemployed and soldiers are ignored as are payments of penalties etc. The overall payroll tax for health and pensions was 53% in 1990/1991. This was raised to 54% (44% employer! 10% employee) in April of 1992.
2! Expenditures do not include administrative costs. 0
0 The financial performance of Hungarv's pension system can be examined further by
decomposing the ratios of revenues and expenditures to GDP into several components as shown in equations (1) and (2):
(I) Revenues = * Covered Wage Bill * Wage Bill * Labor Income
GDP Wage Bill Labor Income GDP
(2) Expenditures = Pensioners * Average Pension * Real Average Gross Wage * Employment GDP Employed Average Gross Wage Real GDP
In equation (1), a is the notional contribution rate that would have balanced all pension expenditures and contribution revenues in 1992, the year when the PIF was created. The covered wage bill is the share of the wage bill which is effectively captured to finance pension expenditures, whereas labor income is defined as the wage bill, social security contributions paid by the employer, and the labor share of mixed income (mostly self-employed individuals), all taken from national accounts data. GDP is measured at market prices. Equation (1) highlights the major components of
the base of the payroll tax, and thus enables the identification of the possible sources of erosion of the tax base.
Equation (2) enables the examination of the evolution of pension expenditures, relative to the size of the economy. Thus, for instance, an increase in the ratio of pensioners to employed workers (the system dependency ratio) increases the ratio of pension expenditures to GDP, but this
effect can be offset by a commensurate decrease in the ratio of employed workers to real GDP (an increase in labor productivity). Likewise, an increase in the ratio of the average pension to the average gross wage (a measure of the average replacement ratio) increases the ratio of pensions to GDP, but that can be offset by a reduction in the real average gross wage. Note that the average gross wage was constructed dividing the total wage bill by total employment, whereas the real average gross wage was constructed dividing the average gross wage by the GDP deflator. These two variables close the accounting identity in (2), although they differ from the more familiar average wage reported by the Central Statistical Office (CSO).
The components of the two accounting identities (I) and (2) were estimated for the 1991-96 period, which is the period for which consistent national accounts data were available. Total revenues were calculated using a contribution rate of 35.5 percent, which is the rate that would have balanced the PAYG system in 1992 (Table 2). Total expenditures include pension spending by the PIF, the HIF and the State budget. This construction provides a comprehensive view of pension revenues and expenditures at all levels of Govemment, and makes it possible to compare a consistent definition of pension spending through time.
The results, shown in Tables 3.a and 3.b, reveal several interesting trends. First, contribution revenues declined significantly as a share of GDP between 1991 and 1996. Table 3.a shows that this decline cannot be attributed only to problems in collecting contributions from formal sector employees, as the ratio of the covered wage bill to the wage bill was rather stable during the
4 The covered wage bill was estimated from information on contribution revenues and the contribution rate. This variable is estimated assuming that the labor share of mixed income is equal to the labor share of GDP excluding mixed income.
first half of the 1990s (until the decline in 1996). The absolute level of this indicator does, however, signal persistent problems with the contribution base, given that approximately one fourth of the wage bill seems to be untouched by the payroll tax. Most of the untaxed wage bill was due to arrears, exemptions of certain non-monetary forms of compensation and specific types of income, as well as the taxable earnings ceiling on employee contributions.
The second component is a rough proxy for the proportion of total labor income generated by employees of private firms in the formal sector and public sector employees. This ratio has fallen steadily, as shown in Table 3.a. The decline in the formal sector wage bill relative to total labor income can be largely explained by a shift of many workers to self-employment status, motivated in good part by attempts to minimize tax liabilities. While self-employed workers have to pay payroll taxes just like other workers, they also tend to underreport their income.
Table 3a Decomposition of Pension Revenues in Hungary during the Transition
Percentage of GDP
1991 1992 1993 1994 1995 1996 1996/91
Contribution Revenues/GDP 11.0% 10.4% 10.1% 9.7% 8.9% 8.4% 76.2%
Covered Wage Bill/Wage Bill 75.6% 75.2% 75.3% 77.0% 78.0% 73.1% 96.7%
Wage Bill / Total Labor Income 66.5% 63.2% 61.9% 62.2% 58.2% 58.3% 87.6%
Total Labor Income / GDP 61.4% 61.8% 60.9% 57.1% 55.1% 55.3% 90.1%
Payroll tax rate considered 35.5% 35.5% 35.5% 35.5% 35.5% 35.5%
Memo:
Wage Bill/GDP 40.8% 39.1% 37.7% 35.5% 32.1% 32.2%
Covered Wage Bill / GDP 30.9% 29.4% 28.4% 27.3% 25.1% 23.5% . 76.2%
Table 3 a also shows that the revenue decline was due to the overall contraction of the labor share of GDP which fell from 61.4 to 56.7 percent of GDP over the period. This decline was in good part due to falling labor force participation rates, which in turn was the product of increasing student enrollment ratios, disability, early retirement and fewer working pensioners. Another factor was unemployment which rose from a rate of 0.3 to 14 percent between 1990 and 1993 before
leveling off at 10 percent in 1995.6 In addition, the sharp decline in 1995 was largely due to restrictive wage policies introduced by the Government in the March 1995 stabilization prograrn--real average wages fell by more than 10 percent during that year.
0
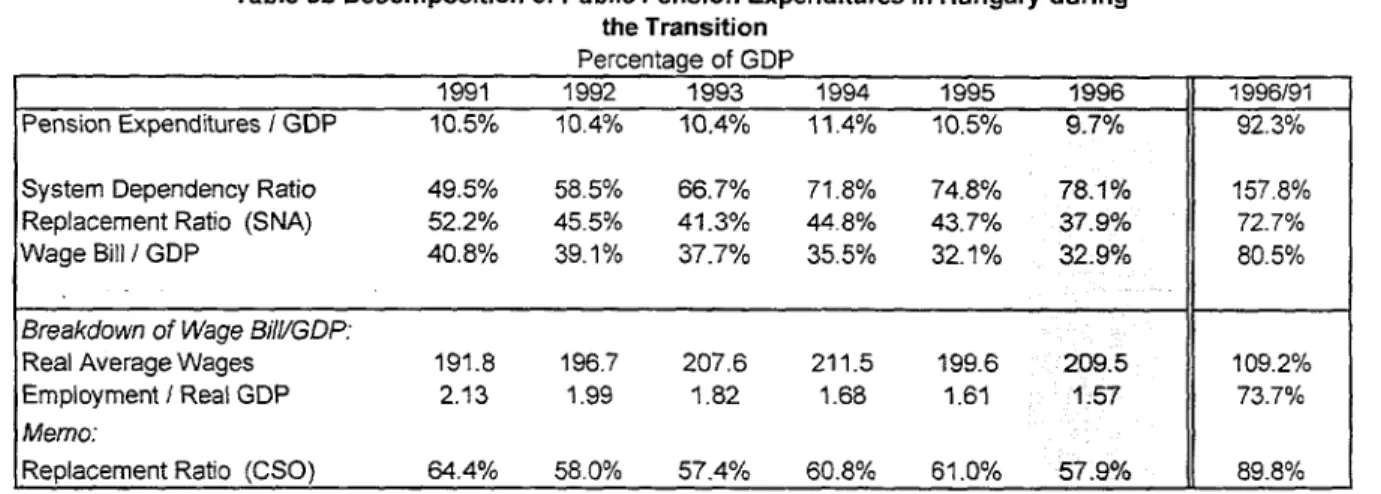
This steady decline in revenues was not matched by a similar fall on the expenditure side, however. The relative stability of the expenditure ratio was due neither to favorable demographic pattems nor to reforms of the pension system. On the contrary, despite favorable demographics, the system dependency ratio was allowed to increase precipitously during the period, as proposals to raise the retirement age and tighten disability requirements were largely ignored. As shown in Table 3.b, the jump in the system dependency ratio would have increased the ratio of pension expenditures to GDP by nearly 60 percent between 1991 and 1996, had it not been offset by other factors. This offset did occur however, as indicated by the decline in the replacement ratio, and in the ratio of employment to real GDP (i.e., the increase in labor productivity). During 1995, the real average wage also declined sharply, contributing to the decline in the ratio of expenditures to GDP. 0
Table 3b Decomposition of Public Pension Expenditures in Hungary during
the Transition Percentage of GDP
1991 1992 1993 1994 1995 1996 1996/91
Pension Expenditures I GDP 10.5% 10.4% 10.4% 11.4% 10.5% 9.7% 92.3%
System Dependency Ratio 49.5% 58.5% 66.7% 71.8% 74.8% 78.1% 157.8%
Replacement Ratio (SNA) 52.2% 45.5% 41.3% 44.8% 43.7% 37.9% 72.7%
Wage Bill / GDP 40.8% 39.1% 37.7% 35.5% 32.1% 32.9% 80.5%
Breakdown of Wage BilGDP:X
Real Average Wages 191.8 196.7 207.6 211.5 199.6 209.5 109.2%
Employment / Real GDP 2.13 1.99 1.82 1.68 1.61 1.57 73.7%
Memo:
Replacement Ratio (CSO) 64.4% 58.0% 57.4% 60.8% 61.0% 57.9% 89.8%
6 The growth of the informal sector during this period (estimated to have reached 30 percent of GDP) may
have also reduced total measured GDP and the labor share, as informnal activities tend to have a high labor
component.
The reduction in the average replacement ratio was largely due to the manipulation of three
key indexation parameters in the determination of pension benefits. First, the lack of full
actualization of past wage history in the benefit formula resulted in an erosion of real entry
pensions.7 Second, the brackets or bend points in the redistributive benefit formula were not fully
adjusted for wage growth, leading to a "reverse bracket creeping" effect. These two factors resulted in a sharp drop of entry level pensions, both in real terms and in relation to the average wage in the economy. Third, less than full indexation of pensions to gross wages also contributed to the reduction in the ratio of the average pension to the average gross wage. During this period, pensions were indexed to movements in the expected net average wage during the upcoming
calendar year. As it happened, the average pension failed to fully adjust to changes in net wages, ex-post, and fell even more relative to gross wages during the same period, because of the increase
in average personal income tax rates.
The decline in the ratio of employment to real GDP also helped stabilize the pension spending ratio, as shown in Table 3.b. From another angle, although the system dependency ratio increased by more than 50 percent between 1991 and 1996, the impact of such an increase was partly mitigated by the 35 percent gain in labor productivity (real GDP per employed worker) during the same period. Finally, although the increase in the real average gross wage exerted upward pressure on the spending ratio in some years, its sharp drop in 1995 contributed significantly to its decline in that year.
The fundamental role played by the manipulation of indexation parameters in maintaining the balance of the pension system is an important finding. It reveals the system's dependence on
high rates of inflation and ad hoc opaque indexation rules which have been perceived as arbitrary
and unfair by the Hungarian public.8 Whereas the scope for continued manipulation of indexation
parameters in this opaque fashion seems to be narrowing, further sharp increases in labor productivity are also unlikely, as most of the shedding of excess labor has already taken place.
7 The annual wage history since 1988 is taken into account for the determination of new pensions, but wages
are only revalued to take into account wage growth up until two years before retirement. Interestingly, this also seems to be the practice in the United States.
Therefore, in order to control expenditures, the Government needed to introduce more fundamental reforms to the pension system.
The Future of the PAYG Scheme in the Absence of Reforms
As mentioned before, pension finances deteriorated significantly during the early 1990s, despite favorable demographic developments. Along with the rest of Europe, Hungary will experience rapid population aging in the next few decades, putting further stress on the PAYG system. Under current policies, this demographic pressure will lead to a situation in which one worker will have to support one pensioner by the year 2035. Therefore, it is essential to assess the potential impact of such a deterioration in fundamentals on the finances of the Hungarian pension system. This assessment was made through the use of an actuarial model developed as part of the reform (described in more detail in Appendix 1).
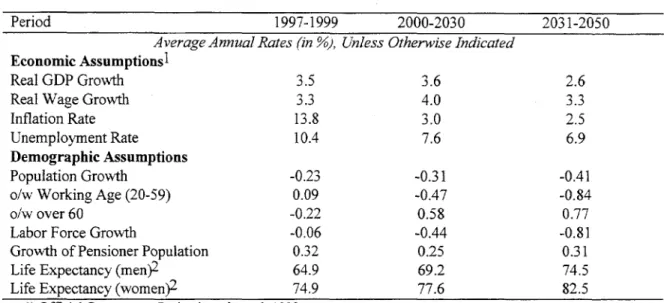
The main economic and demographic assumptions underlying the actuarial projections are shown in Table 4. Official Government projections of the main economic variables are used for the first three years (1997-99). After 1999, GDP and wage growth are consistent with convergence with Austrian per capita income levels around 2030, assuming Austrian real GDP growth rates of approximately 1.5 percent p.a..9 Real wages are projected to grow in line with increases in productivity, implying a stable labor share in GDP, and real wages growing slightly faster than GDP (due to the projected decline in the working age population). Inflation is assumed to drop rapidly and then to stabilize at about 3 percent p.a. after the year 2000, reflecting convergence with Western European rates of inflation. The unemployment rate is assumed to fall very gradually and to stabilize at around 6 percent by the end of the projection period. While the baseline demographic projections (elaborated by Hablicsek (1995)) imply a significant increase in the old age dependency ratio, the actual number of contributors to the pension system is determined by demographics as well as labor force participation rates. The latter are assumed to remain roughly constant after 1995 given that an exogenous recovery in formal sector participation rates is rather improbable in the
For a description of these arbitrary effects, see Kalmanne et. al., (1996) and Simonovits (1997).
absence of a well-designed package of reforms (including, inter alia, a higher retirement age, disability reform, lower payroll taxes).
Table 4 Summary of Economic and Demographic Assumptions for
Baseline Pension Projections, Hungary 1997-2050
Period 1997-1999 2000-2030 2031-2050
Average Annual Rates (in o), Unless Otherwise Indicated Economic Assumptionsl
Real GDP Growth 3.5 3.6 2.6
Real Wage Growth 3.3 4.0 3.3
Inflation Rate 13.8 3.0 2.5
Unemployment Rate 10.4 7.6 6.9
Demographic Assumptions
Population Growth -0.23 -0.31 -0.41
o/w Working Age (20-59) 0.09 -0.47 -0.84
o/w over 60 -0.22 0.58 0.77
Labor Force Growth -0.06 -0.44 -0.81
Growth of Pensioner Population 0.32 0.25 0.31
Life Expectancy (men)2 64.9 69.2 74.5
Life Expectancy (women)2 74.9 77.6 82.5
1\ Official Goverunent Projections through 1999
2\ Years at birth
Projected pension expenditures include old age, disability and survivors pensions.lO Projected revenues include contributions from employed workers (the sum of employer and
employee contributions), and those made by the Government on behalf of the unemployed, while excluding late payments, collection of arrears and other non-recurrent items. The base year is 1995 and the model is calibrated to exactly match actual expenditures in 1996. Furthermore, the baseline contribution rate used in the projections - 35.5 percent, is chosen in such a way as to generate contribution revenues sufficient to cover 1996 expenditures as defined here.
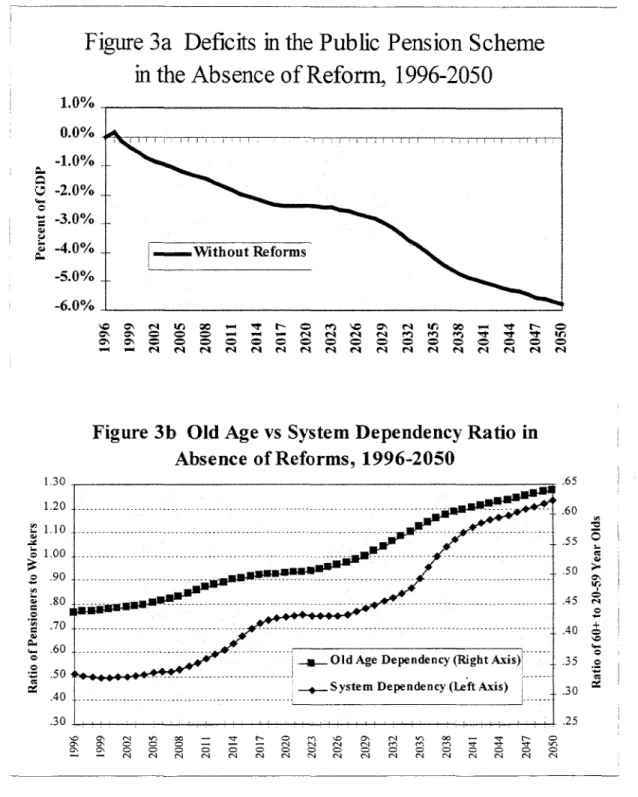
Under these demographic and economic assumptions, and in the absence of reforms, the Hungarian PAYG system would generate growing deficits, as show-n in Figure 3.a. The deficits The GDP growth rates in Table 4 are lower than those experienced by Hungary between 1950 and 1989 when growth averaged more than 4 percent p.a. (Augustinovics 1993).
would increase to around 2 percent by the end of next decade, and would be close to 6 percent of GDP in 2050, the end of the projection period. This result is essentially due to the assumption of a declining rate of inflation, and to adverse demographic trends. The decline in the rate of inflation assumed for the 1997-2005 period implies increasing real average pension benefits because of the backward indexation rule, and also increasing real entry pension benefits, because of the smaller inflation-related losses built into the benefit formula. The decline in inflation dominates the results in this first period -- if inflation remained constant at the 1996 levels, the deficit in 2005 would be around I percent of GDP lower than projected.
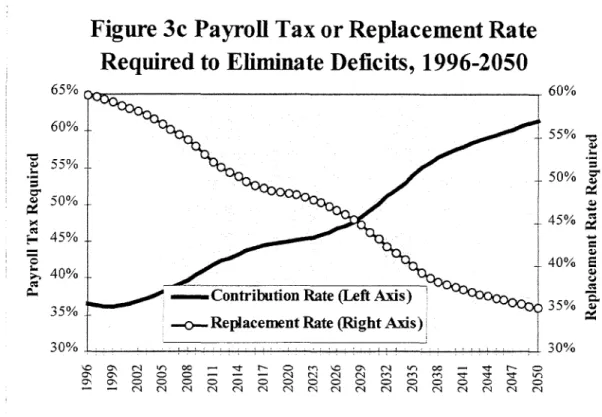
Whereas the decline in inflation and consequent increase in expenditures is the mror cause of the early deficits, demographic factors dominate the results after 2005. The projected fluctuations in the deficits as a share of GDP closely mirror the old age and system dependency ratios, as shown in Figure 3.b. Both ratios increase between 2005 and 2017, followed by a ten year period of stability, followed by another increase. The dramatic increase in the old age dependency ratio is from about 35 to 65 percent, while pensioners eventually outnumber contributors by about 20 percent. Note that the pension deficits would probably be larger than those presented in Figure 3.a., as the simulations assume that there would be no further erosion of the payroll tax base, either via outriaht infornality or underreporting of earnings.
'° Expenditures exclude items covered under the central budget and administrative costs. Including administrative costs would add 1-2 percent to total expenditures.
Figure 3a Deficits in the Public Pension Scheme
in the Absence of Reform, 1996-2050
1.0% 0.0% -1.0% 7 -2.0% W -3.0% ; -4.0% / - Without Reforms -5.0% -6.0% (' > 1( N ea 0s > (4 1f 00 -e0> NFigure 3b Old Age vs System Dependency Ratio in
Absence of Reforms, 1996-2050
1.30 .65 1 .1 0 - - - . . . . - - - - --- - - . . . -.55 1 .0 - - -- - - - ....- -... ... ... ... ... -- - - - . S... I ---... e ;it0 9o _ - - > .50 E5 870 --- - --- --- _ -_ --- ¢* ---Z -- --- - - 405 f W 60 ---.. ---.. ... --- °....50 Old Age Dependency (Right Axis) 35
. System Dependency (Left Axis)
.30 ., 25.. ,, .. ,. . so C N o ce - Nr r O r' 1) - N 0 01 0 ° ° - - - N N N c In c, .m -c, c 0 0 0 0 0 0 0 0 0 0 0 0 _ 0 0 0 - - <N s N N 4 N N CN N Nl N N N1 N Nq N N
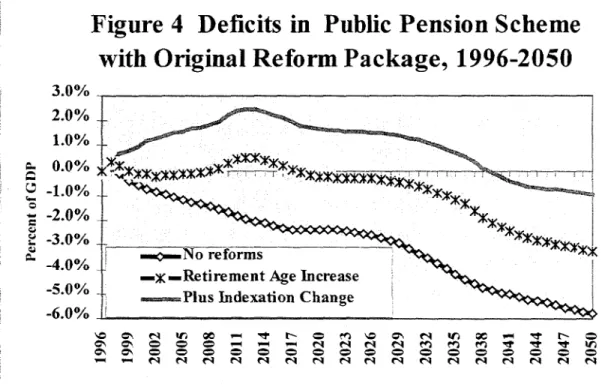
These pension deficits could be avoided by raising contribution rates or reducing benefits. In order to illustrate, Figure 3.b shows how these indicators would have to change if the system were to be balanced. Clearly the type of contribution rates shown here would trigger even greater labor market distortions than already exist, and such a proposal would be antithetical to the Government's current intentions to reduce labor costs. At the same time, the massive cuts in the average replacement rate required to balance the system could not be achieved without social unrest and increased poverty. In short, Figure 3a and 3b suggest that the system would either fail to keep
current pension promises or would do great harm to Hungary's economic performance.1 1 The
absence of reforms would also imply a massive burden on future generations, irrespective of whether the future imbalances were financed by higher contributions, lower replacement ratios, or general taxes.
'l It is very unlikely that private savings would increase so as to offset the increase in pension deficits. On
the contrary, private savings could actually decline in the long-run, due also to the aging of the population. See Auerbach et al (1989) for an analysis of four OECD countries, and Borsch-Supan (1985) for an analysis of the German case.
Figure 3c Payroll Tax or Replacement Rate
Required to Eliminate Deficits, 1996-2050
65% 60% 60% 55% X 55% p: 50% _ 45. EF 45% _ Ur} i W~~~~~~45 40% s , 40%
-o/ _Contribution Rate (Left Axis), 35%
35% °
--
Replacement Rate (Right Axis)30% 30% c1 C C N C m 00 - C Cfi oN o o C _ - - Cl3 Cl Cl Cl CN C-, t- os ' vN ON CN C° C C C O C C CD OC C C C C -Cl Cl ClCl C Cl l Cl C Cl C C"l C Cl4 Cl Cl4 Cl
m.
The Quest for Pension Reform in HungaryThe pressures on expenditures resulting from Hungary's economic transformation, the problems in revenue collection caused by excessive contribution rates, and the awareness of adverse demographic trends, led to a progressive recognition that the pension system had to be reformed. Reaching agreement on the best strategy for reformn has proven difficult, however. There was consensus among different agencies and scholars on some important issues such as the need to increase the retirement age, to tighten eligibility criteria (particularly for disability pensions), and to reduce contribution rates, but there was little agreement on anything else.
The most controversial and debated issue was whether the pension reform should focus on improving the PAYG, combined with tax incentives for the voluntary, third pillar, or whether
Hungary should also make an effort to introduce a mandatory second pillar. Other issues included the degree of income redistribution inside the pension system, and the system of indexation of pensions in progress. The debate frequently became populist, plagued by appeals for Hungary to avoid schemes that destroyed solidarity among generations, and to adopt an "European model", revealing a lack of knowledge or recognition of the variety of pension systems in Europe, especially the existence of large funded systems in a number of countries such as Switzerland, the Netherlands, Denmark, Ireland. and the UK.
The debate proceeded until the spring of 1996, when the Government finally decided to move ahead with a comprehensive pension reform, combining several changes in the PAYG and the introduction of a mandatory, fully-funded second pillar. This decision was reflected in a joint proposal of the Ministry of Welfare and the Ministry of Finance, outlining the main elements of the reform, and was presented to the Hungarian Parliament in the summer of 1996. The proposal indicated a program of preparatory technical work, and the creation of a 30-member working group to carry it out. The proposal also included a timetable of legislative work, whereby the new law would be submitted to Parliament by the end of the year, with expectation of adoption by Parliament a few months later. The Parliament endorsed the main elements of the proposal, while requesting more details before the submission of final draft legislation.
The factors that led the Govemment to commit to amultipillar system in mid 1996 are not entirely clear. Trade unions seemed divided or undecided, and the general public followed the
debate at a certain distance. The non-profit pension funds in the incipient third pillar were
ambivalent. Clearly, some govemment officials and Parliamentarians realized the growing crisis of credibility faced by the PAYG scheme and considered the multipillar solution as the one most likely
to produce permanent results. According to several Hungarian policymakers, the individual
measures required to keep pension finances under control - such as changing indexation - were more palatable in the context of a fundamental reform package. This view stemmed from an
12 The paper adopts the terminology proposed by the World Bank (Averting the Old Age Crisis, 1994),
whereby the first pillar refers to a PAYG, publicly-managed pillar, the second pillar is mandatory.
fully-funded, and privately-managed, and the third pillar is voluntary, also fully-fumded and privately-managed.
awareness of the public's growing frustration with the kind of temporary, ad hoc adjustments which had been used in recent years.
The draft legislation was submitted to Parliament in May of 1997, more than one year after the decision had been reached and six months later than the original target deadline. Throughout this period, the Pension Insurance Fund (PIF) remained opposed, attacking the reforrm in public debates with officials of the Ministries of Finance and Welfare and frequent interviews in the press. The PIF argued that the proposed changes to the PAYG would hurt pensioners and that the private component of the multipillar scheme would be too risky. Another concern, shared by some members of Parliament, was the possible adverse economic impact of the so-called transition
deficit, the deficit caused by the loss of revenues to the second pillar.
During the last quarter of 1996 and the first few months of 1997, a series of public meetings were held with trade unions, employer representatives, pensioners, academics, students, and many smaller groups (for example, one group represented families with many children) to discuss the pension reform. These debates seemed to have increased the general public's awareness of pension issues and the prospects of a systemic reform. According to one survey (TARKI 1997), more than sixty percent of the public had some information on the pension reform in November 1996. The same survey found that younger, educated Hungarians were more likely to favor the multipillar system while persons over 60 were more likely to disapprove of it. A follow-up survey in May 1997 showed 80 percent were aware of the reform and that the percentage which saw it as a positive step rose from 38 to 53 percent.
As a result of these public debates, the Government made some concessions, and the original draft legislation was modified. Anticipating the description of the pension reform (provided
in the next section), the most important changes to the original proposal were:
4)
the reduction inthe contribution rate to the second pillar from 10 to 8 percentage points with a commensurate increase in the size of the remaining first pillar; (ii) the delay in the introduction of the combined wage/price indexation until 2001; (iii) the increase in the number of service years credited to women bearing children; (iv) the possibility for university students to buy service years; and (v) new
guarantees for the overall replacement rate which would be received by pensioners in the mixed system. Several further modifications were made after the legislation was brought before Parliament. Most important amongst them were: (vi) the postponement of the introduction of the new benefit formula and taxation regime until 2013, (vii) an increase in widow's benefits for working women, (viii) the elimination of age restrictions with regard to the voluntary opt-out, and (ix) and a slight increase in the value of the guarantee in the second pillar.
Although most of the changes above tended to weaken the savings effect of the reform package, during Parliamentary debate there were also a few changes which improved fiscal sustainability. The most important of these was the modification to the retirement age schedule after 2009, which raised the number of years needed for early retirement from 33 to 37 and the earliest age of retirement from 57 to 59. The fact that the period of Parliamentary debate did not involve more dramatic changes reflects the fact that most of the compromises had already been made, first between the MoW and MoF positions, and later between the Government and the special interest groups. 13
The time and effort devoted to this political process delayed much of the work required to implement the system according to the original target date of January 1, 1998. By October, regulatory decrees had been issued and the licensing of private pension funds had begun. At the same time, an extensive information campaign was just getting under way. While the work in these areas will have to be intense, the most difficult aspect of implementation may be the creation of the new information technology and infrastructure which are needed to drive the system. With elections coming in late Spring, the Government will have to make a special effort to ensure that this historic reform gets off to a smooth start during the first quarter of 1998.
The average age of Parliamentarians in Hungary is around 50. The average age of "yes" voters was approximately 48 compared to an average age of 57 for "no" voters. Available data show that even after taking into account party affiliations, older Parliamentarians were more likely to vote against the reform than younger members.
IV. The Hungarian Pension Reform
A4 General Description
The Government submitted a proposal to Parliament which would have given workers under the age of 47 the choice to stay in a reformed PAYG or to switch to a new, multipillar pension system in 1998. New entrants in the labor force would automatically belong in the mixed system. After challenges in the Constitutional Court however, the arbitrary cutoff line was dropped and the final legislation allowed all workers the choice to move to the mixed system. However, guarantees within the new system were provided only to workers who participated in the second pillar for at least 15 years (see below). The Government's information campaign also strongly advises older workers not to switch to the new scheme.
The mixed system will be mandatory for new entrants in the labor force as of July 1, 1998. Workers who have already acquired pension rights under the current system (and those who enter the labor market through July 1998) will have the option to stay in the reformed PAYG, or to switch to the new system. This choice will be available during the last quarter of 1997 and the second pillar will begin to receive contributions in January 1998. Workers will be given two years to exercise their right to switch to the new system--until August 31, 1999. Workers who initially opt for the new system will be able to return to the reformed PAYG until September 2000. After that date, workers will be permanently affiliated either with the reformed
PAYG or with the new system. 14
The reformed PAYG ("modemized" PAYG, in the Hungarian jargon) would include a higher normal retirement age of 62 for both men and women, changes in the benefit formula designed to gradually eliminate some of the redistributive elements in the formula, a new tax regime and a shift from net wage indexation to a combination price/wage indexation formula (50 percent
4 The decision to switch to the mixed system could be exercised beginning in September 1997 and by the
time of writing several thousand people had already done so. The first contributions to the second pillar will only begin to flow however, in January 1998.
net wages, 50 percent consumer prices). The new legislation includes detailed transition tables for the retirement age increase and corresponding early retirement penalties and a new set of accrual rates which apply to gross rather than net wage history. The retirement age begins to rise immediately but only reaches its new final state in the year 2009. The new indexation mechanism is fully implemented by 2001 while the new benefit formula and tax regime is in place by 2013. The minimum pension would be indexed in the same way as other pensions resulting in a gradual reduction in its value relative to the average wage. In its place, a social assistance program would emerge.
Many of the changes reflected the Government's position that redistribution should be removed from the pension scheme. This was based on the desire to tighten the link between contributions and benefits in order to improve compliance and, in the view of some of the reformers, the insurance characteristics in the system. The final outcome in terms of intragenerational redistribution and fiscal impact of shifting redistribution out of the public pension scheme will depend on various factors, such as how pensions are actually taxed in the future, the contribution structure and the extent to which social assistance replaces the current redistribution.
The essential difference between the multipillar pension system and the reformed PAYG scheme is that the former includes a mandatory second pillar which replaces a portion of the PAYG scheme. Workers who decide to stay in the reformed PAYG will continue having 30 percent of their gross wages channeled to the PAYG--the statutory rates will be 21 percent from the employer and 9 percent from the employee. Workers who switch to the new system will have 22 percent of their gross wages channeled to the PAYG and 8 percent channeled to their second pillar accounts--the statutory rates will be 21 percent from the employer (channeled to the PAYG), and 9 percent from the employee (of which 1 percent to the PAYG and 8 percent to the second pillar). 15
Is This contribution rate structure follows a two year transitional period. For those who switch to the new system, the employee contribution to the second pillar will be 6 percent in 1998, 7 percent in 1999 and 8 percent from 2000 onward. The overall contribution rate would remain unchanged as employer rates are reduced.
The first pillar of the multipillar system would apply the same rules as the reformed PAYG, including higher retirement age and minimum years of service and indexation arrangements. The benefit formula is scaled down in proportion with the size of the contribution rates. Therefore, a full career average income worker opting for the new system could expect a replacement ratio in the first pillar amounting to about 45 percent of the net average wage, equivalent to an annual accrual
rate of 1.22 percent.1 6 This accrual rate is roughly 74 percent of the 1.65 accrual rate which applies
for those workers who remain in the reformed PAYG scheme. This corresponds to the ratio of the contribution rate to the PAYG paid by workers who switch to the multipillar scheme to the contribution rate paid by workers who do not switch, namely 22/30. For those who switched to the new scheme, the 1.22 accrual rate applied for both past and future years of participation in the system, implying that anyone who switched would be effectively forfeiting approximately one quarter of their acquired rights in the process.
The mandatory contributions to the second pillar would be placed in pension funds legally structured along the lines of the existing third pillar--mutual benefit funds managed exclusively by their members. This is a Hungarian construction, differing from the trusts in the Anglo-Saxon countries (whose boards either consists of employer appointees, or have a split representation, as in Australia), or the Swiss foundations (whose boards contain employer and employee representatives
in equal proportions). The third pillar funds in Hungary frequently contain representatives from the companies or financial institutions that participated in the organization of the funds, but only to the extent that they are also members of the plan. The potential legal links between funds and the ;' sponsoring" institution (through the board members) seem weaker in Hungary than in Switzerland or the Anglo-Saxon countries insofar as ensuring accountability and appropriate incentives for prudent management.
The concem that the third pillar construction was not sufficiently robust to serve as the basis for the second pillar, led the Government to introduce some safeguards, including mandatory internal reserves equal to at least 0.5 percent of the stock of individual accounts, a 0.3 percent
16 Workers who became disabled during the accumulation period would have the choice of remaining in
contribution to a Guarantee Fund, and restrictions on internal asset management. Internal asset management would be allowed only if the pension fund was able to accumulate an additional layer of reserves by a prescribed date. Otherwise, pension funds will have to hire external asset managers. Pension funds would be responsible for the selection of the asset manager, the administration of the accounts, and for negotiating annuities with insurance companies for their members. Funds with at least 25,000 members were allowed to provide annuities themselves and the Supervisor could allow smaller funds to do so as well if they maintained appropriate reserves. Workers would choose their fund and would be allowed to switch one year after the start of the reform and twice a year thereafter. Workers who participated in the multipillar system but failed to choose a pension fund would be assigned to county level public entities created especially for this purpose. However, they would still be allowed to choose a private fund later.
The original proposal offered limited guarantees on second pillar accounts, but was modified in reaction to public debates. What emerged were two layers of protection which may present administrative and supervisory problems in the future. First, individuals participating in the second pillar will be entitled to annuities which are not less than 25 percent of the value of the first pillar pension. This guarantee is equivalent to around 93 percent of the pension which would have been received if the worker had remained in the pure PAYG scheme, and applies to workers with at least 15 years of participation in the new system. Because of the short accumulation period, the guarantee could be triggered for workers in their mid-forties who switch to the new scheme, although the amount required to meet this guarantee should not be significant. Aside from the creation of a contingent liability, the use of an individual guarantee may add to administrative costs, especially if the guarantee is frequently monitored by actuaries. Also, it is still not clear whether the newly created Guarantee Fund would have sufficient resources to cover the implied liabilities, or how the behavior of market participants may be affected by the very existence of the guarantee.
In addition, there is a type of relative rate of return guarantee loosely connected with the individual guarantee which provides the Supervisory authority with wide discretion toward setting the range of investment returns in a given period. In contrast to the relative rate of return guarantees they would receive full disability benefits, just as someone who remained in the PAYG system.
in Chile and Argentina, which are stated through transparent formulas, and attempt to protect
individuals against poorly performing funds rather than general capital market risks,1 7 the
Hungarian law does not set objective reference points for the performance of the sector. This design introduces an element of uncertainty in the market by allowing a great deal of discretion for the Supervisor. 1 8
Switching Strategies
In the original Government proposal, workers below the age of 40 would have been forced to join the mixed system, while older workers would be have been required to stay in the reformed PAYG scheme. As the reform effort progressed, however, it became apparent that a mandatory cut-off age would spark a constitutional battle over accrued rights and prove too costly to implement. These problems led the Government to make the reform mandatory only for new entrants to the labor market and voluntary for anyone with a contribution history under the old scheme. The Government decided early in the process to recognize accrued rights by granting compensatory pensions, as in the case of Argentina, and not by recognition bonds, as in the case of Chile, Peru and Colombia.
The rights earned under the old scheme would be recognized by applying the accrual rates of the new first pillar. Obviously, these rates are lower than those implied by the current formula, a policy made possible by the voluntary nature of the switching process. Younger workers would still choose the new scheme, because the compounded returns to second pillar accounts would result in higher pensions in the new scheme under reasonable assumptions. Therefore, the valuation of past contributions in the context of a voluntary switch allowed the Government a certain measure of control over the speed of the transition and the size of early transition deficits, as well as a reduction
See Iglesias and Acuna (1992), Superintendency of AFPs (1996). Vittas and Iglesias (1992), Vittas (1995
and 1996) and Rofinan (1995 and 1996) for descriptions of guarantees in the Chilean and Argentine systems.
At the time of writing, the Supervisory Agency was considering setting the reference return equal to the average return of a basket of long-term Govemment securities, and constructing an asymmetric band around the reference return--a minimum return 10 percent below the reference return, and a maximum return 30 percent above the reference return.
in the implicit debt. Based on reasonable assumptions, workers below ages 35-40 would find it attractive to switch under the accrued rights valuation chosen. Appendix 2 presents a more detailed examination of the switching decision.
The Government chose to target age cohorts younger than its original cut-off age of 40 after examining recent experiences in the UK and Argentina.19 In both cases, the number of workers
opting for the funded scheme was greater than anticipated, suggesting that the incentives were greater than necessary. This helped convince the Government that a conservative approach to the valuation of acquire rights was the correct strategy. By targeting a slightly lower age cohort, the Govermment expects to avoid a situation in which large numbers of older workers switch to the new scheme. At the same time, the Government recognized that part of the excess switching, especially in the UK, was due to "overselling", whereby an aggressive sales force convinced some older workers to switch when it may not have been to their advantage. The UEK experience suggested that strong supervision and good public information would be required during the transition. The Government is now mounting a public information campaign in the months leading up to implementation which includes local, interactive computer terminals and Internet Web sites, the first of which became accessible in June 1997.
Transition Strategies
The diversion of an 8 percent contribution rate from the PAYG to private, second pillar accounts, implies a loss of revenues for the PAYG scheme. This revenue loss is likely to amount to .8-1.3 percent of GDP in the early years of the reforn, depending on the number of workers opting for the new system. This figure would increase over time, due to coverage expansion in the new system, and would increase the public deficit in the absence of offsetting measures. The increase in the deficit would be roughly equivalent to the increase in private savings, implying unchanged national savings, abstracting from interest rate effects or other effects on private savings. The
' See Disney and Whitehouse (1992) and Whitehouse (1995) for an analysis of the opt-out experience in the United Kingdom, and Rofman (ibid) for a description of the Argentine experience. Whitehouse (1996) provides a switching analysis for Hungary. Holzmann (1997) presents a general framework.
reform would be primarily debt-financed, involving a replacement of explicit for implicit debt. The potential growth effects of this strategy would be very limited, and the burden of the transition would be shifted entirely to future generations (replicating the pattern of intergenerational distribution of the PAYG). In addition, the sharp increase in the official public deficit and in the explicit public debt could create complications for a country already making efforts to reduce its deficits and heavy debt burden -- the total public deficit has been reduced from more than 8 percent of GDP to around 4 percent of GDP in the last two years, and the consolidated public debt in 1997
amounted to 70 percent of GDP.2 0
Pure debt-financing of the transition was rejected by the Government, however, which viewed the reform as an opportunity to generate higher national savings and growth rates, and is aware that this objective implies more reliance on tax-financing (or expenditure reduction). At the same time, the Government was pressed to present a strategy that would not imply an excessive
burden on few cohorts. Whereas debt-finance would imply transferring the burden to future
generations, a pure tax-finance strategy would imply a heavier burden on the current generation. A reform which struck an intergenerational balance was required.
The pension reform package which was passed by Parliament relies on relatively more debt-financing in the first years of the reform, followed by relatively more -tax-financing in the next decade. This strategy would be implemented through a set of reforms in the PAYG that would gradually offset the deterioration due to demographic trends and produce some surpluses in the PAYG (before considering the effects of the opt out). These include the increase in retirement age, change in tax regime and the change in indexation rules. As shown in the next section, as these
20 It is not clear to what extent financial markets already factor in public pension liabilities which are not
reported in official statistics, although it is interesting to note that Hungary's credit rating improved in the months which followed passage of the pension reform legislation. While there is evidence that unfunded pension liabilities are reflected in the market's valuation of private firms, (Bulow, Morck, and Summers (1987)) this line of research has not been extended to the public sector. If the market fully recognizes the existence of these liabilities, the "transitional deficit" should not affect the government's cost of borrowing. There is growing awareness of the existence and magnitude of public pension liabilities, particularly in the context of the recent debate over European Monetary Union. Recent studies have quantified the pension debt for OECD (IMF (1995)), (OECD (1994)) and non-OECD countries (Kane and Palacios (1996)).
policies are implemented, the reform should produce a gradual increase in national savings over the next decade. The distribution of the burden across cohorts would also be more evenly distributed. This strategy resembles hypothetical simulations of transitions with mixed financing found in the
academic literature.2 1
Simulating the Fiscal Impact of theAMultipillar Reform: The PAYG Reforms
It is useful to present the simulations of the reforn in two stages. First, the impact of the various measures designed to improve the balance of the PAYG can be progressively assessed, and contrasted with the " no reform" scenario. Second, the direct fiscal impact of the introduction of the second pillar can be examined, in combination with reforms of the PAYG. The macroeconomic assumptions used are the same as those described in Table 4 with the exception of a slightly higher growth rate of the labor force in the scenarios which include an increase in the retirement age.
The reforms of the PAYG scheme include a complex set of changes to the benefit formula. One important change is a shift from a net to a gross wage assessment base in 2013. The shift to gross wages as the base for calculating new pensions is accompanied by the introduction of an EET tax treatment where contributions and investment returns on private pension savings are exempt from the personal income tax while benefits are subject to taxation, albeit with a tax credit. Based on conservative assumptions regarding taxation of benefits, the combined impact of these changes is neutral with respect to the average net pension in the system. In other words, these changes do not affect the deficits projected in Figure 3a above.
However, the introduction of a 25 percent tax credit for employee contributions, (which is meant to approximate the exemption provided in an EET environment) has an immediate impact. The loss in personal income tax (PIT) revenues is roughly 0.4 percent of GDP every year. This
21 Kotlikoff (1995) simulates a reform involving full debt-finance in the first five years of the transition, and
tax-finance thereafter. Such a strategy would not diminish the lifetime utility of current cohorts and would increase the lifetime utility of future cohorts. It should be noted that the model utilized (the Auerbach-Kotlikoff model) is a model of exogenous growth that may underestimate the growth effects of the reform, and the impact of higher growth on the welfare of current and future generations. Corsetti and Schmidt-Hebbel (1995) examine the possible growth effects of a pension reform under an endogenous growth model.
measure was clearly part of the overall pension reform package and would have led, ceteris paribus, to a higher deficit. However, the loss of approximately 0.4 percent of GDP was absorbed into the overall budgetary plan and offset with reductions in other public expenditures. In light of this policy, the effect is not incorporated into the projection results.
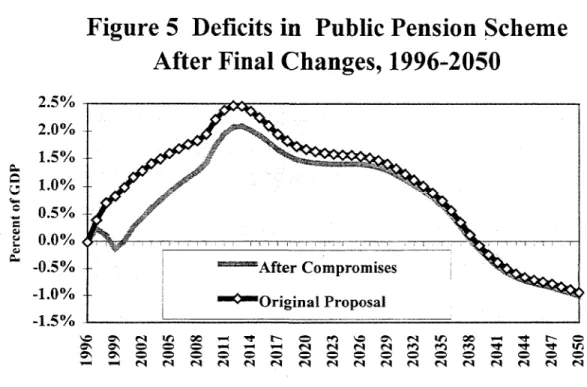
The changes in the benefit formula and the tax treatment have little or no impact on the fiscal situation. In contrast, the two most important reform measures, the increase in the retirement age and the shift toward mixed indexation, have a major impact as shown in Figure 4 below. The deficit reduction generated by the gradual increase of the retirement age is the distance between the bottom and the middle lines (with asterisks). This is due partly to the increase in the statutory normal and early retirement ages over time and partly to the increase in the number of years required to take early retirement. After 2008, the minimum number of years required to retire at age 59 rises to 37, although penalties are applied. Meanwhile, retirement at age 62 without any penalty is possible only after 40 years of contributions (or equivalent credits) in the system. While it is difficult to predict retirement behavior in the face of the new penalties or the average number of contribution years future new pensioners will have accumulated, reasonable assumptions suggest an increase in the effective retirement age for men and women of roughly 2 and 5 years respectively. The longer working period raises pensions given the positive accrual rate schedule but the higher pension is received for fewer years and some individuals continue to contribute to the scheme. The net effect is an average annual reduction in future deficits of about 1.5 percent of GDP.
While the retirement age increase has an important impact, it is only when the new indexation method is added to the reform package that the balance of the PAYG moves into an extended period of surplus. Figure 4 shows the impact of the original indexation proposal in which pensions in progress were to be indexed to an evenly weighted average of price and wage growth beginning in 1998. The top line shows how these surpluses peak in 2013. After this, the baby boom cohorts whose retirement was delayed by the last increase in the retirement age begin to retire. Later, deficits reemerge when a second demographic shock hits the PAYG scheme around 2035. With an increase in life expectancy of two years per decade assumed, the retirement age
retirement duration in the very long run. It must be stressed that the savings generated by the indexation measure rely on the growth of real wages.
Figure 4 Deficits in Public Pension Scheme
with Original Reform Package, 1996-2050
3.0% 2.0% X 1.0%
}
0.0% _ -1.0% -2.0% -3.0% _________________ -4i d.0% 'I No reforms-3.0% _ - =PIus Idexation
Change
!o
o
-6.0%
'D¢>t '*R Xc - It O e CC II Itt- I O
t~~~ - es~ es > s>N666
The top line in Figure 4 can be interpreted as the surplus which would have been created by the original reform package. However, as noted earlier, the original Government proposal was modified in several ways which led to a reduction in savings, especially in the short run. Figure 5 shows the effect of the two most costly compromises, namely, the increase in widow's benefits and the delay of the indexation change. Previously, survivors (mostly women) who had acquired their own pensions were not eligible for survivor pensions unless they forfeited their own retirement pensions. After the reform, survivors would receive would receive 20 percent of their spouse's pension in addition to their own pension. Moreover, the increase was retroactively applied resulting in a sudden jump of around 20 percent in the pensions of most widows.
Even more important however, was the compromise on the indexation of pensions in 1998-2000 negotiated between the Government and major interest groups and slightly modified in
Parliament. Rather than the savings which would have resulted in the original proposal, the compromise indexed 1998 and 1999 pensions by net wage growth in 1997 and 1998 respectively. Assuming that inflation declines as expected, this backward indexation locked in large real pension increases in these years.
Figure 5 Deficits in Public Pension Scheme
After Final Changes, 1996-2050
2.5% 2.0%
1
1.5% 1.0% 0.5% 0.0%__ _ _ _ _ _ _ _ _ _ _ _ _ _ _ _ _ *0.5% 'After Compromises -1.0/ Original Proposal -1.5% MO ON O00- - es V # 0 e ' n t-ieas C'i = o o oA o" oen oooo
ON ON 0000 0 es 0 0 0 0 0 e0 es0 es
The impact of those two measures amounts to between 0.5-1.0 percent of GDP during the first years of the transition. In present value terms, the reduction in the implicit pension debt was about 15 percent of GDP less than it would have been if the original package had been achieved. It should be noted that the decision to was made in response to pressures to compensate for the decline in real pensions in the two years preceding the reform, and implies a large increase (6 percent) in real average pensions at the beginning of 1998, just five months before Parliamentary elections. The pattern is reminiscent of the earlier increase in 1994 average pensions just prior to the last major elections (see Table 2 above). In other words, it is difficult to assess the causal relationship between
the overall reformn package and the real pension increases of 1998-1999. 22 Whatever the case, it is clear that the political compromises focused on the very short term and that the discount rate for political calculations was high.
The final PAYG reform measures as shown in Figure 5 provide the starting point for the analysis of the introduction of the second pillar. To this point, the package results in a significant improvement in the finances of the PAYG during the next decade, followed by a gradual erosion of the surpluses at the enid of the following decade. The pension system would record deficits again at the end of the projection period, and the elimination of these deficits would require further reforms of the PAYG, such as a further increase in retirement age (say to 65 years as in most OECD countries) or the adoption of price indexation. Nevertheless, the reform measures achieved a significant reduction in future deficits and the implicit pension debt. In fact, the reforms pr