econ
stor
www.econstor.eu
Der Open-Access-Publikationsserver der ZBW – Leibniz-Informationszentrum Wirtschaft The Open Access Publication Server of the ZBW – Leibniz Information Centre for Economics
Nutzungsbedingungen:
Die ZBW räumt Ihnen als Nutzerin/Nutzer das unentgeltliche, räumlich unbeschränkte und zeitlich auf die Dauer des Schutzrechts beschränkte einfache Recht ein, das ausgewählte Werk im Rahmen der unter
→ http://www.econstor.eu/dspace/Nutzungsbedingungen nachzulesenden vollständigen Nutzungsbedingungen zu vervielfältigen, mit denen die Nutzerin/der Nutzer sich durch die erste Nutzung einverstanden erklärt.
Terms of use:
The ZBW grants you, the user, the non-exclusive right to use the selected work free of charge, territorially unrestricted and within the time limit of the term of the property rights according to the terms specified at
→ http://www.econstor.eu/dspace/Nutzungsbedingungen By the first use of the selected work the user agrees and declares to comply with these terms of use.
de Haan, Jakob; Berger, Helge; Jansen, David-Jan
Working Paper
The end of stability and growth pact?
School of Business & Economics Discussion Paper: Economics, No. 2003/16
Provided in cooperation with:
Freie Universität Berlin
Suggested citation: de Haan, Jakob; Berger, Helge; Jansen, David-Jan (2003) : The end of stability and growth pact?, School of Business & Economics Discussion Paper: Economics, No. 2003/16, http://hdl.handle.net/10419/49909
Diskussionsbeiträge
des Fachbereichs Wirtschaftswissenschaft
der Freien Universität Berlin
Nr. 2003/16
VOLKSWIRTSCHAFTLICHE REIHE
The End of Stability and Growth Pact?
Jacob de Haan, Helge Berger and David-Jan Jansen
The End of the Stability and Growth Pact?
Jakob de Haan*, Helge Berger** and David -Jan Jansen***
* University of Groningen, The Netherlands, Free University Berlin (Bundesbank chair), Germany and CESifo, Munich, Germany
** Free University Berlin, Germany and CESifo, Munich, Germany *** De Nederlandsche Bank, The Netherlands
Abstract
This paper evaluates the Stability and Growth Pact. After examining the rules in place and the experience so far, the Pact is analysed from a political economy perspective, focusing on the choice for so-called soft law and drawing inferences from characteristics of successful fiscal rules at the state level in the United States. It is also examined whether big and small countries are likely to adhere to fiscal policy rules in place. Furthermore, the impact of the business cycle on fiscal policy outcomes is analysed. Finally, the proposals of the European Commission to strengthen the Pact are discussed.
Key words: Stability and Growth Pact, EMU, budget discipline JEL code: E61, E63
Views expressed are those of the individual authors and do not necessarily reflect official positions of De Nederlandsche Bank. We like to thank Ken Kuttner and other participants in the workshop “New institutions for a New Europe” (Institute for Advanced Studies, Vienna, 10-11 October, 2003) for their comments on a previous version of this paper. Corresponding author: Jakob de Haan, Department of Economics, University of Groningen, PO Box 800, 9700 AV Groningen, The Netherlands; email:
“The experience of the early years of EMU shows that the large countries in particular regard the fiscal framework as a straightjacket for their fiscal policies. There is now a serious risk that the Stability and Growth Pact will, in the end, cause the opposite of what it intended: When the large EMU countries finally decide not to accept the perceived straightjacket any longer and ignore the rules, the common currency will be left with less instead of more protection against fiscal profligacies” (Von Hagen, 2003, p. 7).
1. Introduction
The fiscal policy framework of the Economic and Monetary Union (EMU) aims at combining budgetary discipline with flexibility. The Maastricht Treaty stipulates that member states should avoid so-called excessive deficits (measured against reference values of 3% of GDP for the general government budget deficit and 60% for the general government debt-to-GDP ratio). According to the Stability and Growth Pact (SGP), member states should achieve and maintain a budgetary position ‘close to balance or in surplus’ in the medium term. Compliance with these rules implies fiscal discipline, while at the same time providing the necessary room for using automatic stabilisers.
In 2002 the budgetary position of various countries in the euro area deteriorated. The actual budget deficit in the euro area reached 2.2% of GDP. Especially the budgetary positions of Germany, France, Italy, and Portugal remained weak, with deficits ranging from 2.3% of GDP for Italy to 3.6% in Germany. The European Commission (2003) forecasts that these countries will have deficits above the 3% of GDP reference value in 2003 and/or 2004. As a result of their budgetary imbalances, the ECOFIN Council has placed France, Germany and Portugal in an excessive deficit procedure. At the same time, Italy, Belgium, and Greece continue to have debt ratios above 100% of GDP.
The European restrictions on national fiscal policy have never been very popular among academic economists. And now that the rules are getting to bite, various observers have argued that it may be time to abolish them all together, or at least to apply them not in a very strict way. The rules currently in place were instituted in a specific historic situation. At the time, there was an urgent need for reversing the trend of rapidly accumulating government debt and to quickly establish credibility for the new currency in its initial phase. Now that the monetary union has proved to be successful, it might be possible to refine the fiscal rules. According to opponents of the current EU rules, they mainly reflect a desire to enhance fiscal discipline, thereby hampering the use of fiscal policy for stabilisation purposes in an inappropriate way.
As follows from the citation of Von Hagen (2003), various observers expect that the current problems may be the prelude to the end of the SGP. Whether the SGP will in the end survive depends on many factors. A first consideration is the effectiveness of the rules in place, which, in turn, depends on how binding these rules are and the incentives that member states have to adhere to non-binding regulations. A second factor is the impact that an economic downturn will have on governments’ budget deficits. The stronger the impact of the cycle, the more likely it will be that governments will surpass
the critical level of the deficit, especially if they have not been able (or willing) to reduce the deficit in the upward phase of the cycle. The present paper analyses these issues.
The remainder of the paper is organized as follows. The next section examines the rules in place and the experience with these rules so far. In section three, the effectiveness of the SGP is analysed from a political economy perspective, focusing on the choice for so-called soft law and drawing inferences from characteristics of successful fiscal rules at the state level in the United States. Section four discusses the evidence on the impact of business cycles on governments’ budget deficits. In section five the proposals of the European Commission to enhance the SGP are discussed. The proposals, which have been largely accepted by the Council in its meeting of 7 March 20031, seek to make the EU fiscal rules more flexible through changes in the interpretation of the SGP and a greater reliance on discretionary judgements. Our conclusion is that the envisaged reform of the pact does little to redress the failure of some member states to consolidate their public finances in times of economic prosperity. If anything, our analysis suggests that the rules in place should become more instead of less strict.
2. The rules in place and the experience so far
2.1 SGP in practice
The SGP provides the details for multilateral surveillance and the excessive deficit procedure.2 It consists of two Council Regulations on the strengthening of the surveillance and co-ordination of budgetary positions3 and on speeding up and clarifying the implementation of the excessive deficit procedure4, tied together by a corresponding European Council Resolution.5 Regulation 1466/97 sets out to strengthen multilateral surveillance and gives member states a goal of a medium term budgetary position of close to balance or in surplus. Regulation 1467/97 clarifies and accelerates the excessive deficit procedure so that within 10 months non- interest bearing deposits and ultimately fines can be imposed in case the member state concerned takes no effective actions to redress fiscal imbalances.
Member states of the euro area have to present so-called stability programmes, which have to be updated annually. Issues covered by the programmes include the adjustment path for the general government deficit towards the medium-term objective of close to balance or in surplus and the expected general government debt ratio on an annual basis. In addition to the preceding and current year, this information has to cover at least the following three years.
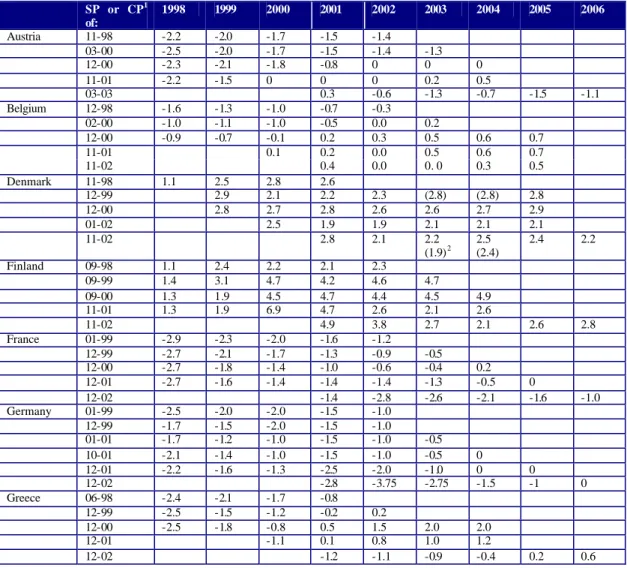
As many countries entered the monetary union with deficits close to 3 per cent, a further budgetary adjustment in the early years of EMU was needed to move to close-to-balance positions. Table 1 summarises the proclaimed medium term objectives for the budget balance in the stability (and convergence) programmes. It follows from Table 1
1
ECOFIN, Press release, 6877/03, pp. 15-16.
2 This part of the paper heavily draws on Amtenbrink and De Haan (2003). 3 Council Regulation No. 1466/97, O.J. 1997, L209/1.
4 Council Regulation No. 1467/97, O.J. 1997, L 209/6. 5
Resolution of the European Council on the Stability and Growth Pact, Amsterdam, 17 June 1997, O.J. 1997, C 236/1. For an overview of the working of the Stability and Growth Pact, see Amtenbrink, De Haan and Sleijpen (1997).
that three groups of countries can be distinguished. First, there is a group of countries that already had a balanced budget at the beginning of the period under consideration. Helped by the favourable economic developments they managed to stick to the objective of a balanced budget or a surplus. Denmark, for instance, had a budget surplus during the entire period under consideration.
Second, various countries not only targeted for a balanced budget (or a surplus), but also realised it. A good example is Belgium, not a country known for its excellent track record when it comes to sound public finances. Still, it managed to bring back its deficit in a relatively short period.
Finally, a third group of countries did not manage to reduce their deficits and moved the years in which they aimed to have a balanced budget to the more distant future in their respective stability programmes. A good example is Germany. Early stability programmes foresaw a deficit of only 1 per cent in 2002. However, the stability programme of December 2001 aimed for a deficit of 2 per cent in 2002. According to the European Commission (2003), Germany had a deficit of 2.8% of GDP in 2002 (see Table 2).
Table 1. Objectives of stability and convergenc e programmes: budget balance
SP or CP1 of: 1998 1999 2000 2001 2002 2003 2004 2005 2006 Austria 11-98 -2.2 -2.0 -1.7 -1.5 -1.4 03-00 -2.5 -2.0 -1.7 -1.5 -1.4 -1.3 12-00 -2.3 -2.1 -1.8 -0.8 0 0 0 11-01 -2.2 -1.5 0 0 0 0.2 0.5 03-03 0.3 -0.6 -1.3 -0.7 -1.5 -1.1 Belgium 12-98 -1.6 -1.3 -1.0 -0.7 -0.3 02-00 -1.0 -1.1 -1.0 -0.5 0.0 0.2 12-00 -0.9 -0.7 -0.1 0.2 0.3 0.5 0.6 0.7 11-01 0.1 0.2 0.0 0.5 0.6 0.7 11-02 0.4 0.0 0. 0 0.3 0.5 Denmark 11-98 1.1 2.5 2.8 2.6 12-99 2.9 2.1 2.2 2.3 (2.8) (2.8) 2.8 12-00 2.8 2.7 2.8 2.6 2.6 2.7 2.9 01-02 2.5 1.9 1.9 2.1 2.1 2.1 11-02 2.8 2.1 2.2 (1.9)2 2.5 (2.4) 2.4 2.2 Finland 09-98 1.1 2.4 2.2 2.1 2.3 09-99 1.4 3.1 4.7 4.2 4.6 4.7 09-00 1.3 1.9 4.5 4.7 4.4 4.5 4.9 11-01 1.3 1.9 6.9 4.7 2.6 2.1 2.6 11-02 4.9 3.8 2.7 2.1 2.6 2.8 France 01-99 -2.9 -2.3 -2.0 -1.6 -1.2 12-99 -2.7 -2.1 -1.7 -1.3 -0.9 -0.5 12-00 -2.7 -1.8 -1.4 -1.0 -0.6 -0.4 0.2 12-01 -2.7 -1.6 -1.4 -1.4 -1.4 -1.3 -0.5 0 12-02 -1.4 -2.8 -2.6 -2.1 -1.6 -1.0 Germany 01-99 -2.5 -2.0 -2.0 -1.5 -1.0 12-99 -1.7 -1.5 -2.0 -1.5 -1.0 01-01 -1.7 -1.2 -1.0 -1.5 -1.0 -0.5 10-01 -2.1 -1.4 -1.0 -1.5 -1.0 -0.5 0 12-01 -2.2 -1.6 -1.3 -2.5 -2.0 -1.0 0 0 12-02 -2.8 -3.75 -2.75 -1.5 -1 0 Greece 06-98 -2.4 -2.1 -1.7 -0.8 12-99 -2.5 -1.5 -1.2 -0.2 0.2 12-00 -2.5 -1.8 -0.8 0.5 1.5 2.0 2.0 12-01 -1.1 0.1 0.8 1.0 1.2 12-02 -1.2 -1.1 -0.9 -0.4 0.2 0.6
Table 1. (Concluded.) SP or CP1 of: 1998 1999 2000 2001 2002 2003 2004 2005 2006 Ireland 12-98 1.7 1.7 1.4 1. 6 12-99 2.1 1.4 1.2 2.5 2.6 12-00 2.1 3.9 4.7 4.3 3.8 4.6 12-01 4.5 1.4 0.7 -0.5 -0.6 12-02 1.6 -0.3 -0.7 -1.2 -1.2 Italy 12-98 -2.6 -2.0 -1.5 -1.0 12-99 -2.7 -2.0 -1.5 -1.0 -0.6 -0.1 12-00 -2.8 -1.9 -1.3 -0.8 -0.5 0 0.3 11-01 -1.5 -1.1 -0.5 0 0 0.2 11-02 -2.2 -2.1 -1.5 -0.6 -0.2 0.1 Luxembourg 02-99 2.1 1.1 1.2 1.3 1.7 03-00 2.6 2.3 2.5 2.6 2.9 3.1 12-00 3.0 2.6 2.5 2.5 11-01 6.2 4.1 2.8 3.1 3.4 01-03 6.1 -0.3 -0.3 -0.7 -0.1 Netherlands 11-98 -1.3 -1.3 -1.1 11-99 -0.8 -0.6 -0.6 -1.3 -1.1 09-00 1.0 1.0 0.7 0.25 0.25 0.25 10-01 1.5 1.0 1.0 1.0 1.0 1.0 12-02 0.1 -0.7 -1.0 -0.7 -0.4 0.1 Portugal 12-98 -2.0 -1.5 -1.2 -0.8 02-00 -2.1 -2.0 -1.5 -1.1 -0.7 -0.3 0 01-01 -2.3 -2.0 -1.9 -1.1 -0.7 -0.3 0 12-01 -2.2 -1.8 -1.0 0 0.4 01-03 -2.8 -2.4 -1.9 -1.1 -0.5 Spain 12-98 -1.9 -1.6 -1.0 -0.4 0.1 12-99 -2.3 -1.3 -0.8 -0.4 0.1 01-01 -1.1 -0.3 0 0.2 0.3 0.3 12-01 -0.3 0 0 0 0.1 0.2 ??-02 -0.1 -0.2 0.0 0.0 0.1 0.2 Sweden 12-98 1.5 0.3 1.6 2.5 11-99 2.3 1.7 2.1 2.0 2.0 12-00 1.9 1.9 3.4 3.5 2.0 2.0 11-01 4.1 4.6 2.1 2.2 2.3 11-02 3.7 4.8 1.7 1.5 1.6 2.0 UK 12-98 0.8 -0.3 -0.3 -0.1 0.2 0.1 12-99 0.5 0.4 0.2 0.2 0 -0.3 0.5 12-00 1.5 1.3 0.7 0.1 -0.7 -1.0 -1.1 12-01 2.0 -0.2 -1.1 -1.3 -1.1 -1.0 12-02 -0.2 -1.8 -2.2 -1.7 -1.6
1 SP = stability programme; CP = convergence programme. 2
Including revised information provided by Denmark in supplementary note. Source: EC, Public Finances in EMU, 2003.
Table 2. Budgetary positions of EU member states, 2001-2004
Budget balance (% GDP) Government debt (% GDP)
2001 2002 2003 2004 2001 2002 2003 2004 Austria 0.3 -0.6 -1.1 -0.4 67.3 68.7 68.5 66.8 Belgium 0.3 0.1 -0.2 -0.1 108.5 105.3 102.7 98.9 Denmark 2.8 2.0 1.8 2.1 45.4 45.2 42.7 39.9 Finland 5.1 4.7 3.3 3.0 43.8 42.7 42.3 41.4 France -1.6 -3.1 -3.7 -3.5 56.8 59.1 61.8 63.1 Germany -2.8 -3.6 -3.4 -2.9 59.5 60.8 62.7 63.0 Greece -1.9 -1.2 -1.1 -1.0 107.0 104.9 101.0 97.0 Ireland 1.2 -0.3 -0.6 -0.9 36.8 33.3 33.3 33.3 Italy -2.6 -2.3 -2.3 -3.1 109.5 106.7 106.0 104.7 Luxembourg 6.4 2.6 -0.2 -1.2 5.6 5.3 4.1 3.4 Netherlands 0.1 -1.1 -1.6 -2.4 52.8 52.6 52.4 52.8 Portugal -4.2 -2.7 -3.5 -3.2 55.6 58.1 59.4 60.2 Spain -0.1 -0.1 -0.4 -0.1 56.9 54.0 52.5 50.5 Sweden 4.5 1.3 0.8 1.2 54.4 52.6 50.9 49.5 UK 0.8 -1.3 -2.5 -2.5 38.9 38.4 39.0 39.8 Euro area -1.6 -2.2 -2.5 -2.4 69.2 69.2 69.9 69.6 EU15 -0.9 -1.9 -2.3 -2.2 62.9 62.7 63.5 63.2
Source: European Commission (2003)
In January 2002 the European Commission decided to recommend the ECOFIN Council to give Germany an early warning. At that time, the Commission forecasted a German deficit of 2.6% of GDP for 2001. The Commission also adopted a recommendation to give Portugal an early warning for having missed its target for the budget deficit for 2001 by a wide margin (see Table 3 for an overview). However, the ECOFIN Council in its meeting of 12 February 2002 did not endorse the recommendations of the Commission. The Council decided that the Commission recommendation for Germany would not be put to vote and to close the procedure, following strong political pressure from Germany. It did so even though in its formal opinion on the updated German stability programme the Council had come to the conclusion that ‘[…] if growth turns out lower than expected, there is a risk that the general government deficit in 2002 comes even closer to 3 per cent of GDP reference value than in 2001’.6 Likewise, the Council did not endorse the Commission recommendation for Portugal.
6
Table 3. Overview of decisions implementation Stability and Growth Pact
Date: Decision by: Decision:
30 January 2002 Commission Recommendation that early warning be send to Portugal for having missed its budget target for 2001 by wide margin; projected deficit for 2001 was 2.2% 30 January 2002 Commission Recommendation that early warning be send to
Germany as projected deficit for 2001 was 2.6% 12 February 2002 ECOFIN Council decided not to endorse the Commission recommendations and to close the early warning
procedure
16 October 2002 Commission Recommendation that excessive deficit exists in Portugal; deficit in 2001 4.1% and in the absence of the
rectifying budget, the 2002 deficit could have been above 3.5%
5 November 2002 ECOFIN Council decided that Portugal has excessive deficit; deficit in 2001 was revised to 4.1%
19 November 2002
Commission Recommendation to give early warning to France; Commission projected deficit of 2.7% (2002) and 2.9%
(2003)
8 January 2003 Commission Recommendation that excessive deficit exists in Germany
21 January 2003 ECOFIN Council decided that excessive deficit exists in Germany; deficit in 2002 was expected by Commission
to be 3.8%
21 January 2003 ECOFIN Council decided to give an early warning to France 7 May 2003 Commission Recommendation that excessive deficit exists in
France; in 2002 deficit is 3.1% and forecasted to be 3.7% in 2003
3 June 2003 ECOFIN Council decided that excessive deficit exists in France
It turned out, however, that the Commission was right after all. Despite their commitments, the German and Portuguese authorities failed to keep the deficit from exceeding the reference value. In July 2002 the Commission was informed by the Portuguese government that the deficit in 2001 was to be revised upward to 4.1% of GDP. “The size of this ex-post revision and the delay in its coming to light underlined serious deficiencies in the collection and processing of general government statistical data in Portugal.” (European Commission (2003, p. 45). In 2002 Portugal was able to reduce its deficit to 2.7% of GDP (see Table 2). However, the European Commission forecasts a deficit of 3.5 per cent in 2003.
On 21 January 2003 the ECOFIN adopted a recommendation giving an early warning to France. According to the European Commission (2003), the French
authorities failed to take corrective measures to address the growing budgetary imbalances. Consequently, the Council decided on 3 June 2003 that France has an excessive deficit. A deadline of 3 October 2003 was established for the French government to take appropriate measures. In line with the Commission proposal, the Council recommended “the French authorities to achieve a significantly larger improvement in the cyclically-adjusted deficit in 2003 than that currently planned” and “to implement measures ensuring that the cyclically-adjusted deficit is reduced in 2004 by 0.5% of GDP....to ensure that the nominal deficit will be below 3% in 2004 at the latest.” Interestingly, two Countries (Denmark and the Netherlands) voted against this decision. The latter even had its arguments made public, arguing that France should bring down its structural deficit by at least 0.5% of GDP in 2003.
On 21 October 2003, the Commission proposed to the Council the following recommendation: the French authorities shall achieve in 2004 an improvement in the cyclically -adjusted balance of one percentage point of GDP, which implies additional deficit reduction measures of around 0.4% of GDP. This would, according to the Commission, allow to catch up in 2004 for the lack of adjustment in 2003 and to set a credible basis for bringing the deficit below 3.0% of GDP in 2005. In 2005, the French authorities have to achieve an adjustment in the cyclically adjusted deficit of at least 0.5 percentage point of GDP or by a larger amount so as to ensure that the general government deficit is brought below 3% of GDP.7 In other words, the deadline for bringing down the deficit below the 3 per cent level will be postponed by another year if the Council accepts this proposal of the Commission. Earlier (on 8 October 2003), the Commission already had recommended to the Council to decide that France has not taken effective action in response to the Council recommendation. Even though the cyclically adjusted balance improves consistent with the minimum amount of 0.5-percentage point, the Commission considered this insufficient to ensure that the deficit will be below the 3 per cent level in 2004 as recommended by the Council.8
2.2 Same rule, but different behaviour
It is quite interesting that although the countries in the euro area all faced the same external constraint, their fiscal policy outcomes were so very different. Even though it is beyond the scope of the present paper to examine this issue in full, we will discuss two factors that have been suggested by Von Hagen (2003) that may be relevant in explaining at least part of the differences in policy outcomes across EMU countries, i.e. the size of the countries and the role of elections.
It follows from Table 4 that small and intermediate-sized states, i.e. states with a GDP less than two per cent of the EU GDP and between two and seven per cent of EU GDP have been more successful in bringing down their debt-to-GDP ratio after 1997 than large states (with a share in EU GDP exceeding 7 per cent).9 Table 4 also shows that between 1997 and 2002 the small member states had – on average – a surplus of 1 percent, whereas the large member states had a deficit of 1.5 percent. The intermediate-sized countries had – on average – a balanced budget. In section 3, where we discuss the
7
IP/03/1420. 8 IP/03/1353. 9
effectiveness of the rules in place, we will come back to the difference between small and large states.
Table 4. Average budget balance (% GDP) in different groups of EU member states, 1997-2002
Group: Average deficit: Change in debt ratio:
All EU countries -0.1 -10.3
Small EU countries 1.0 -10.6
Intermediate EU countries 0.0 -13.0
Large EU countries -1.5 -7.7
Source: own calculations based on OECD (2003)
Von Hagen (2003) argues that the SGP has not prevented member states from using fiscal policy to pursue electoral interests. As argued by Buti and Van den Noord (2003), unlike the Maastricht convergence, sticking to the rules of the SGP may not pay politically. Once in EMU, the carrot of entry has been eaten, while the stick of exclusion has been replaced by sanctions that may not bite after all (see section 3 for a further analysis). So governments may be tempted to use fiscal policy for re-election purposes. Indeed, Buti and Van den Noord (2003) and Von Hagen (2003) find that the fiscal policy stance in the member states was more expansionary in the year preceding an election and in election years than in other years. Using Von Hagen’s data for the elections, we examine whether there are differences in the change in cyclically adjusted deficits for three cases: pre-election years, elections years and all other years. The sample period is 1998-2002. Table 5 shows that in pre-election and election years, on average, the structural deficit rose, whereas in other years it declined. However, we find no significant differences between pre-election years and other years (t= -1.4) and pre-election years and election years (t= -0.3). For election years and other years we only find a marginally significant result. The t-value is -1.67, which is significant only at the 10% level. This suggests that elections are not an important factor in explaining differences in fiscal policy outcomes across countries. We have also tested for differences in cyclically adjusted primary deficits. Both in pre-election and election years the deficit rose, whereas in other years it declined (shown in parentheses in Table 5). Once again, the differences between the three groups are, however, not significantly different from zero. The t-values are -1.12 (pre-election versus other), -1.17 (election versus other) and 0.06 (pre-election versus election).
Table 5. Summary data for the change in structural (primary) deficits in pre-election, election and other years
Pre -election year Election year Other Mean -0.0 (-0.3) -0.2 (-0.3) 0.4 (0.1) Median -0.1 (-0.5) -0.2 (-0.5) 0.4 (0.1) Maximum 2.3 (2.2) 3.2 (2.7) 3.0 (2.5) Minimum -2.7 (-3.5) -3.2 (-3.1) -2.3 (-2.3) Standard deviation 1.2 (1.3) 1.5 (1.3) 1.1 (1.1) # observations 17 17 38
Change in primary deficit shown in parentheses.
Source: own calculations based on OECD (2003) and Von Hagen (2003)
In conclusion, the experience with the SGP so far is mixed. On the one hand, the procedures as implied by the rules in place have been adhered to so far. On the other hand, it is clear that especially some of the large member states have not taken the political commitment to strive for a balanced budget or a surplus in the medium term very serious. As a consequence, these countries have exceeded the 3 per cent deficit threshold. In the next section we will analyse the weaknesses of the SGP in some more detail, drawing on the experience of US states with restrictions on fiscal policy at the state level, and focusing on different incentive s for large and small countries to adhere to the rules.
3. The political economy of the SGP
3.1 Strong and weak rules
According to Papademos (2003, p. 75), “a comparison of the rules and procedures of the Stability and Growth pact with characteristics [of successful rules at the state level in the US] shows that the European fiscal rules perform reasonably well, which may lead us to conclude that they are – in principle – suited to ensure fiscal discipline”.
Inman (1996) has identified certain characteristics of successful fiscal policy rules (so-called Balanced Budget Rules, BBRs) at the state level in the US. Even though it can be argued that these rules are different from the SGP as they are self- imposed in a unilateral way, we agree with Papademos that the US experience can be helpful to assess the strengths and weaknesses of the Pact. According to Inman, the potentially most important distinguishing attribute of any BBR specification is whether the rule involves
ex ante or ex post accounting. Ex ante rules apply only at the beginning of the fiscal year, i.e. fiscal policy intentions, whereas ex post rules apply to fiscal policy outcomes. The US experience suggests that weak BBRs use ex ante balance rules; strong BBRs use ex post accounting rules. A second attribute is whether politicians can suspend a certain rule temporarily if they think this to be appropriate. The US experience suggests that weak rules allow such a BBR override, while strong rules do not.
The third attribute of enforcement can be described along three dimensions: access to complain about adherence to the rules is closed or open, the enforcer is partisan or independent, and the penalties are economically insignificant or significant. The US experience suggests that strong enforcement of the BBR requires open access to a review panel or court to allow all potentially affected parties to claim a violation; closed access weakens the BBR. Further, for a strong BBR the enforcing review panel must be independent of – i.e. not connected by partisan obligations to – the political bodies setting deficit policies. Also, if a violation is found, penalties must be enforceable and large enough to induce the political bodies setting deficit policies to prefer the balanced budget outcome to a deficit and the associated penalty. Finally, allowing the BBR to be amended by current political interests – the same interests preferring larger deficits – may weaken the BBR.
In assessing whether Papademos (2003) is right, it is important to realise that the multilateral surveillance and excessive deficit procedure employ forms of co-ordination that differ substantially. The former can be regarded as an application of the so-called open method of co-ordination (Hodson and Maher, 2001), while the latter relies more on the closed method of co-ordination. The open method of co-ordination incorporates different governance approaches in different policy areas. It relies on self-commitment by the member states, peer review and peer pressure, on benchmarking, and on placing emphasis on policy learning and consensus building. In contrast, the closed method of co-ordination tends to have top-down policy formulation and provides for binding rules and severe sanctions.
Also in terms of the distinction between hard and soft law, where hard law lies at one end of the spectrum and soft law at the other, the multilateral surveillance and the excessive deficit procedures are different, the latter being harder than the former. Following Abbott and Snidal (2000), hard law refers to legally binding obligations that are precise and that delegate authority for interpreting and implementing the law, whereas the realm of soft law begins once legal arrangements are weakened along one or more of the dimensions of obligation, precision, and delegation. Or, as Senden and Prechal (2001, p. 185) describe it, soft law consists of “general rules of conduct laid down in instruments which have not been awarded legal force as such, but which nevertheless have certain legal effects and which are directed at and may produce practical effects”.
So how well does the SGP fare within the framework of Inman (1996)? Table 6 presents our assessment. With regard to the specification of the rule, as far as the ex post character is concerned, there is a clear distinction between the multilateral surveillance and the excessive deficit procedure. With respect to the latter, Art. 99(3) paragraph 2 EC refers to information on “important measures taken” and thus to the ex post reporting. In contrast, the stability programmes under Council Regulation 1466/97 have to be based on the plans for future national measures in the field of economic policy and thus on ex ante
judged on the basis of realised fiscal performance, even though planned budget deficits can also be a reason for the Commission to initiate the excessive deficit procedure, while under the multilateral surveillance they are judged on the basis of policy intentions.
Table 6. Aspects of effective fiscal policy rules: US Balanced Budget Rules (BBR) and SGP
Specification: Weak BBR Strong BBR Surveillance Excessive
deficit procedure
Rule
Timing for Review
Ex Ante Ex Post Ex Ante Ex Post
Override
Majority Rule Allowed Not Allowed Allowed Allowed
Enforcement Access Enforcer Penalties Closed Partisan Small Open Independent Large Closed Partisan None Closed Partisan Large Amendment
Process Easy Difficult Difficult Difficult
Concerning the question of whether the rules can be set aside easily, the fact that the same ministers, who are responsible for drafting national budgets, also have to decide whether they breach the 3 per cent criterion and the medium term objective, has to be considered as the most severe weakness of both parts of the SGP.10 As Buiter (2003) points out, credible rules need an impartial, consistent and competent enforcement mechanism. The SGP rules are enforced in the end by the ECOFIN, which “manifestly does not have the collective capacity to commit itself to an impartial, consistent enforcement of the rules” (Buiter, 2003, p. 15).
10 Inman (1996) concludes that the Excessive Deficit Procedure, as outlined in the Maastricht Treaty, does not allow for an override, as national legislatures are unable to suspend the rules temporarily. As we pointed out in the previous section, national legislatures do not play any role in the SGP. However, since the Council can effectively put the rules aside, we feel that the SGP does not have the features of a strong BBR.
Access is clearly limited, since the Council will only take decisions after the European Commission has prepared a report when a member state fails to fulfil the requirements under the criteria listed in Art 104c(2) or when the Commission is otherwise of the opinion that a risk exists that a member state will run an excessive deficit. If the Commission comes to the conclusion that an excessive deficit exists or may occur, it addresses an opinion to the Council, which takes a decision on whether or not an excessive deficit exists.
Regarding the application of sanctions, the same argument that has been made with respect to the possibility for an override by the Council can be made. In comparison to the BBRs of US States, the sanctions due to breaching the deficit criterion are quite tough and could be expected to have a deterrent effect. However, imposed fines aggravate the budgetary imbalances they were expected to prevent. Still, the most important objection to the current system is that the ECOFIN will not automatically impose sanctions, as a discretionary decision by the Council is required. It remains to be seen, whether the Council will indeed impose sanctions if, for instance, France does not take sufficient measures to redress its fiscal imbalances. Furthermore, it is quite surprising that the SGP does not specify sanctions in case the debt ratio is too high since the EC Treaty defines an excessive deficit in terms of the deficit and the debt ratio. The sanctions in the multilateral surveillance procedure are very weak. In fact, only moral suasion and peer pressure (“naming and shaming”) can be applied here. Whether peer pressure works, depends on the incentives that member states have to ensure that other member states adhere to the rules (see section 3.2 for a further analysis).
Finally, with regard to the question of whether the BBR can be changed, a differentiation has to be made between the provisions included in the EC Treaty and the Protocols annexed thereto and the two Council Regulations. An amendment of the rules on the multilateral surveillance and excessive deficit procedure as formulated in Art. 99 et seq. EC would require an amendment of the EC Treaty itself and therefore needs the consent of all member states. To the extent to which the excessive deficit procedure is laid down in Council Regulation 1467/97, an amendment requires a unanimous decision by the Council. Only the rules on the multilateral surveillance procedure, to the extent to which they are laid down in Council Regulation 1466/97, can be amended by a qualified majority vote in the Council. Fundamental amendments of the multilateral surveillance and excessive deficit procedure thus in principle require a consensus between all member states which is not easily achieved.
3.2 Why soft law?
It follows from the preceding analysis that the SGP does not fare extremely well in comparison to characteristics of effective BBRs. Especially, the multilateral surveillance part of the SGP, which heavily relies on soft law, contains various weaknesses. Why have the EU member states chosen for such a soft law approach in the first place? According to Abbott and Snidel (2000), soft law measures may be the most appropriate rule type under some circumstances. First, soft law reduces negotiating costs. Highly legalized agreements entail significant contracting costs. As soft law reduces the levels of obligation, delegation or precision, the costs of negotiation are similarly reduced, which may make agreement possible. Because the commitments made under hard law are more precise and may involve delegation of interpretation of these rules, it will be harder to
reach an agreement. Soft legalization mitigates these costs of reaching an agreement. The negotiating costs argument seems relevant in the case of the SGP. As is illustrated by its name, the member states had rather different views on the aims of the SGP and how to reach them. A rather vague and legally non-binding objective for the medium term helped to reach an agreement.
Second, soft law may also reduce sovereignty costs. Accepting a binding legal obligation, especially when it entails delegating authority to a supranational body, may be costly to states. States can limit sovereignty costs through arrangements that are non-binding or imprecise or that do not delegate extensive powers. Again this argument seems applicable to the SGP, as various member states were unwilling to delegate much authority to the Community level. A scheme that leaves actual policy decisions and implementation at the national level, while at the same time offering the opportunity for peer pressure, is then a natural outcome.
Third, in case of considerable uncertainty soft law may be the most appropriate method of legalisation. This observation is also relevant in analysing the existing system of economic co-ordination. Indeed, one ambiguity in the SGP has concerned the “close to balance or in surplus” budge t objective. The view underlying this objective is that the medium-term budget target should be set such as to provide a safety margin for both cyclical developments and unanticipated budgetary risks. A common interpretation, although not specified as such in the SGP, has been that this implies a target for the cyclically adjusted budget balance (see section 5 for a further discussion of this issue).
Fourth, soft law is a tool of compromise. It can take divergent national circumstances into account through flexible implementation. Soft legalization provides for flexibility in implementation, helping states deal with the domestic political and economic consequences of an agreement. Because even soft legal agreements commit states to characteristic forms of discourse and procedure, soft law also provides a way of achieving compromise over time. Furthermore, it can give states the opportunity to learn about the consequences of what they have agreed to, opening the way for further negotiation. Also this argument seems relevant in the context of the SGP. The recent Commission proposals for reform (as discussed in section 5) were, to quite an extent, based on the experience with the pact.
It is sometimes argued that soft law is, by definition, not effective. This is, however, too simplistic a view. Whether soft law works depends on the reactions of various participants in the process. Even in areas without explicit obligation to adjust there may be substantial incentives for governments to change policies. Two distinct sets of incentives operate: a “competition” incentive and a “co-operation” (regime-building) incentive (see Padoan, 2002).
The co-operation incentive is relevant to the extent that poor performance in any member state participating in the single currency weakens the performance and attractiveness of the euro area as a whole vis-à-vis the rest of the world. Poor policy in any one member of the club decreases the quality of the club good and may generate a negative externality on the other club members. This will presumably lead to strengthened peer pressure on the poor performer from the other club members. The co-operation incentive depends on the externalities. A number of these so-called spillover effects have been identified (see, e.g. Eijffinger and De Haan, 2000). First, there is a potential risk that other governments could in the end feel forced to bail out a bankrupt
government of an individual member state despite the fact that Community law excludes such a move. Second, there is a risk for pressures on the ECB. This may lead to a direct bailout in the form of the purchasing of the debt of a highly indebted country in the bond market, or an indirect bailout taking the form of interest rates lower than motivated by price stability considerations. Third, lack of fiscal discipline in one country may affect interest rates and/or the external value of the euro, thereby affecting the other participating member states.
It follows from this analysis that peer pressure will be stronger, the larger the externalities of excessive deficits. However, the risks of the externalities seem small, especially in the short run. For instance, the external value of the euro seems currently not to be at risk due to the fact that some countries have an excessive deficit. Also the risk of a bailout by either the ECB or the other member states seems rather small, as even the countries with an excessive deficit are perfectly capable of borrowing at financial markets. Therefore, governments have little incentives to push hard when another member state does too little to adhere to the medium- term objective of a balanced budget or a surplus. So the co-operation incentive is weak.
The competition incentives derive from both the policy arena and from the market. A country that performs poorly would see its reputation weaken, which may diminish its leverage in the design and implementation of EU policies at large. In addition, markets may punish a poor performer to the extent that poor policies make that country less attractive for investment, whereas good performers would presumably enjoy greater profitability and thus increased investment. The competition incentives are also weak. So far, financial markets hardly punish a country with an excessive deficit. For instance, when the Council decided that Germany had an excessive deficit, interest rates on German bonds did not rise substantially. The credit ratings of the countries concerned have also not been changed.
3.3 Small vs. big countries
As the preceding section showed, the incentives for member states to prevent other member states from deviating from the non-binding political commitment to strive for a balanced budget in the medium term are not strong. The size of the countries may play a role here. Big countries may be less susceptible to peer pressure than smaller ones, as they are unlikely to loose their influence on EU policies anyway. Indeed, as pointed out in section 2, most large member states did not reduce their deficits (enough) after the start of EMU.
How does this relate to the excessive deficit procedure that mainly consists of hard law? How will countries behave in this case, and will all countries behave in the same way? To shed light on this question, we will use a very simple model, developed in a somewhat different context by Berger et al. (2003).
Consider the problem of a decision maker in country i facing a choice between a “loose” (Li) or “tight” (Ti) fiscal policy (Fi). Further, assume that a tight policy would
imply a fiscal deficit (or a surplus) in line with the conditions of the SGP, while a loose policy would constitute an excessive deficit in conflict with these conditions. To simplify, we assume that fiscal policy is determined simultaneously across countries.
Policy makers will take into account bo th the expected utility – in a political economy sense, i.e. the utility expected by the decision makers – from the deficit level chosen (ui) and any penalty (Si) a country might suffer when running a loose fiscal policy. Si could be interpreted as combination of two factors: first, the fiscal charge foreseen in
the SGP for deficits exceeding 3 per cent; second, as the loss of reputation or “political capital” that ensues from breaching the commitment to stick to the rules of the SGP, which might reduce the bargaining power of country i in negotiations regarding various other issues on the euro area or EU level. Arguably, Si will take different values for any
euro area member. A reasonable assumption is that, for instance, smaller countries will suffer more from a loss of reputation of sticking to the rules than larger countries simply because their overall bargaining power is significantly lower to start with.11 However, as evidenced by recent developments, choosing a loose fiscal policy in breach of the SGP does not necessarily mean that a country will be penalized. To capture the political economy of this decision, we assume that the penalty Si occurs only with a certain
probability (pi) – we will return to the nature of this probability below.
A simple and straightforward way to illustrate the problem of the decision maker in country i is that (s)he chooses fiscal policy Fi to maximize expected utility
i i i i i i u p F F S EU = − ( , ≠)⋅ , (1) where = = = i i i i i i i L F u T F u u if if with ui >ui (2)
is the ut ility level associated with the type of fiscal policy chosen. The assumption
i
i u
u > could reflect the neglect of the medium-run consequences of fiscal indulgence due to political-economic reasons.12
A key element of the set- up described in equation (1) is pi, which captures a
number of elements characterizing the political process behind EU or euro area decisions, including the possible interaction between the fiscal policies chosen across different member countries: = ∧ = = ∧ = = = ≠ ≠ ≠ ≠ i i i i i i i i i i i T F L F p L F L F p T F p if if if 0 with 1> p> p>0. (3)
11 A more elaborate model would entail a sequence of two stages, with the first (“constitutional”) stage encompassing the determination of a common element in Si (for instance, the penalty level in per cent of
GDP) and the second stage the fiscal policy decision. Here, however, we treat the Si as exogenous.
12
This could reflect the election cycle, a wish to restrict the financial room of manoeuvre of a successor government, or simply the short time -horizon of an outgoing government with a low re -election probability.
The probability of being fined is 0 if a country steers a fiscal course in line with rules of the SGP (i.e., Fi = Ti); it is positive, however, if a country opts for a loose fiscal position
(Fi = Li). In the latter case, the probability is a function of fiscal policy stance decision
makers in i expects to prevail in other countries (F≠i) at the time:
13
a plausible assumption is that it will be politically easier (or less costly) to sanction one country for fiscal misbehaviour than many. Thus, the probability of being penalized under the SGP is smaller if all euro area member countries steer of course (Fi =Li∧F≠i =L≠i) compared to
a situation in which only country i chooses a loose fiscal policy (Fi =Li∧F≠i =T≠i). The
implied political interaction and the simultaneous determination of fiscal policy introduce elements of a coordination problem into each country’s decision making. That is, fiscal policy decisions could take the form of a Nash-game where expectations about other countries’ policy decisions matter in addition to preferences or parameters.
A useful start to describing country i’s fiscal policy decision is identifying the point at which decision makers are indifferent between the two policy options Li and Ti.
This is the case if the expected utility (1) is the same under both policies, that is,
i i i
i u p S
u = − ⋅ . (4)
Making use of (2) and (3) and rearranging yields the level of Si that fulfils (4)
∧ ≡ − ∧ ≡ − = − = ≠ ≠ i i i i i i i i i i i i i i L L S p u u T L S p u u p u u S if if * * * . (5)
Equation (5) allows formulating a simple decision rule: for penalties larger than Si*,
decision makers in country i will find it more attractive to choose a tight fiscal policy, while for penalties smaller than *
i
S , running a “loose” fiscal policy will be more attractive. Note that Si* takes on two different levels depending on the expected
behaviour in other member states. Obviously, since ui >ui, it also holds that
* *
i
i S
S > . Moreover, both Si* and
*
i
S are decreasing in ui−ui.
It is instructive to illustrate this result along the dimension of Si (see Figure 1).
The horizontal ui-line marks the utility level that decision makers in i expect from a tight
fiscal policy, while the downward sloping lines show the expected utility related to a loose fiscal policy. The intersection between the downward sloping lines and the ui-line
define the indifference level(s) *
i
S .
13 While not explicitly modelled in our simple set-up, the term “all other” countries is interpreted as representing a group of other countries sufficiently large to exhibit a significant influence on decisions on the euro area level while being perceived as exogenous from country i’s perspective. This could either mean a simple majority of countries or a group of countries with sufficient political clout to achieve the same.
Figure 1. Model: The Critical S Value
In the case of a loose fiscal policy, expected utility is strictly decreasing in Si, but
the swiftness of the decline is a function of the expected fiscal policy in the rest of the euro area. As discussed above, in a situation in which all members are thought to violate the SGP rules the probability of being fined will be lower compared to one in which only country i is running a loose policy (p< p, see equation (3)). Therefore, if all countries simultaneously violate the SGP, the curve will be flatter, and the intersection with the u -line, will be fur ther to the right than when country i alone chooses a loose policy. This leaves us with three possible fiscal policy regimes.
The large country case: loose fiscal policy dominates (Si <S*i )
A country that perceives the penalty for fiscal misbehaviour as low, perhaps because its size makes the ensuing loss in political reputation negligible, will have no incentive to choose a tight fiscal policy. Independently from the behaviour of other euro area members, for Si <S*i the expected utility from selecting a loose policy will always
exceed the expected utility level under a tight policy. In Figure 1, both downward-sloping lines are above the ui-line. More formally, not playing according to the rules of the SGP becomes a dominant strategy for country i.
i i i i i p S L T u − ⋅ ) ∧ ≠ ( i i i i i p S L L u − ⋅ ) ∧ ≠ ( i u i u * i S * i S Si
The small country case: tight fiscal policy dominates (Si <Si
*
)
An equivalent result holds at the opposite end of the spectrum. If a country perceives the penalty for not playing according to the rules of the SGP as sufficiently high, for instance, because its bargaining power within the euro area or EU is otherwise limited, it will always prefer to play according to the rules of the SGP. As Figure 1 illustrates, for
i
i S
S* <
both downward-sloping lines remain below the ui-line, effectively prohibiting
fiscal misdemeanour. The expected utility level under a tight policy will always exceed that under a loose policy, rendering the former a dominant strategy independent of fiscal policy decisions elsewhere.
The intermediate case: fiscal policy as a coordination game (S*i <S<Si*)
For intermediate values of Si, however, country i’s policy choice will depend on its
assumptions regarding the simultaneous fiscal policy selection in other accession countries. In the region S*i <S <Si* in Figure 1 expected utility under a tight fiscal policy (the ui-line) is higher than under a loose policy if only country i violates the SGP
(the (ui−pi⋅Si) Li∧T≠i-line) but lower than in the case where all member countries simultaneously choose a loose fiscal policy (the (ui−pi⋅Si) Li∧L≠i-line). Consequently,
if decision makers in i expected that fiscal policy elsewhere to be tight, they would stick to the rules as well and select a tight policy. If, on the other hand, decision makers in i
expected the rest of the euro area to violate the SGP rules, they would play loose too. As a result, fiscal policy is determined in a coordination game.
For illustrative purposes, it is helpful to reduce the exposition to a symmetric two-country set- up, with two-country i on the one hand and “all other” countries ≠i on the other. In this case, equation (5) describes a normal (or strategic) form coordination game that can be summarized in a simple matrix:
Country ≠i Country i L≠i T≠i Li A, A B, C Ti C, B C, C where i i p S u A≡ − ⋅ >C≡ui>B≡ui− p⋅Si.
It is straightforward to show tha t the game has two Nash equilibria: if both countries expect the other country to choose to play loose (L), both will choose L themselves. If, however, both i and ≠i believe their counterpart to play tight (T), both will find it optima l to choose T as well. Note that the equilibrium that is least desirable from a SGP perspective, that is, the equilibrium in which both countries decide to run a loose fiscal policy, entails higher pay-offs for the individual decision makers in i and ≠ i. This makes
the equilibrium with loose fiscal policies (Li,L≠i) more likely to be selected in a repeated coordination game or if a refined Nash-equilibrium concept were to be applied.
The basic message from the model outlined above is that countries will behave differently depending on size.14 Fiscal policy decisions depend critically on the perceived size of the penalty for misbehaviour by the standard of the SGP and thus, or so we argue, on country size. Smaller countries will, as a rule, be more likely to play according to the rules than larger countries. In the large country case, if the expected utility loss associated with not adhering to the SGP conditions is very low, decision makers are likely to strictly favour a loose fiscal policy. On the other hand, in the small country case, if the perceived fine for fiscal misbehaviour is very high, fiscal policy is more likely to follow a tight course. This finding seems to be in line with the stylised fact describes earlier in section 2 that most smaller euro area countries showed greater adherence to the rules of SGP than larger countries.
In addition, if the penalty for a loose policy stance falls in an intermediate range, fiscal policy decisions might depend on the polic y stance chosen in other member states. If the probability of actually being sanctioned is lower in a situation in which all members simultaneously choose not to adhere to the SGP, picking a loose fiscal policy could be a self-enforcing Nash equilibrium. In this sense, the fiscal behaviour of countries will depend on the number of member states that may breach the deficit criterion in the near future. This result suggests, among other things, that non-adherence to SGP rules by all but the largest euro area members could have elements of herd behaviour or contagion. For instance, it is hard to imagine that member states on the verge of breaching the deficit criterion sometime in the not so distant future will take a tough stance with regard to those countries that already have an excessive deficit.15 Whether such a situation is likely to occur depends, among other things, on the degree of business cycle synchronization in the euro area16 and on the impact of the business cycle on the government budget deficit.
14
Another plausible property of the results is that the expected utility associated with a loose or tight fiscal policy plays a role for the choice of fiscal policy. Obviously, the more developed a country’s preference for prudent fiscal policy, the less pressing is the election cycle, or the better informed decision makers are regarding the intertemporal consequences of a too loose fiscal policy, (the larger is the difference ui−ui and) the less attractive is selecting a loose fiscal policy. See Berger et al. (2003).
15
Furthermore, member states with an excessive deficit are not excluded from decisions concerning the application of the excessive deficit procedure to other countries. A situation can be envisaged in which the required two-third majority to apply sanctions to a particular member state fails to materialise due to a blocking minority by member states running an excessive deficit.
16 Business cycles in the various countries in the euro area are, to some extent, dissimilar. However, various recent studies suggest that monetary and economic integration in Europe will lead to more business cycle synchronization (for instance, Frankel and Rose (1998) and Artis and Zhang (1999); see, however, also Inklaar and De Haan (2001) who contest the findings of Artis and Zhang.) If business cycle synchronization increases, it will be more likely that many countries will face the risk that they will exceed the critical threshold at the same time, making it more likely that a blocking majority will exist.
4. How sensitive are budget deficits to an economic downturn?
It is often argued that the SGP offers member states enough flexibility for fiscal stabilisation. Papademos (2003, p. 76) argues, for instance, “Empirical evidence shows that in the European context a margin of 3 percentage points of GDP is, under normal circumstances, adequate to let automatic stabilisers fully operational, thereby stabilising business cycle fluctuations. In other words, countries that comply with the rues of the game should have ample opportunity for (automatic) fiscal stabilisation. The fact that some countries are currently forced to pursue more or less pro-cyclical fiscal policy, in order to avoid breaching the 3 percent threshold, should hence not be regarded as a failure of the Pact but as a failure of these countries to sufficiently reduce their budget deficits in periods of stronger economic growth.” In this section we examine whether this view is correct.17
There exist various methods to determine whether the SGP offers member states enough flexibility to allow automatic stabilisers to operate. A first method used in the literature is based on the OECD model INTERLINK (Van den Noord, 2002). Using this model, it is possible to calculate the elasticities of (components of) the government balance with respect to the output gap.18 The OECD calculates these elasticities for the total balance and five subcategories: corporate taxes, personal taxes, indirect taxes, social security payments and unemployment-related spending. Table 7 shows the elasticities for a number of European countries. It follows that there is quite some variation between EU member states. The sensitivity of the budget balance to the economic cycle is the largest for the Netherlands (0.76) and the smallest fo r Austria (0.31) Cross-country differences exists due to various factors, the most important being differences in size of the government sector and the structure of the tax system. Budget balances of countries with a large public sector are generally more sensitive to cyclical movements than those of countries with a small public sector. The higher the taxation of cyclically sensitive tax bases, the greater will be the cyclical sensitivity of the fiscal position.
17
In this section, we will only deal with the room of manoeuvre for automatic stabilizers. Recently, Galli and Perotti (2003) have analysed whether the SGP has significantly impaired the ability of EU governments to conduct a stabilizing fiscal policy. Based on estimates of fiscal rules for the discretionary budget deficit over the period 1980-2002, using data on EMU countries and control groups of non-EMU EU countries and other non-EU OECD countries they do not find much support for a reduced stabilization abilities. In fact, they find that discretionary fiscal policy in EMU countries has become more counter-cyclical over time. 18
Table 7. Tax and expenditure elasticities for EU member states
Taxes
Corporate Personal Indirect Social Security Current Expenditure Total balance Austria 1.9 0.7 0.5 0.5 0.0 0.31 Belgium 0.9 1.3 0.9 1.0 -0.4 0.67 Denmark 1.6 0.7 1.6 0.7 -0.7 0.85 Finland 0.7 1.3 0.9 1.1 -0.4 0.63 France 1.8 0.6 0.7 0.5 -0.3 0.46 Germany 0.8 1.3 1.0 1.0 -0.1 0.51 Greece 0.9 2.2 0.8 1.1 0.0 0.42 Ireland 1.2 1.0 0.5 0.8 -0.4 0.32 Italy 1.4 0.8 1.3 0.6 -0.1 0.48 Netherlands 1.1 1.4 0.7 0.8 -1.0 0.76 Portugal 1.4 0.8 0.6 0.7 -0.2 0.38 Spain 1.1 1.1 1.2 0.8 -0.1 0.40 Sweden 0.9 1.2 0.9 1.0 -0.5 0.79 UK 0.6 1.4 1.1 1.2 -0.2 0.50
Source: Van den Noord (2002)
Although using these elasticities has some drawbacks19, they do provide an intuitive approach to determining safe targets for the government budget. Table 8 shows calculations in which we determine safe targets by focusing on the largest negative output gap during the 1980s and the 1990s. As table 8 shows, based on historical experience, most countries can even run medium term deficits up to about 1.5% and still have enough flexibility to use automatic stabilisers. A similar conclusion was reached by Buti and Sapir (1998). Their estimates suggest that in the past the cyclical component of budget balances rarely surpassed the 3 per cent of GDP leve l (see also Buti et al., 1997). Our calculations are also broadly in line with those of the European Commission, which are shown in the third column of table 8.
19 Elasticities may be time varying. This implies that the deficit target is in effect a moving target, which will complicate fiscal policy. Another issue, raised by Brunila et al (2002), is the source of the economic disturbance. They show that different kinds of shocks produce different budgetary responses. This means that focusing on merely one set of elasticities presents only a partial view of the adjustment of the budget.
Table 8. Safe medium-term budgetary positions implied by OECD elasticities and output gaps
I 1980-1989 II 1990-2004 III Commission Austria -1.9 -2.2 -2.1 Belgium -0.6 -0.9 -0.7 Denmark 0.2 -0.1 -0.3 Finland -1.9 3.8 0.8 France -1.1 -1.6 -1.7 Germany -0.9 -1.8 -1.6 Greece -0.9 -1.4 -1.7 Ireland -1.6 -1.6 -1.3 Italy -1.6 -1.6 -1.5
Luxe mburg n.a. n.a. 0.1
Netherlands 1.0 -1.2 -0.7
Portugal 1.0 -1.7 -1.2
Spain -0.3 -1.2 -1.5
Sweden -1.6 1.8 -0.8
United Kingdom 0.5 -0.9 -1.2
Note: safe budgetary positions calculated by multiplying the largest output gap observed in a period by the OECD elasticities for the total budget balance and calculating the difference from the 3% limit. Data in third column have been taken from European Commission (2002).
Dalsgaard and De Serres (1999) use a different approach. They estimate a structural VAR model for 11 European countries and use this model for stochastic simulations. Simulating the changes in fiscal positions in reactions to different types of economic shocks, they conclude that budget deficits between 1 and 1.5% should allow enough room for the automatic stabilisers to operate. Barrel and Pina (2000) reach a similar conclusion. They use the macro-econometric model NiGEM for a stochastic simulation exercise. They conclude that the chance that the 3% threshold of the SGP will be breached is very small (< 5%).
The message in most studies discussed above is cautiously optimistic. This seems to be the consensus in the literature in the period before EMU (see also Eichengreen and Wyplosz, 1998). Once governments succeed in bringing their cyclically adjusted deficits back to, say, 1% the chances are small that they will breach the 3% threshold. However, Hughes Hallett and McAdam (2003) conclude that this conclusion is to optimistic. They argue that the probability distribution of the deficit ratio has a complicated form, as both its numerator and denominator are driven by the same stochastic variable (economic activity). It therefore tends to have a wide variance with fat tails. Using stochastic simulations over a forty year time period with the IMF’s Multimod model – with shocks distributed according to their historical characteristics – they examine in what proportion of those time periods, repeated over 400 replications of each policy experiment, a particular country’s deficit goes beyond the 3 per cent limit. Table 9 reproduces some of their results. It becomes clear that in all fiscal policy regimes that are assumed (a 3 per cent deficit target, a 1 per cent deficit target, national targets20 and tax smoothing), the actual deficit will, on average, be close to target (compare the average deficit with the target). However, it is also clear that there is a fair chance that the 3 per cent level will be breached. This is obvious in the case of 3 per cent target, where the chances that the deficit will exceed the threshold are around 80 per cent. However, also in the case of lower targets, the chances that the deficit will be higher than 3 per cent of GDP differ substantially from zero. For instance, with 1 per cent deficit rule, the chances that the critical deficit level will be exceeded are between 15 and 19 per cent. This suggests that extra safety margins (i.e. low structural deficits) may be needed in order to forego excessive deficits in an economic downturn.
Table 9. Stochastic simulation result s (Multimod model, various regimes)
(1) 3% target (2) 1% target (3) National targets (4) National targets and tax smoothing Germany Average deficit 3.11 1.09 0.50 0.50 Prob. > 3% 80% 15% 13% 8% France Average deficit 3.14 1.11 0.53 0.50 Prob. > 3% 83% 15% 11% 8% Italy Average deficit 3.07 1.52 0.90 0.75 Prob. > 3% 80% 19% 12% 8%
The monetary regime in all simulations is the same (inflation targeting). Source: Hughess Hallet and McAdam (2003)
20 Hughes Hallett and McAdam assume here that Italy has a deficit target of zero, while Germany and France aim at ratios of 0.5 per cent of GDP.
The failure to bring structural deficits close to target is, of course, one of the reasons why many countries are experiencing difficulties today. If structural deficits are not reduced quickly enough, a recession is more likely to force the actual deficit to the 3 per cent limit. The OECD elasticities give an indication of how deficits will react to negative output gaps during one year. At present, the recession has been lasting for more than a year. As has been noted before (e.g. Buti et al. 1998), a protracted recession can have even deeper effects on the government budget than the elasticity approach suggests. Recently, Jaeger and Schuknecht (2003) have argued that the automatic cyclical responsiveness of taxes to real output growth seems to be larger than normal during boom-bust phases in asset prices. Revenue related to capital gains or losses and turnover taxes as well as wealth effects on consumption boost revenue disproportionately during booms but also adversely affect receipts during busts. A similar pattern occurs at the spending side of the budget. As a result, fiscal balances tend to improve during the boom but deteriorate significantly during the bust phase.
Consider the case of the Netherlands. Figure 2 plots the actual and structural budget balance, as well as the output gap for the years 1995-2004. As the figure shows, the structural deficit still amounted to more than 4% of GDP in 1995. However, it quickly converged to a ‘safe’ value around 1 per cent at the end of the sample period. The output gap was very close to zero in 1995 and 1996. Consequently, the actual deficit virtually was the same as the structural deficit. Starting in 1997, growth started to pick up and the output gap widened to almost 3 per cent in 2000. Afterwards, a decline set in which lasts until now. For 2002 until 2004 the output gap is negative. As the Netherlands has a high elasticity of the budget balance to the output gap (0.76), the response of the actual deficit is quite large. It follows from figure 2, that the deficit approaches the 3 per cent threshold fairly rapidly. In recent budgetary plans for 2004, the Dutch government has therefore decided to cut spending drastically in order to keep the deficit below the 3 per cent level.
Figure 2. Output gap and deficit in the Netherlands, 1995-2004 -5 -4 -3 -2 -1 0 1 2 3 1996 1997 1998 1999 2000 2001 2002 2003 2004 budget deficit (EMU)
structural deficit output gap Source: OECD.
In line with the results of Hughes Hallett and McAdam (2003), the experience of the Netherlands suggests that the previously calculated safety margins may not guarantee that countries do not have to use discretionary measures in order not to exceed the 3 per cent threshold of the SGP. In case of a protracted economic downturn, even countries that apparently were on the safe side have to follow pro-cyclical policies in order to stick to the rules of the SGP. Countries that never managed to reduce their deficits to “safe” levels will definitely have to take restrictive measures.
The implied pro-cyclical character of fiscal policies has led to various reform proposals that are inspired by the view that the current rules in place do not offer enough flexibility to use fiscal policy in a counter-cyclical way. As pointed out by Buti, Eijffinger and Franco (2003), many of the proposals for reform imply that the SGP is replaced by some other mechanism to keep national fiscal policies on a sustainable path, be it other rules or a stronger reliance on (financial) market discipline or a combination of these. However, Buti et al. argue that instead of renegotiating the Pact, reinterpreting the current rules in place may be better attainable. In this direction, the Commission has recently presented proposals to improve the interpretation of the Pact in order to ensure a more rigorous adherence to the goal of sound and sustainable public finances.