University of North Dakota
UND Scholarly Commons
Economics & Finance Faculty Publications Department of Economics & Finance9-2015
Global Diversification and IPO Returns
David C. MauerSong Wang Xiao Wang
University of North Dakota, [email protected] Yilei Zhang
Follow this and additional works at:https://commons.und.edu/ef-fac
Part of theBusiness Commons
This Article is brought to you for free and open access by the Department of Economics & Finance at UND Scholarly Commons. It has been accepted for inclusion in Economics & Finance Faculty Publications by an authorized administrator of UND Scholarly Commons. For more information, please [email protected].
Recommended Citation
Mauer, David C.; Wang, Song; Wang, Xiao; and Zhang, Yilei, "Global Diversification and IPO Returns" (2015).Economics & Finance Faculty Publications. 15.
Global Diversification and IPO Returns
David C. Mauer Tippie College of Business
University of Iowa
108 Pappajohn Business Building Iowa City, IA 52242 [email protected]
(319) 335-0944 Song Wang
Graham School of Management Saint Xavier University
Chicago, IL 60655 [email protected]
(773) 341-5004 Xiao Wang
College of Business and Public Administration University of North Dakota
Grand Forks, ND 58202 [email protected]
(701) 777-3351 Yilei Zhang
College of Business and Public Administration University of North Dakota
Grand Forks, ND 58202 [email protected]
(701) 777-3407
Current version: April, 2015
This paper was previously circulated under the title ―Export activity, IPO underpricing, long-run performance, and survival.‖ We thank two anonymous referees, Matt Billett, Dan Bradley, Yehning Chen, Ethan Chiang, Wen-I Chuang, Jon Garfinkel, Michael Gibbs, Zhan Jiang, Dolly King, Cheng-Few Lee, Feng Li, Pierre Jinghong Liang, Ginger Meng, Stas Nikolova, Yiming Qian, Jay Ritter, Susan Chenyu Shan, Ann Sherman, Emre Unlu, Tracy Wang, Xiaoyan Zhang, and seminar participants at National Chiao Tung University, National Taiwan University, Shanghai Advanced Institute of Finance (SAIF) at Jiao Tong University, Shanghai University of Finance and Economics, University of Nebraska, University of North Carolina at Charlotte, and numerous conferences and meetings for comments and suggestions.
Global Diversification and IPO Returns
Abstract
A large number of newly listed firms have significant involvement in international business activity. In this paper, we examine the effect of international business activity on the pricing of initial public offerings (IPOs), post-IPO performance, and survival. In a large sample of U.S. IPOs over 1981 to 2012, we find that firms with exports and/or foreign sales prior to going public have significantly lower underpricing than firms without international business activity. Furthermore, firms with international business activity significantly outperform purely domestic IPO firms over three- and five-year periods after going public and have a significantly higher survival rate. Overall, we provide strong evidence that global diversification has an economically significant effect on the valuation and subsequent performance of firms going public.
JEL classification: F23, G24, G32
Keywords: Initial public offering, Global diversification, IPO underpricing, IPO long-run performance, Survival analysis
1. Introduction
With the increasing importance of market globalization, firms have become more involved in international trade and foreign direct investment. By operating in foreign markets, firms may expand their revenue base and diversify the risk of domestic cash flow shocks. Global diversification may also enhance firm value by helping to ―complete the market‖ in the face of international capital market segmentation and/or frictions.1 In contrast with this possible value-enhancing perspective, foreign operations entail complexities from monitoring and communication, as well as the risks of country default, exchange rate fluctuations, and unstable political regimes. The literature generally finds mixed support for the influence of international activity on firm performance. A number of studies document that firms engaged in export activity have better operating performance than do peer-firms that sell domestically only (see, e.g., De Loecker (2007), Greenaway et al. (2007), and Park et al. (2010)). Furthermore, Gande et al. (2009) find that global diversification – as measured by foreign sales – increases firm value and Reeb et al. (2001) find that global diversification promotes credit ratings and decreases the cost of debt. Other studies, however, argue that international business activity (i.e., exports and/or foreign sales) decreases firm value. For example, Denis et al. (2002) document that global diversification carries an average valuation discount of 18%.2
To the best of our knowledge, the literature on the costs and benefits of global diversification has focused exclusively on large publicly-traded multinational corporations. Although this is clearly an obvious and relevant group of companies to study, a large number of small private (i.e., not yet publicly traded) companies are actively involved in international business activity. In our sample of 4,994 IPOs
1 For example, see Errunza and Senbet (1981, 1984), Errunza and Losq (1985, 1989), Merton (1987), and Mauer and Senbet
(1992).
2
From a contingent claims perspective, Doukas and Kan (2006) argue that risk-reducing global diversification should increase bondholder value and decrease shareholder value. The upshot is that global diversification may not decrease overall firm value. Consistent with their argument, they find that the global diversification discount is increasing with leverage and that globally diversified all-equity firms trade at a premium.
from 1981 to 2012, we find that more than a quarter of the firms going public have exports and/or foreign sales in the year of and the year before the initial public offering. For this group of firms, the average amount of exports and/or foreign sales to total firm sales is 30% in the year prior to the IPO year. In this paper, we contribute to the debate on the costs and benefits of global diversification by focusing on the international business activity of private firms in the years immediately surrounding their initial public offering. We examine the effect of international business activity on the valuation, long-run performance, and survival of newly public firms.
A large body of literature documents that IPOs are underpriced as evidenced by an initial offer price below the closing price at the end of the first day of trading.3 The literature argues that uncertainty about the firm’s business, operations, strategy, and ultimately future earnings is an important determinant of underpricing because shares must be offered at a discount to compensate investors for uncertainty. A key question for this study is whether international business activity influences underpricing. On the one hand, if involvement in international markets provides a profit cushion to firms and/or diversifies domestic earnings, investors should have lower uncertainty about earnings prospects. Thus, the lower uncertainty associated with a globally diversified earnings stream could encourage firms and their investment bankers to offer the shares in the IPO at a higher offer price relative to the expected secondary market trading price and therefore IPO underpricing would be lower. On the other hand, if exports and/or foreign production bring additional risks that offset the benefits of global diversification, then we might expect globally diversified firms to face larger underpricing than domestically focused firms. We can therefore assess the relative benefits and costs of global diversification by studying whether international business activity around the time of the IPO influences IPO underpricing.
3
In addition to being underpriced on average, it is well documented that IPO firms underperform the market and matching firms after going public (see, e.g., Ritter (1991) and Loughran and Ritter (1995)).4 Consistent with this long-run underperformance, a number of studies also document a low survival rate of newly listed firms (see, e.g., Jain and Kini (2000, 2008) and Fama and French (2004)). If global diversification has persistent benefits to firms going public, then we might expect less post-issue underperformance and a higher survival rate of newly listed firms with international business activity. Of course, if international business activity brings additional shocks to earnings that cannot be mitigated through diversification and/or hedging, then we would expect worse underperformance and survival of IPO firms with exports and/or foreign sales.
In this paper, we investigate the impact of global diversification on the underpricing and post-issue performance of firms going public. As noted above, 1,384 or 27.7% of our sample IPO firms have exports and/or foreign sales in the year of the IPO and the year before. Relative to domestically focused IPO firms, globally diversified IPO firms tend to have higher productivity, higher investment (capital expenditures and R&D), and greater age at the time they go public. Interestingly, however, they are not always larger. While the average and median IPO firms with foreign operations tend to be roughly double the size of their purely domestic counterparts – as measured by market capitalization, assets, or sales – the average and median exporting IPO firms are significantly smaller.
Controlling for IPO and firm characteristics known to influence underpricing as well as time and industry fixed effects, we find that global diversification significantly decreases underpricing. Depending on whether the IPO firm is an exporter and/or has foreign sales, estimates from multivariate regressions show that underpricing is 2-6% lower for globally diversified IPOs in comparison to domestically-focused IPOs. Furthermore, IPO underpricing is significantly decreasing in the intensity of
4 Recent studies argue that long-run underperformance exits only among certain types of IPOs. For example, Brau et al.
(2012) find only newly listed firms that acquire within a year after their IPO underperform and Ritter (2011) finds that IPO long-run underperformance is present only in small firms.
international business. For example, a one standard deviation increase in the ratio of exports and/or foreign sales to total firm sales decreases underpricing by approximately one percent. These results are robust when we account for the potential influences of endogeneity and selection bias on the relation between underpricing and international business activity. Overall, our analysis strongly supports the notion that global diversification reduces IPO uncertainty and thereby decreases underpricing.
We next compute calendar time abnormal returns and buy-and-hold returns to examine the long-run performance of globally diversified newly-public firms. We find that IPO firms with exports and/or foreign sales significantly outperform IPOs without international business activity over three and five year periods after the IPO. These results are robust when we use a purged eight-factor model to explain post-IPO returns,5 when we group IPOs into size-based portfolios, when we group IPOs by post-issue acquisition activity, and when we control for selection bias using propensity score matching.
Lastly, we investigate whether global diversification affects the survival of IPO firms. Specifically, we test whether newly-public firms with international business activity have a lower probability of failure (i.e., being delisted because of bankruptcy or liquidation). Using a hazard model to estimate the influence of IPO and firm characteristics on survival, we find that globally diversified IPO firms have a lower hazard rate (i.e., higher survival rate) than domestic IPO firms. Overall, the evidence from the long-run performance and survival analysis strongly suggests that global diversification mitigates long-run underperformance and enhances long-run survival.
This paper makes four contributions to the literature. First, quite a few firms are actively involved in international business prior to going public. However, global diversification has not been explored as a factor contributing to IPO pricing and subsequent performance. Our paper is the first to
5
The eight factors include the three Fama-French (1993) factors, the Carhart (1997) momentum factor, the Cooper et al. (2008) asset growth factor, the Harvey and Siddique (2000) co-skewness factor, the Lyandres et al. (2008) investment factor, and the Pastor and Stambaugh (2003) liquidity factor. Following Loughran and Ritter (2000), we construct the factors after purging firms that have publicly issued equity in an IPO or SEO during the prior five years.
document that global diversification is an economically significant determinant of IPO initial returns, long-run performance, and survival of newly public firms. Second, by studying IPO initial and long-run returns, we bring a valuation dimension to the impact of international business activity on firm performance. By comparison, the international economics literature assesses the impact of international business activity on firm performance with non-stock-market based measures of performance (e.g., productivity, capital intensity, and liquidity ratios).6 Third, to the best our knowledge, empirical studies of global diversification focus on large, publicly-traded firms. None have focused on small firms despite their non-trivial involvement in international markets. Since firm size tends to be small at the IPO stage, our study contributes to the literature on global diversification by documenting the value implications of global diversification for a sample of small firms as they transition from being privately-held to publicly-traded. Lastly, our results have important strategic and investment implications for firms and investors. Specifically, firms going public that have international business activity have significantly lower underpricing and better risk-adjusted long-run returns than firms with purely domestic operations. We find that a strategy of shorting a portfolio of newly public firms with purely domestic operations and investing in a portfolio of newly public firms with international business activity generates positive risk-adjusted returns of about 50-60 basis points per month before transaction costs.
The remainder of the paper is organized as follows. Section 2 provides a brief discussion of our hypotheses. Section 3 describes the data. Section 4 presents our empirical results and Section 5 concludes.
2. Background and hypothesis development
6 A recent exception is Breinlich (2014), who assesses the effect of trade liberalization on firms by examining stock market
This section draws on the literature in finance and international economics to develop testable hypotheses for the effect of global diversification on IPO underpricing, long-run performance, and survival.
2.1. Global diversification and IPO underpricing
A persistent puzzle about IPOs is that they are underpriced on average or have positive initial returns computed from the offer price to the closing price at the end of the first day of trading. For example, over the period from 1980 to 2014, underpricing of U.S. IPOs averaged 18%.7 This suggests that on average the offer price is too low and that firms are leaving money on the table. Although a number of explanations have been advanced in the literature for why IPOs are underpriced, at its core the primary driver seems to be lack of information and/or uncertainty about the business and earnings potential of the firm going public. This is especially true for high technology firms where either the technology is so new that it is not ―spanned‖ by existing technologies of publicly traded firms or there is a high degree of uncertainty associated with the future profitability of all firms with that type of technology. A key implication of this explanation is that underpricing is increasing in the degree of uncertainty (see, e.g., Ritter (1984)).8
If engaging in international business helps expand and stabilize a firm’s revenue base and generally contributes to greater awareness about a firm going public, then we would expect a decrease in uncertainty about the pricing of the IPO. Based on the arguments advanced in the IPO literature, we would therefore expect that a globally diversified firm is more fully priced when it is brought public resulting in lower underpricing. From a similar although different perspective, to the extent that global diversification enhances the spanning of the firm’s technology in the secondary market (i.e., where the
7
For data on underpricing, see Jay Ritter’s website (http://bear.warrington.ufl.edu/ritter/ipodata.htm).
8 See Ritter and Welch (2002), Ljungvist (2007), and Ritter (2011) for reviews of explanations for underpricing of IPOs. The
spanning argument is formally advanced in Mauer and Senbet (1992). Merton (1987) has a similar explanation to the spanning argument based on market segmentation caused by lack of investor awareness.
firm trades once it goes public) or helps complete the market by providing investors access to otherwise segmented markets, we would also expect a decrease in underpricing. We recognize, however, that the additional risks associated with exports and/or foreign sales (e.g., exchange rate fluctuations) and possibly the complexity of managing operations both domestically and abroad might lead to a discount placed on globally diversified IPOs. Thus, although we predict that globally diversified IPOs will have lower underpricing than domestically focused IPOs, it is ultimately an empirical question.
2.2. Global diversification and IPO long-run performance
Another empirical result widely documented in the IPO literature is that newly public firms underperform in the years immediately after the IPO. This long-run underperformance is documented by, for example, Ritter (1991), Loughran and Ritter (1995), and Fama and French (2004). Given that the fundamental value of a firm is its discounted expected future cash flows, global diversification can enhance long-run performance and hence firm value in at least two ways. First, involvement in international business provides an additional revenue channel that may enhance and/or diversify a firm’s domestic revenue stream.9 Second, global diversification may provide a natural hedge of domestic systematic risk (e.g., an economic downturn) that may decrease a firm’s discount rate. Consistent with the notion that global diversification is beneficial, recent studies by Santos et al. (2008) and Gande et al. (2009) document that global diversification enhances publicly-traded firms’ values.10 Building on these arguments, we hypothesize that globally diversified IPOs have better long-run performance than domestically focused IPOs. Similar to the prediction on underpricing, however, we recognize that the additional risks inherent in international business activity might offset the long-run benefits of global
9 See, for example, Melitz (2003) for a dynamic industry model where only the most productive firms export, which leads to
a positive feedback effect on a globally diversified firm’s profitability.
10
This contrasts with the well documented empirical finding that domestic diversification leads to a discount in firm value. See, for example, the papers by Lang and Stulz (1994), Berger and Ofek (1995), Comment and Jarrell (1995), Servaes (1996), and Lins and Servaes (1999). A number of papers question this finding, however, including Whited (2001), Campa and Kedia (2002), Billett and Mauer (2000, 2003), and Villalonga (2004).
diversification. Indeed, Denis et al. (2002) argue that global diversification increases coordination and organizational costs, and may engender inefficiencies associated with building a global empire. Thus, like underpricing, it is ultimately an empirical question whether global diversification has a positive effect on long-run performance.
2.3. Global diversification and the survival of IPO firms
Jain and Kini (1994) find a significant decline in operating performance for the median IPO firm over the three-year period after the IPO. This result and the well documented poor stock market performance over a similar period after the IPO may help explain the low survival rate of newly public firms (see, e.g., Fama and French (2004) and Jain and Kini (2000, 2008)). Studies have shown, however, that firms engaged in international business activity are more financially stable and have higher productivity rates than firms focused purely on domestic business (see, e.g., De Loecker (2007), Greenaway et al. (2007), and Greenaway et al. (2008)). In effect, global business operations provide a cushion to negative domestic economic shocks. Focusing on the experience of newly-public firms, it therefore seems reasonable to postulate that the survival rate of globally diversified IPO firms is higher than that of IPO firms with domestic operations only. Nevertheless, there are additional costs and risks associated with international business that may negatively affect IPO firm survival. For example, Melitz (2003) and Tybout (2003) note that globally diversified firms face a variety of additional costs associated with entering and operating in foreign markets that may impair a firm’s ability to deal with economic shocks. Moreover, Greenaway et al. (2008) argue that global firms face more competitors and Baldwin and Yan (2011) argue that global firms are increasingly subject to tariff and exchange rate shocks. For these reasons, it is unclear whether global diversification helps or hurts the survival of newly public firms.
3. Sample and data
We construct our IPO sample from the Securities Data Corporation (SDC) New Issues database. We obtain initially 12,636 U.S. IPOs between 1981 and 2012. Merging with CRSP leaves 11,454 IPOs. We then apply the following screens:
1. delete 2,618 IPOs in the financial industry with SIC codes 6000-6999 and 119 IPOs in regulated industries with SIC codes 4900-4999;
2. delete 589 IPOs with an offer price less than $5;
3. delete 935 REITS, limited partnerships, closed-end funds, ADRs, and unit IPOs; and 4. delete 671 spinoffs and carve-outs.11
Applying these screens to the sample of 11,454 IPOs produces a sample of 6,522 IPOs. Since we need accounting data to compute many of the variables used in the study, we require that IPO firms are in the Compustat database. We implement this criterion by matching the sample of 6,522 IPOs to the CRSP/Compustat Merged database and obtain a sample of 5,759 IPOs. Lastly, to ensure a common sample of IPOs throughout most of the analysis, we require that IPOs have non-missing data to compute the baseline variables in our underpricing regressions (see Table 4 and the variable definitions in the Appendix). This results in a final sample of 4,994 IPOs over the period from 1981 to 2012.
Following the global diversification literature (e.g., Denis et al. (2002)), we focus on exports and foreign sales. Thus, for each IPO firm in the sample, we gather data on whether the firm has exports and/or foreign sales in the year of the IPO and the year before the IPO. The distinction between exports and foreign sales is that exports are the sale of domestically manufactured products in foreign countries and/or markets, whereas foreign sales result from the sale of products manufactured in a foreign country. Foreign manufactured products may be sold in the U.S. (i.e., domestically), in the foreign country where
11 The screens in 1, 2, and 3 are standard in the IPO literature (see, e.g., Butler et al. (2014)). The screen in 4 ensures that our
they are produced, or in another country.12 We obtain information on export activity from the Compustat Geographic Segment database. An IPO firm is designated as an Exporter if at least one business segment reports export sales (variable name SALEXG) in the year prior to the IPO and in the IPO year. We obtain information on foreign sales from the Compustat Industrial Fundamental database. An IPO firm is designated as having Foreign sales if it has pre-tax foreign income (variable name PIFO) in the year prior to the IPO and in the IPO year.13
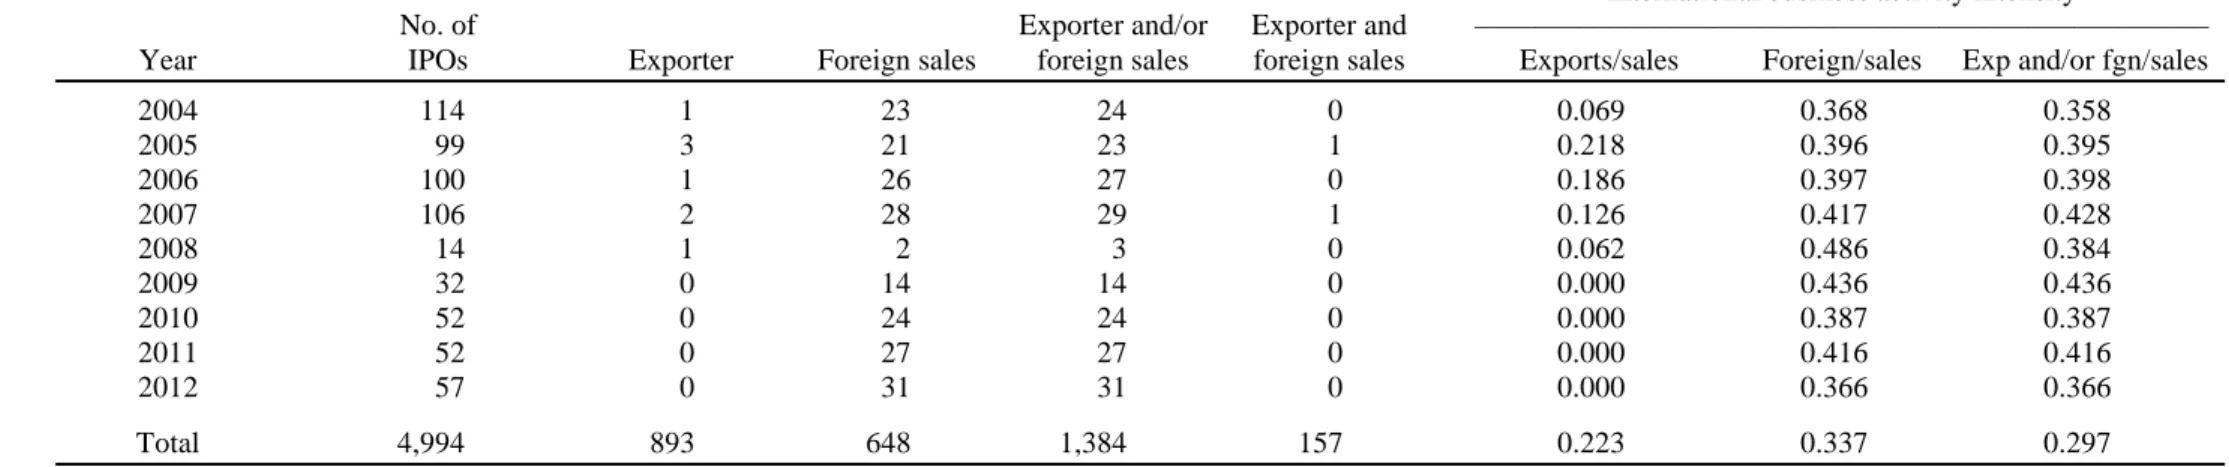
Table 1 reports the distribution of IPOs by year (Panel A) and by industry (Panel B). The table reports four groups of globally diversified IPOs: IPOs with exports, IPOs with foreign sales, IPOs with exports and/or foreign sales, and IPOs with exports and foreign sales.14 To gauge the intensity of international business activity, the three far right-hand columns of Table 1 report ratios of export sales to total firm sales, foreign sales to total firm sales, and export sales and/or foreign sales to total firm sales by year (Panel A) and by industry (Panel B). All sales figures are from the fiscal year-end prior to the IPO year.15
As seen in Panel A, about 28% of the sample has exports and/or foreign sales. For this group of IPO firms, exports and/or foreign sales are on average 30% of total firm sales. It is interesting to note that the number of IPO firms with both exports and foreign sales is small, which suggests that globally diversified IPO firms tend to focus on exporting domestically produced goods or producing goods abroad and selling them internationally (including back in the U.S.). Also note that exporting is a larger
12 An appendix is available on request that provides examples of sample firm IPO prospectuses (SEC S-1 Forms) reporting
international business activity and the potential risks and benefits arising therefrom.
13 Foreign sales information can also be obtained from the Compustat Geographic Segment database by identifying
non-domestic segments. We are cautioned by Compustat, however, that reporting of segment foreign sales is sporadic. Instead, Compustat recommends that researchers focus on firm-wide pre-tax foreign income to determine whether a firm has foreign business operations.
14
Note that the group of exporters includes IPO firms with foreign sales if the firm has both exports and foreign sales. Similarly, the group of foreign sellers includes IPO firms with exports if the firm has both foreign sales and exports.
15 We compute foreign sales as the sum of the sales of non-domestic segments reported in the Compustat Geographic
share of international business activity in the 1980s and 1990s, whereas foreign operations predominate in the 2000s.
Panel B reports the sample distribution by Fama-French industry categories. Observe that IPOs with international business activity are fairly evenly distributed across industries. Note also that when the sample is separated into high technology and non-high technology industries, a larger number of globally diversified IPO firms are in high technology industries.
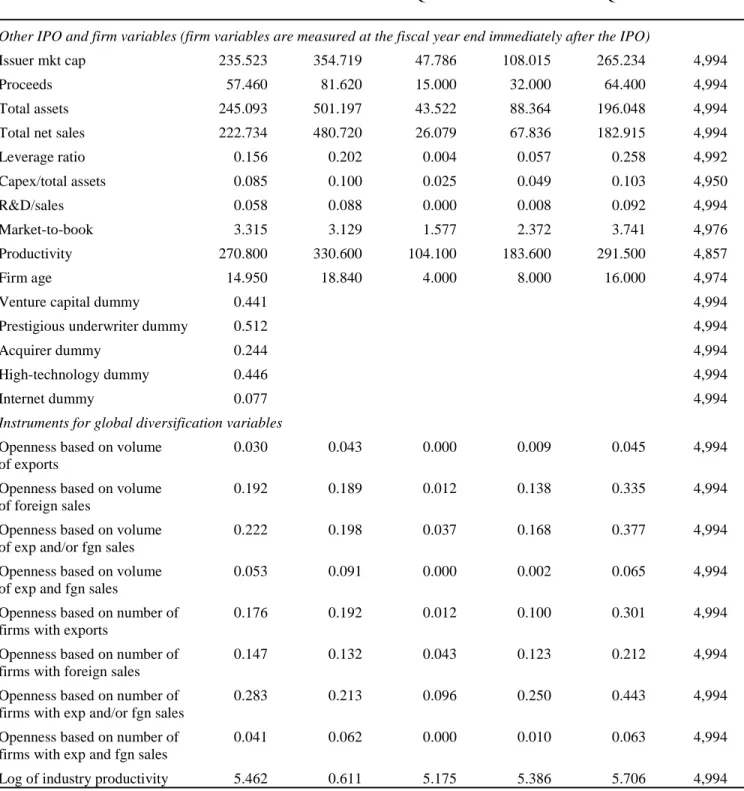
Panel A of Table 2 reports descriptive statistics for the sample. In addition to the global diversification variables, the table reports descriptive statistics for IPO initial return (Underpricing), the Butler et al. (2014) robust controls for underpricing regressions, other IPO and firm characteristics, and a list of variables that we use as instruments for the global diversification variables. Definitions for all of these variables in the order in which they appear in Table 2 are provided in the Appendix.
As discussed above, note that a significant fraction of sample IPO firms report exports and/or foreign sales (27.7%) and for these firms the mean and median fractions of firm sales generated from international business activity are 30% and 24%, respectively. Looking at IPO sample characteristics, mean (median) underpricing is 20% (8%) and IPO proceeds are $57 ($32) million. The proportions of sample IPO firms backed by a venture capital firm and offered through a prestigious underwriter are 44% and 51%, respectively. Lastly, among the many other IPO and firm characteristics reported in the table, note that the mean (median) age of the firm at the time of going public is 15 (8) years.
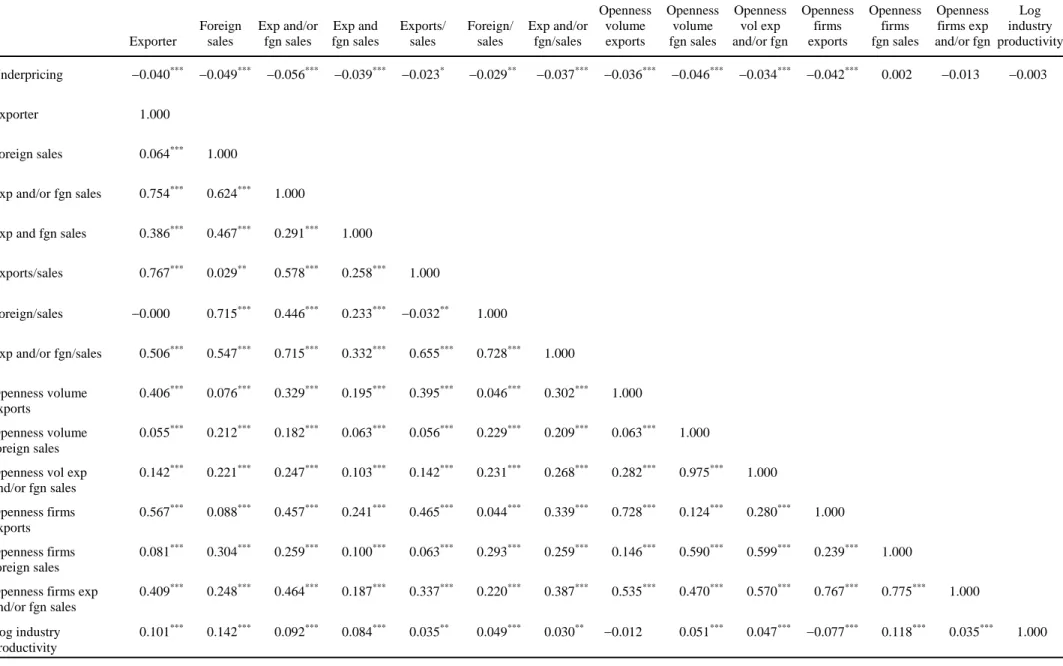
Panel B of Table 2 reports correlations between IPO underpricing, international business activity variables, and the instruments for the international business activity variables.16 The first four international business activity variables are indicator variables that are equal to one, respectively, when the IPO firm is an exporter (Exporter), has foreign sales (Foreign sales), has exports and/or foreign sales (Exp and/or fgn sales), or has both exports and foreign sales (Exp and fgn sales). The remaining
variables measure the intensity of international business. They include exports to total firm sales (Exports/sales), foreign sales to total firm sales (Foreign/sales), and exports and/or foreign sales to total firm sales (Exp and/or fgn/sales). Consistent with the notion that global diversification has a positive effect on firm value, we see that IPO underpricing is significantly negatively correlated with all of the international business activity variables. Of course, we need to control for other determinants of underpricing before we can conclude that global diversification has a separate influence on the performance of IPOs.17
4. Results
4.1. Univariate comparisons of IPOs with and without international business activity
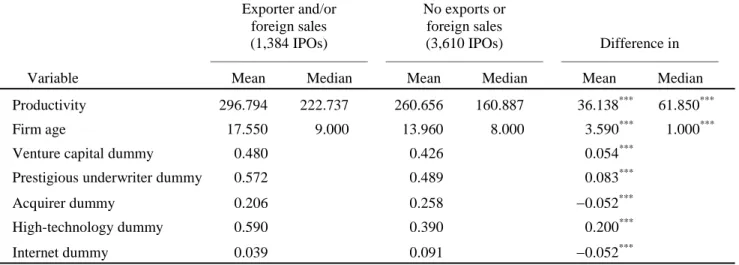
We first make a comparison of the IPO and firm characteristics of globally diversified IPOs with purely domestic IPOs. Table 3 reports mean and median comparisons between IPOs with exports and/or foreign sales and IPOs without international business activity. We see that globally diversified IPOs have lower mean underpricing than purely domestic IPOs (16% versus 21%) but identical median underpricing (8%). Comparing other characteristics, observe that globally diversified IPOs are older and more likely to have venture capital support, be brought public by a prestigious underwriter, and be in a high-technology industry than purely domestic IPOs. Globally diversified IPOs, however, are not necessarily larger. In particular, in unreported results the group of exporter IPOs is significantly smaller than purely domestic IPOs.18 Lastly, note that globally diversified IPOs are more likely to receive analyst coverage – and by a larger number of analysts – within a year of going public and are less (more) likely to be brought public during hot (cold) IPO markets than purely domestic IPOs.
17
We discuss the correlations between underpricing, the international business activity variables, and the instruments for the international business activity variables in Section 4.
18 The results on separate comparisons of exporter IPOs versus domestic IPOs and foreign seller IPOs versus domestic IPOs
4.2. Multivariate tests of the influence of global diversification on IPO underpricing
We hypothesize that global diversification decreases underpricing by reducing value uncertainty which allows the firm and its investment bank to more fully price the IPO to investors in the market. We also note that international business activity may allow for enhanced spanning of the IPO in the market or help complete the market, which should also decrease underpricing. Given the additional risks of international business activity, however, we recognize that globally diversified IPO firms may actually trade at a discount relative to purely domestic IPO firms and that therefore underpricing may be larger for such firms.
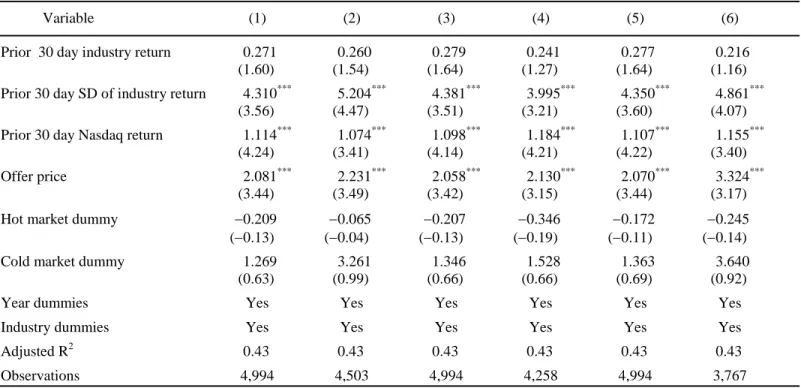
Table 4 reports regressions of IPO initial returns (i.e., underpricing) on international business activity variables and a set of control variables documented in the literature as robust determinants of underpricing. As defined above, the international business activity variables are specified as dummy variables. Models (1) and (2) use the variable Exporter, Models (3) and (4) use the variable Foreign sales, Model (5) uses the variable Exporter and/or foreign sales, and Model (6) uses the variable
Exporter and foreign sales. Models (1), (3), and (5) use the full sample. Model (2) excludes IPOs with foreign sales that do not have exports (i.e., the coefficient on the dummy variable Exporter measures the difference in underpricing between IPOs with exports and IPOs without any international business activity). Model (4) excludes IPOs with exports that do not have foreign sales (i.e., the coefficient on the dummy variable Foreign sales measures the difference in underpricing between IPOs with foreign sales and IPOs without any international business activity). Model (6) excludes IPOs that have either exports or foreign sales (i.e., the coefficient on the dummy variable Exporter and foreign sales measures the difference in underpricing between IPOs with exports and foreign sales and IPOs without any international business activity).
Among control variables, the regressions include the 15 variables in Table 4 of Butler et al. (2014) which they document are robust determinants of underpricing, except that we replace their ―News stories‖ variable with ―Number of analysts‖. Both variables are used in the literature – Cook et al. (2006) and Cliff and Denis (2004), respectively – to proxy for investment bank effort to promote an IPO. We use the I/B/E/S database for analyst information and we follow Chang et al. (2006) to define the ―Number of analysts‖ as the maximum number of analysts who make annual earnings forecasts in any month within one year after the IPO issue date.19 In addition, we use the Helwege and Liang (2004) market heat measure to construct hot and cold market dummy variables (see the Appendix for variable descriptions). Lastly, the regressions include the IPO offer price and year and Fama-French 48 industry fixed effects. We report t-statistics in parentheses below parameter estimates that are computed using robust standard errors clustered by industry.20
As seen in the table, the coefficients on the international business activity variables are all significantly negative. The coefficient estimates also appear to be economically significant. Thus, after controlling for known determinants of IPO initial returns, we see that IPO firms with exports have 3.1% lower underpricing than purely domestic IPO firms (Model (2)), IPO firms with foreign sales have 4.3% lower underpricing than purely domestic IPO firms (Model (4)), IPO firms with exports and/or foreign sales have 3.1% lower underpricing than purely domestic IPO firms (Model (5)), and IPO firms with both exports and foreign sales have 5.7% lower underpricing than purely domestic IPO firms (Model (6)). Overall, the effect of global diversification on IPO initial returns is consistent with the prediction
19 We assume that firms not covered by I/B/E/S have no analyst coverage. Our results are robust to using the variable
―Analyst coverage‖, which is a dummy variable equal to one if there is at least one analyst providing an earnings forecast for the IPO firm within one year after the IPO issue date.
20 Our results are robust if instead we cluster standard errors by year or by industry and year (i.e., two-way clustering). We do
not report t-statistics based on two-way clustering, however, because it places additional restrictions on the errors that may be unrealistic. In particular, clustering at the industry-year level assumes that for a given industry, IPO firms’ errors are uncorrelated over time. In purely cross-sectional databases such as ours, it is generally recommended to use one-way clustering with fixed effects to absorb common shocks (see, e.g., Baum et al. (2011) and Cameron and Miller (2015)).
that global diversification reduces valuation uncertainty and/or enhances spanning/completeness, thereby allowing the firm and its investment banker to more fully price the offering.
The signs of the coefficients on the control variables in the regressions are consistent with the results reported in the literature. In particular, note that the Butler et al. (2014) 15 robust control variables in Table 4 – Log firm sales through Prior 30 day Nasdaq return – have the same signs (and in general significance levels) as reported in Table 4 of Butler et al. (2014). Also note that although Offer price has a significantly positive coefficient, the hot and cold market variables are not significantly different from zero.21
Table 5 reports regressions that examine the differential effect of exporter versus foreign seller on underpricing and the impact of multiple foreign regions on underpricing. To isolate the differential effect of exporter versus foreign seller on underpricing, Models (1) and (2) include the dummy variable
exporter and are estimated using only global IPOs with exports and/or foreign sales (Model (1)) or global IPOs with exports or foreign sales (Model (2)). As seen in the table, the coefficients on exporter are not significantly different from zero which suggests that exports and foreign sales are equally effective in reducing IPO underpricing.
Models (3) and (4) in Table 5 examine the effect on IPO underpricing of having foreign sales in multiple geographic locations.22 We define the dummy variable multiple regions equal to one if an IPO with foreign sales has operations in more than one region of the world. Model (3) includes Foreign sales
and the interaction between Foreign sales and multipleregions and is estimated using the full sample of
21
Including the offer price in the regression has no impact on any of the other coefficients in the regression. Booth and Chua (1996) and Fernando et al. (2004) develop liquidity-based arguments for why offer price should be related to initial return and also find a positive relation between IPO initial return and offer price.
22
The Compustat Geographic Segment database does not provide information on the location of exports and the data for the location of foreign operations is missing for most of the sample and relatively coarse when reported (i.e., at the region level and not the country level). Thus, in our IPO sample, we have no location information for the 893 IPOs with exports and we have regional location information for only 181 of the 648 IPOs with foreign sales. The regions include Asia-Pacific, Europe, North America, South America, and Africa/Middle East. We find that 74 of the IPOs with foreign sales have foreign operations in more than one region.
global and domestic IPOs, and Model (4) includes the interaction of Foreign sales and multiple regions
and is estimated using only global IPOs with foreign sales. As seen in the table, the coefficients on the interaction variables in both Models (3) and (4) are significantly negative which suggests that the decrease in underpricing when the IPO firm has foreign sales is larger when it has operations in more than one region.
Table 6 reports regressions that estimate the effect of international business intensity on IPO initial returns. In these regressions, we examine whether the proportion of total firm sales derived from exports (Exports/sales), foreign sales (Foreign/sales), and exports and/or foreign sales (Exp and/or fgn/sales) in the year prior to the IPO influences IPO initial returns. Models (1), (3) and (5) add these intensity variables to the baseline underpricing regression, while Models (2), (4), and (6) also include the squares of the respective international business intensity variables to check for nonlinearity in the relation between underpricing and intensity. Panel A reports regressions that use the full sample of global and domestic IPOs and sets the international business intensity variables equal to zero for purely domestic IPO firms. Panel B reports regressions using the subsample of global IPO firms (i.e., only IPO firms with exports and/or foreign operations). The control variables in the regressions are the same as those used in Table 4 and are defined in the Appendix. All regressions include year and Fama-French 48-industry fixed effects. We report t-statistics in parentheses below parameter estimates that are computed using robust standard errors clustered by industry.
As seen in the table, there is generally a strong negative relation between underpricing and international business intensity in both Panel A and Panel B regressions. We do not, however, find evidence of a nonlinear relation, since the coefficients on the squared international business intensity variables are not significantly different from zero in either Panel A or Panel B. The relation between underpricing and intensity also appears to be economically significant. Using the coefficient estimates in
Model (5), a one standard deviation increase in Exp and/or fgn/sales decreases underpricing by 1.024 percentage points for the full sample of global and domestic IPOs in Panel A and by 0.697 percentage points for the subsample of global IPOs in Panel B.23
A potential concern with the regression analysis is that our international business activity variables are endogenous which would render the underpricing regression results biased and potentially misleading. To correct for endogeneity in the Table 4 specifications, we use a two stage least squares procedure suggested by Wooldridge (2002) with a probit model to predict the probability of international business in the first-stage regression.24 Thus we first estimate a probit regression for the likelihood of international business using as regressors all of the variables in the regressions of Table 4 (excluding the international business indicator variables) along with two instrumental variables. Following the international economics literature (see, e.g., Melitz (2003), De Loecker (2007) and di Giovanni and Levchenko (2009)), we use productivity and trade openness as instrumental variables for international business activity. Melitz (2003) and De Loecker (2007) establish that productivity is an important predictor of firms’ global market involvement. Following standard practice, we define productivity as the natural logarithm of one plus average industry productivity, where productivity is net sales in millions of 2009 constant dollars divided by the number of employees in thousands and industry is based on four-digit SIC code. Industry trade openness is a proxy for the likelihood of international business (because of comparative advantage in technology or endowments, or increasing returns to scale) for an average firm in the industry; it is also a good proxy for frictions associated with international business such as transportation costs, tariffs, political uncertainty, and cultural barriers (see, e.g., di Giovanni and Levchenko (2009)). Again, following the international economics literature we define trade openness as either the proportion of sales derived from international business or the fraction of
23 The computations are coefficient 5.920 × std. dev. 0.173 = 1.024 and coefficient 3.113 × std. dev. 0.224 = 0.697. 24 For the international business intensity variables, we use a Heckman selection model to control for endogeneity and
firms engaged in international business in an IPO firm’s four-digit SIC code in the year that it goes public. While industry productivity and trade openness are highly correlated with firm-level exports and foreign sales, there is little reason to believe that they have a direct influence on the underpricing of a specific firm in the industry, other than through their association with firm-level exports and foreign sales. Indeed, as seen in Panel B of Table 2, while the correlations between productivity and trade openness and the business activity variables are large and significantly positive, the correlations between productivity and trade openness and underpricing are negative but quite small.
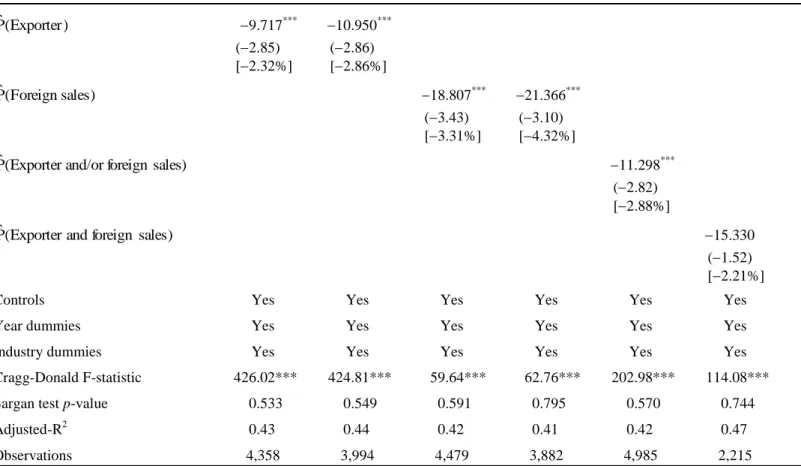
Table 7 reports second stage underpricing regressions using fitted probabilities for exporter, foreign sales, exporter and/or foreign sales, and exporter and foreign sales from first stage probit models.25 Panel A reports results for the cases where the fitted probabilities are from probits using industry trade openness based on proportion of sales from international business and Panel B reports results for cases where the fitted probabilities are from probits using industry trade openness based on fraction of firms engaged in international business.26 The results in Table 7 confirm the regression results in Table 4. There is a negative relation between IPO underpricing and the fitted probabilities of engaging in international business. In Panel A, for example, a one standard deviation increase in the fitted probability of being an exporter and/or foreign seller decreases underpricing by 4.74%, which is the same order of magnitude of the result using indicator variables in Table 4.
25
The first stage probit models are available upon request.
26 We use the Cragg-Donald statistic to assess whether the instruments are weak. When there is one endogenous regressor as
in our 2SLS models, this statistic has an F distribution under the null hypothesis that the instruments have no explanatory power in the first stage regression. With one endogenous regressor and two excluded instruments, the critical value (Stock-Yogo weak ID test) for the Cragg-Donald statistic for 10% maximal size distortion is 19.93. As can be seen in Table 7, all regressions easily exceed this critical value and reject the null hypothesis of weak instruments. Since we have two instruments and one endogenous regressor, we use the Sargan test for overidentifying restrictions to assess whether the instruments are uncorrelated with the second-stage error. If the test statistic – which is distributed chi-square – exceeds the critical value we reject the null hypotheses that the instruments are uncorrelated with the structural error and conclude that at least one of the instruments is not exogenous. As can be seen in Table 7, none of the p-values warrants rejection of the null hypothesis.
While our results strongly support the hypothesis that international business activity mitigates underpricing, it is still possible that the effects we observe are at least partially attributable to selection bias. Specifically, international business activity may proxy for (possibly unobservable) firm characteristics and firms with these characteristics self-select into foreign markets and experience lower underpricing when they subsequently go public. We mitigate selection bias using propensity score matching (PSM).27 The goal of PSM is to statistically replicate the undoable test of ―treating‖ an observation (e.g., a firm going public) with an effect (e.g., international business activity) and comparing the outcome for the treated observation to what it would be if the same observation were untreated. PSM attempts to replicate this test by matching treated and untreated observations (i.e., two different
observations) using a propensity score model that is based on a number of covariates and then comparing the outcome of interest (e.g., IPO initial returns) for the treatment and control samples. Presumably, the confounding characteristics – even the ones that are unobservable – are ―balanced‖ (i.e., the same) in the treatment and control samples and therefore the difference in outcomes between the two samples is an unbiased estimate of the treatment effect.
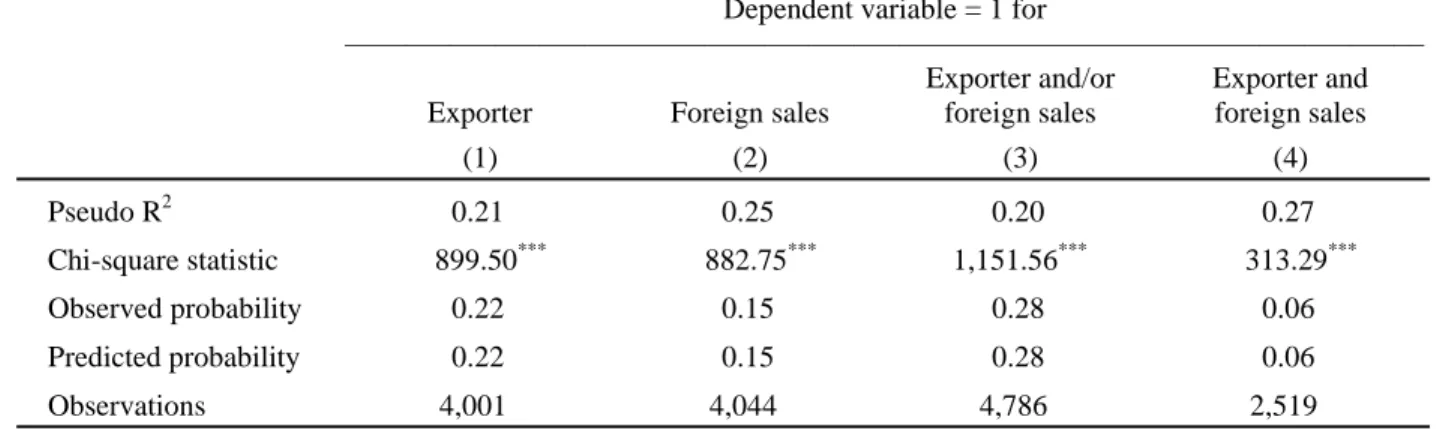
Table 8 uses PSM to match IPO firms with international business activity (treatment sample) to those without international business activity (control sample). Panel A reports the estimated probit models used to compute propensity scores (i.e., probability of international business activity) to match treatment and control firms. We estimate four models: Model (1) predicts exporter, Model (2) predicts foreign seller, Model (3) predicts exporter and/or foreign seller, and Model (4) predicts exporter and foreign seller. Following the international economics literature on the determinants of a firm being an exporter (e.g., De Loecker (2007) and Eaton et al. (2011)) or engaging in foreign direct investment (e.g., Helpman et al. (2004)), the probit models include a measure of productivity. The models also include as
covariates sales, capital expenditures, firm age, leverage, research and development, number of analysts, a prestigious underwriter dummy, a recession dummy, and industry fixed effects.28
We use the probit models to compute a propensity score for each IPO firm in the sample. Based on the propensity scores for the treated IPOs (i.e., those with international business activity) and candidate control IPOs (i.e., those without international business activity), we use nearest-neighbor (NN) matching with replacement to implement one-to-one and one-to-three matching of treatment and control samples (see e.g., Abadie et al. (2004)).29 We allow for replacement because a control IPO can be a best match for more than one treatment IPO. This process produces 8 treatment and control samples (i.e., 4 treatment and control samples based on Models (1)-(4) using one-to-one propensity score NN matching and 4 treatment and control samples based on Models (1)-(4) using one-to-three propensity score NN matching).
Panel B reports a balance test for Model (1) in Panel A where we compare the means of the covariates for the treatment group to those of the one-to-one NN matched control group. This goodness of fit test assesses whether the means of the covariates in the propensity score model are statistically indistinguishable in treatment and control groups. As seen in the panel, the balance test is easily passed. Although unreported in Panel B, all treatment and control samples pass the balance test.
Panel C reports average underpricing for treatment and control groups based on one-to-one and one-to-three propensity score matching. The panel also reports z-statistics for the difference in average underpricing that are computed using the method in Abadie and Imbens (2006).30 As seen in the panel, the treatment samples have significantly lower underpricing than the corresponding control samples and
28 All variables are defined in the Appendix and are measured in the IPO year. Results are robust if we lag the variables but
the sample size is substantially reduced because of incomplete Compustat information in firm-years prior to the IPO year.
29 Our results are robust to one-to-k matching where k = 1, 2,…5. We report results for one-to-three matching because there
is roughly one IPO with international business activity for every three IPOs without international business activity in the sample.
30 Abadie and Imbens (2008) argue that bootstrapping methods should not be used for inference with matching estimators.
We follow their prescription and compute a z-statistic using the analytical estimator of the asymptotic variance of matching estimators proposed by Abadie and Imbens (2006).
the z-statistics for the differences in average underpricing are all statistically significant at reasonable confidence levels. The large differences in average underpricing between treatment and control samples – ranging from 7.7% to 12% – strongly suggest that international business activity reduces underpricing.31
A number of additional tests were performed to assess the robustness of the relation between IPO underpricing and global diversification. First, since underpricing is right-skewed, we redo all of our underpricing results using the logarithm of one plus IPO initial return. All results, including using both dummy and continuous international business variables, are robust. Second, we redo all of our underpricing results for the sample sub-periods: 1981-2006, 2007-2009, and 2010-2012 (i.e., separating out the global financial crisis period from 2007 to 2009). We find a strong negative relation between underpricing and (dummy and continuous) international business variables during 1981-2006. The negative relation is weaker during the sub-periods 2007-2009 and 2010-2012, but this appears to be largely attributable to lower power due to smaller samples of IPOs and IPOs with international business during these sub-periods. Finally, we include a wide variety of additional variables to explain underpricing (e.g., IPO firm age, venture capital backing, underwriter rank, high-technology firm dummy, and internet firm dummy). Although many of these additional variables are related to IPO underpricing, they have no influence on the relation between underpricing and our international business variables. All of these results are available upon request.
4.3. Long-run stock market performance
Starting with Ritter (1991), a large number of studies document long-run underperformance of newly public firms. Since that time, researchers have sought to explain this phenomenon and identify
31 For a robustness check, we require that the control IPO is issued in the same year as the treatment IPO. We continue to find
factors that influence post-issue performance.32 As argued above, we hypothesize that international business activity should improve the post-issue performance of newly public firms by augmenting domestic cash flows and/or allowing for enhanced diversification of priced cash flow risks. In this section, we test this hypothesis by comparing the post-issue performance of IPO firms with and without international business activity.
Table 9 reports calendar time abnormal returns and buy-and-hold returns for portfolios of IPOs with and without international business activity over the period from 1981 to 2012. Panels A and B report calendar time abnormal returns. For each calendar month, we compute the return on equally-weighted (Panel A) and value-equally-weighted (Panel B) portfolios of firms with and without international business activity that made initial public offerings within the last 3 years and 5 years of the calendar month. Based on the monthly time series of portfolio returns, we estimate portfolio alphas using a Fama and French (1993) three factor model augmented with a Carhart (1997) momentum factor, a Cooper et al. (2008) asset growth factor, a Harvey and Siddique (2000) co-skewness factor, a Lyandres et al. (2008) investment factor, and a Pastor and Stambaugh (2003) liquidity factor. For 3- and 5-year rolling time periods, the first two columns report portfolio alphas (monthly excess return in percent) for IPOs with and without international business activity. The third column for each 3- and 5-year rolling time period reports a portfolio alpha based on the monthly time series of the difference between the returns of IPO firms with and without international business activity. The t-statistics in parentheses below portfolio alphas are computed using robust standard errors.
Consistent with studies on IPO long-run performance, we find negative alphas for portfolios of IPOs without international business activity. IPOs with international business activity, however, show positive alphas. Inspection of the coefficients in the difference columns shows that IPOs with
32 For a small sample of this work, see Loughran and Ritter (1995), Brav and Gompers (1997), Carter et al. (1998), Teoh et al.
international business activity outperform IPOs without international business activity by a wide margin. Thus, for example, for the equally-weighted portfolios (Panel A) in the 5-year window, globally diversified IPOs outperform purely domestic IPOs by 60 to 109 basis points per month. Also note that IPO firms with exports tend to have better long-run performance than IPO firms with foreign sales, but the best long-run performance is for IPO firms with both exports and foreign sales.
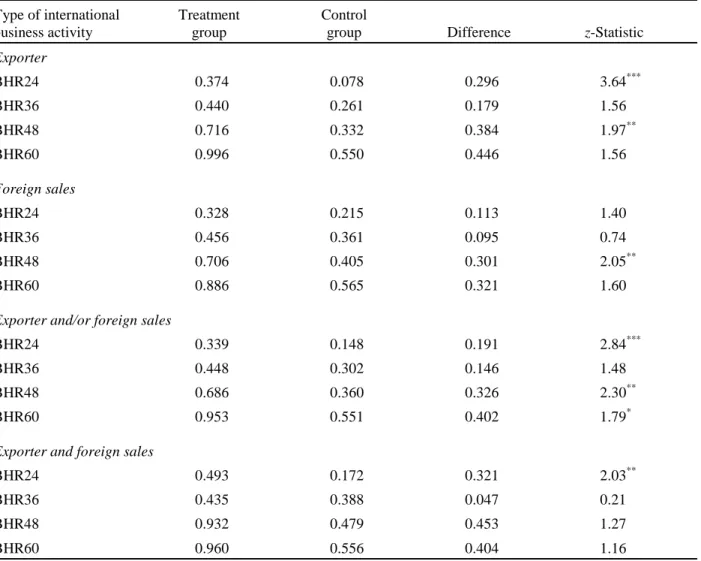
As with the analysis of IPO initial returns, we use propensity score matching (PSM) to mitigate a potential problem associated with selection bias. We use the estimated propensity score models reported in Panel A of Table 8 to construct treatment and control portfolios of IPO firms with international business activity and IPO firms without international business activity. The control portfolios are constructed using a one-to-one and one-to-three propensity score NN matching scheme with replacement. We report in Panel C of Table 9 the average buy-and-hold returns of treatment (international business activity) and control (no international business activity) firms for 24 month (BHR24), 36 month (BHR36), 48 month (BHR48), and 60 month (BHR60) periods starting from the month after the initial public offering. The z-statistics for the difference in mean buy-and-hold returns for treatment and control firms are computed using the analytical estimator of the asymptotic variance of matching estimators proposed by Abadie and Imbens (2006, 2008). To conserve space, the table reports only the results for one-to-three matching.33
As seen in Panel C, the average buy-and-hold return for the treatment portfolio is larger than that for the control portfolio for all four types of international business activity and for each holding period. Furthermore, the differences are generally economically and statistically significant. For example, focusing on the first 48 months after the IPO, we see differences of 38, 30, 33, and 45 percentage points for IPO firms with exports, foreign sales, exports and/or foreign sales, and exports and foreign sales, respectively.
Table 10 reports the results of several robustness tests. For all panels in the table, we report results only for calendar time abnormal returns of equally-weighted portfolios.34 Loughran and Ritter (2000) argue that excluding issuing firms when constructing factors is appropriate since it guarantees that the factors are not influenced by the stocks in the sample. In Panel A, we report portfolio alphas based on a purged eight factor model (i.e., the same eight factors used in Table 9) where the factors are constructed after excluding (purging) firms that have publicly issued equity in an IPO or seasoned equity offering (SEO) during the prior five years. Observe that our results – IPOs with international business activity outperform domestic IPOs in the long run – continue to hold using a purged eight-factor model.35
Ritter (2011) documents that long-run underperformance of IPO firms is present only in firms with inflation-adjusted sales less than $50 million. Since the average and median IPO firm in our sample with international business activity has inflation-adjusted sales larger than $50 million – the same is true for the sample of purely domestic IPO firms (see Table 3) – a natural question is whether the better relative long-run performance of IPOs with international business activity is confounded by size. To investigate whether size may explain our results, Panel B in Table 10 reports portfolio alphas for IPO firms grouped by whether sales in 2009 constant dollars are below or above $50 million.36 As seen there, although IPOs with inflation-adjusted sales below $50 million tend to have worse long-run performance, IPOs with international business activity generally have economically and statistically better performance than purely domestic IPOs in both the below and above $50 million dollar sales categories. For example, in the 5-year window, globally diversified IPOs outperform purely domestic IPOs by 82
34 For Panels B and C, we report results for the category exports and/or foreign sales only. Results for value-weighted
portfolios or buy-and-hold returns, and for the categories exports, foreign sales, and exports and foreign sales, are similar and are available on request.
35 Our results also are robust to 3-, 4-, 5-, 6-, or 7-factor models.
36
Of the 4,994 IPO firms in the sample, 2,057 are classified as small (sales < $50 million) and 2,937 are classified as large (sales ≥ $50 million). Of the 2,057 small IPO firms, 462 (22%) have international business activity (399 with exports, 91 with foreign sales, and 28 with exports and foreign sales); and of the 2,937 large IPO firms, 922 (31%) have international business activity (494 with exports, 557 with foreign sales, and 129 with exports and foreign sales).
basis points per month for the below $50 million dollar sales group and by 48 basis points per month for the above $50 million dollar sales group.
Panel C of Table 10 reports portfolio alphas for IPOs grouped by post-IPO acquisition activity. In particular, Brau et al. (2012) find in their IPO sample from 1985 to 2003 that only newly listed firms that acquire within a year after their IPO have poor long-run performance. Thus we group IPO firms in the sample by whether they are an acquirer in an acquisition within one year after the IPO issue date and we examine performance over 3- and 5-year windows following the first year.37 As seen in the table, we continue to find that IPO firms with international business activity outperform purely domestic IPO firms over 3- and 5-year windows in both the acquirer and non-acquirer groups.
Finally, although not reported in Table 10, we examine whether our long-run performance results are influenced by newly public firms switching from globally diversified to purely domestic or from purely domestic to globally diversified in the post IPO period. We purge the global and purely domestic IPO samples of firms that switch status in three-year or five-year periods after the IPO year and re-estimate our calendar time abnormal returns. In results that are available upon request, we continue to find that global IPOs outperform purely domestic IPOs over three- and five-year windows after the IPO for subsamples of IPO firms that do not switch.
Overall, our results show strongly and robustly that IPO firms with international business activity outperform purely domestic IPO firms after going public. An implication is that a strategy of a long position in a portfolio of IPOs with international business activity and a short position in a portfolio of IPOs with purely domestic operations can generate significant abnormal returns.
4.4. Survival analysis
37 Of the 1,384 IPOs with international business activity (exporter and/or foreign sales), 285 (20.6%) are acquirers; and of the
Another persistent phenomenon of IPOs is the poor survival rate of newly public firms.38 An interesting question is whether global diversification favorably influences survival. We can investigate this question by estimating a hazard model of the time until failure of our sample of IPOs from 1981 to 2012. Thus we test whether global diversification decreases the failure rate of newly public firms.
Of the 4,994 firms in the sample, 1,397 (28%) survive as independent standalone entities from the time of the IPO through the end of 2012, 2,595 (52%) are acquired sometime after going public, and 1,002 (20%) are delisted because of bankruptcy or liquidation. Following Krishnan et al. (2011), we define a ―survivor‖ as an IPO firm that continues to operate as an independent entity through the end of the sample period or is acquired.39 We use a Cox (1972) proportional hazard model to examine the influence of global diversification on the survival of IPO firms. In these models, the average probability of failure over a unit of time is separable into the product of a baseline hazard function that is independent of sample characteristics and a non-negative (exponential) function of a set of characteristics explaining failure. We assume that the baseline hazard function is a constant, so that the likelihood of failure is independent of the time since going public. All of our results are robust to allowing for positive or negative duration dependence. The model is estimated by maximum likelihood using a likelihood function shaped by the time to failure defined as the number of months from the IPO date to the date of delisting or the end of 2012, a dummy variable which indicates (right) censored data for IPO firms that survive beyond the end of 2012, and a set of characteristics explaining failure.
Table 11 reports results from hazard models of the effect of international business activity on IPO survival. Models (1)-(4) estimate, respectively, the effects of Exporter, Foreign Sales, Exporter and/or Foreign Sales, and Export and Foreign Sales on the hazard rate (i.e., failure rate) of IPOs.
38
For example, see Jain and Kini (2000), Fama and French (2004), and Krishnan et al. (2011).
39 We include acquired firms in the survivor group under the assumption that being acquired means that the firm is an
attractive target and therefore prospered after going public. As noted below, our results are not affected if we exclude IPO firms that are acquired from the analysis.
Following Krishnan et al. (2011), the control variables in the models include IPO proceeds, a dummy variable for venture capital support, a dummy variable for prestigious underwriter, offer price revision, logarithm of firm age at the IPO, logarithm of issuer market capitalization, and market-to-book, as well as year and industry fixed effects. All variables are defined in the Appendix.
Consistent with the hypothesis that global diversification enhances IPO firm survival, observe that the coefficient estimates on the international business activity variables are negative (i.e., international business activity decreases the hazard rate of IPO firms).40 The hazard ratios – reported in square brackets below the coefficient estimates – show that the failure rates of IPO firms with exports, foreign sales, exports and/or foreign sales, and exports and foreign sales are 71%, 67%, 72%, and 57%, respectively, of those of purely domestic IPO firms.41 The signs of the coefficients on the other variables in the models are consistent with results reported in the literature (see, e.g., Table 5 in Jain and Kini (2008) and Table 2 in Krishnan et al. (2011)). Overall, we find strong support for the hypothesis that global diversification enhances the survival of newly public firms.42
5. Conclusion
In this paper, we examine the impact of international business activity on the valuation, performance, and survival of IPO firms. We find that globally diversified IPOs have lower underpricing than domestic IPOs, which suggests that global diversification mitigates valuation uncertainty and helps promote spanning of IPO firms and market completeness. We also document that globally diversified
40
We continue to find significantly negative coefficient estimates when we replace the international business indicator variables with continuous variables based on the proportion of sales derived from international business. Results are available upon request.
41
Using the coefficient estimates on the international business activity dummy variables reported in Models (1)-(4), the hazard ratios (in percent) are computed as 100exp(0.344) = 71%, 100exp(0.397) = 67%, 100exp(0.330) = 72%, and 100exp(0.571) = 57%, respectively.
42
Our results are robust to alternative hazard model specifications such as a Weibull model or a log-logistic hazard function for the baseline hazard. Model estimates are also robust when we exclude IPO firms that are acquired and focus only on the subsamples of IPO firms that continue to operate as independent firms throughout our sample period (survivors) and that go bankrupt or liquidate (failures). All results are available upon request.
IPOs have better long-run performance than domestically focused IPOs, which indicates that international business activity contributes positively to the performance of newly public firms. Finally, we use hazard models to analyze the relation between the survival profile of IPO firms and international business activity. We find that globally diversified IPOs have a significantly lower hazard of failure in comparison to purely domestic IPOs.
The analysis makes several contributions to the literature. Ours is the first study to document the important role that global diversification plays in the pricing and subsequent performance of newly public firms. The analysis not only identifies an important new factor explaining IPO performance, it also provides a valuation dimension to the impact of international business activity on firm performance. Importantly, we also contribute to the global diversification literature that has focused on large publicly traded firms and has reached few definitive conclusions on the valuation consequences of global diversification. Overall, our results suggest that globally diversified firms going public can more fully price their shares in the market (i.e., leave less money on the table) and may have better long-run performance and survival prospects than purely domestic firms.