Review of Development Finance 20111, 28–46
Africagrowth Institute
Review of Development Finance
www.elsevier.com/locate/rdf www.sciencedirect.com
Competition in investment banking
Katrina Ellis
a, Roni Michaely
b,c,∗, Maureen O’Hara
caAustralian Prudential Regulation Authority, Australia bIDC, Israel
cCornell University, United States
JEL CLASSIFICATION G14; G20; G24 KEYWORDS Investment banking; Competition; Analyst recommendations; Equity issuances; Debt issuances; Reputation; Fees
Abstract We construct a comprehensive measure of overall investment banking competitiveness for follow-on offerings that aggregates the various dimensions of competition such as fees, pricing accuracy, analyst recommendations, distributional abilities, market making prowess, debt offering capabilities, and overall reputation. The measure allows us to incorporate trade-offs that investment banks may use in competing for new or established clients. We find that firms who switch to similar-quality underwriters enjoy more intense competition among investment banks which manifests in lower fees and more optimistic recommendations. Investment banks do compete vigorously for some clients, with the level of competition related to the likelihood of gaining or losing clients. Finally, investment banks not performing up to market norms are more likely to be dropped in the follow-on offering. In contrast, firms who seek a higher reputation underwriter face relatively non-competitive markets.
© 2010 Production and hosting by Elsevier B.V. on behalf of Africagrowth Institute.
Investment banks play a crucial role in the capital raising process for firms. Recently, the nature of this role has come under increasing scrutiny, as evidenced by myriad investigations (and lawsuits) alleg-ing collusive behavior, corrupt practices, and rapacious behavior by investment banks in the equity raising process. Specific allegations of misbehavior include biased analyst reports, after-market trading scandals, price-fixing, and collusion in the allocation and
distribu-∗Corresponding author.
E-mail address:rm34@cornell.edu(R. Michaely).
1879-9337 © 2010 Production and hosting by Elsevier B.V. on behalf of Africagrowth Institute.
Peer review under responsibility of Africagrowth Institute, Republic of South Africa.
doi:10.1016/j.rdf.2010.10.004
Production and hosting by Elsevier
tion of offerings. The recent Global Settlement separating research from the underwriting process is but one example of the regulatory concerns with the competitive nature and practices of this industry. Despite these concerns, the exact nature and extent of competi-tive behavior in investment banking remains elusive. The difficulty in evaluating the competitive process stems from its complex-ity: underwriters provide a panoply of services, and so potentially compete through fees, pricing accuracy, analyst recommendations, distributional abilities, market making prowess, debt offering capa-bilities, and overall reputation. There is a large literature in finance examining investment banking and much of this work has focused on individual components of the competitive process, showing that pro-vision of these services is linked with being an underwriter.1What
1For example, fees inChen and Ritter (2000),Burch et al. (2005); pricing discounts inCorwin (2003); analyst coverage inCorwin and Schultz (2005), Ljungqvist et al. (2006),Michaely and Womack (1999); market making in Ellis et al. (2000); reputation inKrigman et al. (2001); and other services in Benzoni and Schenone, 2010,Corwin and Schultz (2005),Drucker and Puri (2005), andBharath et al. (2005).
Open access under CC BY-NC-ND license.
is not apparent from extant research is how all of these dimensions combine to determine the overall nature of competition in invest-ment banking. Do investinvest-ment banks compete across the board in all these competitive dimensions, or do they take a strategy of compet-ing along some dimensions and becompet-ing less competitive along others? Or might they not compete at all, relying instead upon intangibles, such as market power and reputation to attract or retain business?
In this research, we seek to understand competition in investment banking at this aggregate level. To do so, we first address the basic question: How do underwriters compete for equity underwriting mandates? We conduct our analysis in the context of the market for underwriting services for follow-on equity offerings. This junction is particularly well suited for our purpose because many firms change underwriters from one equity offering to the next (seeKrigman et al., 2001). In this process, investment banks can compete on many dimensions to attract new clients or to retain old ones, such as fees and discounts2, reputation, analyst coverage, debt market capac-ity, and market making prowess. We investigate how these factors influence a firm’s decision to retain or switch its underwriter.
While previous literature examines several aspects of compet-itive behavior across all potential underwriters, we focus most of our attention on the competitive behavior of the dominant partic-ipants. In this sense, our analysis can be viewed as a conditional analysis, compared with the unconditional analysis via a McFad-den choice model (seeCorwin and Schultz, 2005; Yasuda, 2005; Drucker and Puri, 2005). In these models, the authors use a pool of potential underwriters and the unconditional probability of being selected as an underwriter based on a particular investment-banking characteristic. We use this approach and find results similar to prior literature, but also find that most potential underwriters are pas-sive, so including them in the analysis masks important differences between those who win the deal and those who do not. Therefore, our main focus is on the variation in investment banking characteris-tics, conditional on being chosen as an underwriter. The conditional analysis enables us to gain insights that are unattainable from the unconditional analysis alone. For example, compared to all potential underwriters, having a prior debt relationship with the equity-issuer is an important element in winning a deal. However, among those banks that are really in the running, prior debt relationship is not a distinguishing feature.
Rather than analyzing each element of the investment banking service to equity-issuer firms in isolation, we develop a comprehen-sive measure of overall investment banking competitiveness that captures non-price competition (e.g., reputation) as well as price competition (e.g., fees). This measure, the first that we are aware of to aggregate the various dimensions of competition, allows us to incorporate trade-offs that banks may use in competing for new or established clients. Thus, we are able to capture whether banks that charge higher fees compensate with better analyst coverage, market making activity, or the like, and whether banks choose to compete more vigorously for some types of clients than for others.
We hypothesize that if the market for underwriting is competitive then, after controlling for deal attributes, the overall competitiveness measure will be the same across firms. If, however, the market for underwriting is not competitive, then underwriters may or may not provide services to a firm, and the overall competitiveness measure for such deals will differ.
2 As there is a prevailing market price for a seasoned equity offering, the discount refers to the difference in price between the last closing price and the offering price.
Using our competitiveness measure, we develop logistic regres-sions to estimate the likelihoods of losing or gaining an underwriting client. These regressions provide empirical evidence of the relative importance of the various elements of competition.
Our analysis on the extent of competition provides a number of important findings, four of which we highlight here. First, we find that the degree of market competitiveness is related to the motive for switching. Firms who seek a higher reputation underwriter face relatively non-competitive markets: underwriters offer few other inducements to switch, and “upgrading” firms pay higher fees to do so. Similarly, firms whose own performance has been weak may find their previous underwriter unwilling to continue in that capacity, and these switching firms also face higher fees and little competi-tion for their business. This difficulty highlights the fact, also noted byFernando et al. (2005), that competition in investment banking is best viewed as a matching problem: due to the prominent role of reputation, both investment banks and firms are careful about the company they keep.
Second, we show that investment banks do compete vigorously for some clients, with the level of competition related to the likeli-hood of gaining or losing clients. Investment banks reward loyalty, and non-switching clients tend to pay lower fees, and have more pos-itive analyst ratings.3Interestingly, loyalty also goes both ways, as clients who enjoy better service before their new offerings are much more likely to remain with their underwriters. For customers who do switch to similarly ranked underwriters (so-called ‘lateral’ switch-ers), our overall competitive measure shows greater competition for these clients.
Third, we find that investment banks not performing up to market norms are more likely to be dropped in the follow-on offering. These norms differ across the various dimensions of competition: analyst recommendations below or even at the norm induce exit, with firms generally moving to a bank with a more optimistic view. Conversely, while market making below the norm also induces exit, issuers move to firms already dominant in market making only 30% of the time. Overall, our results suggest that aggressive investment banks are able to steal customers away from incumbent banks that perform below par, a result in accord with markets being competitive.
Fourth, we also develop a measure of investment bank loy-alty. When we examine competitiveness at the investment bank level, rather than per deal, we find that the investment banks that are more competitive have more loyal clients. This sug-gests that although investment banks may selectively compete for some deals more than others, there are also differences between banks in average competitiveness, which corresponds to client loyalty.
Because our analysis of the overall competitiveness of the mar-ket necessarily requires analyses of the specific dimensions of this competition, our work also contributes to the extensive literature looking at the specific elements of investment banking. In particu-lar, our results on fees, pricing, analyst coverage, market making, and ancillary services complement, extend, and occasionally con-tradict findings in this very large literature. With respect to fees, for example,Chen and Ritter (2000)show a cross-sectional variability in fees for follow-on equity offerings, a result we also find.Burch et al. (2005)also examine fees in follow-on offering, but while they find that switchers to “better” underwriters pay lower fees, we find
3 These results are also consistent withDiamond (1984, 1991),Peterson and Rajan (1994)andSchnenone (2004)that banks with existing relationship with a firm obtains information about the firm that others do not have.
30 K. Ellis et al. the opposite. Switching firms in our sample, whether they move up
or down, pay higher fees.4
Another dimension of competition is the issue price, measured as the discount relative to the previously traded price. The invest-ment banks’ pricing discretion here is limited since a market price for the securities exists long before the announcement or pricing of the follow-on offering. Existing evidence (e.g.,Corwin, 2003) indicates an average discount of about 2 percent, with a significant cross sectional variation in the underpricing. The mean discount in our sample is 2.8%, and we find that, as with fees, firms switch-ing to more reputable underwriters experience higher underpricswitch-ing discounts.
The extent and enthusiasm of analyst coverage is also important to issuers.Krigman et al. (2001)show that firms switch banks to gain analyst coverage, yetLjungqvist et al. (2006)find that optimistic analyst recommendations do not lead to underwriting business.5 Michaely and Womack (1999)show that affiliated analysts are more optimistic than unaffiliated analysts, both at the time of the IPO and the follow-on offering.Clarke et al. (2007)find that coverage by an all-star analyst increases investment bank deal flow, and, conversely, Cliff and Denis (2004)show that firms are more likely to switch if the old investment bank was not providing a recommendation on the anniversary of the IPO date. We find that active analyst coverage prior to the offering helps retain clients, and when reputation is not the drawing card, investment banks do compete for business by providing optimistic analyst coverage prior to the offering. Thus, our results suggest that failure to take account of the motives for switching and their effect on investment bank competitiveness may account for the sometimes conflicting results in this area.
As has been well established, reputation effects are important to some issuers, and these issuers switch underwriters simply to be connected with a higher quality underwriter.Krigman et al. (2001) show that “graduating” issuers attach a lesser importance to the actual performance of their old underwriter than do issuers who do not move up. Similar toKrigman et al. (2001), we find that reputation plays an important role in inducing firms to switch underwriters.6
Liquidity provision also matters for publicly traded firms, par-ticularly for smaller firms (e.g.,Ellis et al., 2000). Investment banks typically opt to act as a dealer in a stock, but the extent of their market making activity can vary dramatically. Empirically we do
4 This difference between our work andBurch et al. (2005)may reflect different sample periods, or differences in the factors included in defining firm loyalty.
5 Ljungqvist et al. (2006)find that unconditionally winning banks provide more optimistic recommendations than losing banks, a result they attribute to economic incentives, i.e., career concerns of analysts, and pressure from investment banks. They conclude that optimistic analyst recommendations do not affect the probability of winning underwriting business. In their analysis, analyst recommendations are determined endogenously by the competing forces of pressure from the investment bank to recommend a potentially lucrative client, versus the analyst’s interest in protecting his or her reputation. Since our focus is the overall competition for underwriting business, we do not focus on why an analyst is providing a recommendation. 6 Another view is that firms and banks select each other. Not only do firms look at the quality of the investment bank they are hiring, but invest-ment banks examine the quality of the firms they are underwriting. Firms that improve (decline) in quality will switch to a higher (lower) reputation underwriter, whereas firms with no large change in quality are likely to form a stable relationship with an underwriter. Similarly, if the quality of the underwriter changes over time, then firms may switch if the quality of the current underwriter no longer matches the firm’s quality (see, for discussion, Fernando et al., 2005).
not find market making activity to be an important element in the selection of a new underwriter. At the same time, underwriters that perform below the norm along this dimension are less likely to be retained.
Investment banks also compete by providing ancillary services such as loans, underwriting debt offerings, and advising on merger activity. Several papers examine the link between bank lending and equity underwriting (e.g.,Drucker and Puri, 2005; Ljungqvist et al., 2006; Bharath et al., 2005).Drucker and Puri (2005)provide evi-dence that investment banks that underwrite debt offerings around the time of equity deals reduce the amount they charge for issuing equity for the firm.Ljungqvist et al. (2006)andBharath et al. (2005) suggest that prior debt underwriting relationships and lending rela-tionships increase the likelihood of winning deals. Consistent with their results, we find that underwriters who retain clients are more likely to have a prior debt underwriting or lending relationship with the firm compared to other underwriters. However, we find that when a firm switches investment banks, the new lead underwriter does not have a stronger debt relationship with the firm than the old lead underwriter did. Overall, we find limited public-debt-issuance activity around the time of the equity offering (around 6% of the sample) for the follow-on offerings in our sample.7
The paper is organized as follows. Section2sets out our sam-ple, the data we use, and details the characteristics of the issuing firms and the underwriters of these issues. In this section, we also provide results on overall switching behavior, and the movement of issues to better quality, lateral quality, and lower quality underwrit-ers. Section3then examines the elements of competition by looking at fees and discounts, analyst recommendations and market making activity around follow on equity offerings. In Section4we look at the overall competition for these offerings. We develop our aggre-gate measure of underwriter quality and show how it relates to the elements of competition developed in Section3. We also develop a measure of underwriter loyalty and relate this to the competitiveness of the underwriter in attracting and retaining clients. We then pro-vide logistic regressions modeling the probability of losing a client, and the likelihood of gaining a client. The paper’s final section sum-marizes our results and provides some conclusions on the nature of competition in investment banking.
1. Data and preliminary analysis: offerings, underwriters, and issuers
1.1. Sample selection
We obtained a sample of U.S. seasoned equity offerings during the period 1996–2003 from the SDC global offerings database (4365 offerings). To ensure comparability across sample firms, we exclude offerings that were registered as shelf offerings under SEC Rule 415 (1203 offerings), and offerings that were entirely secondary shares (380 offerings).8 We excluded 41 firms that had joint lead
7Many of the firms in our sample (1148) have private debt initiated during the 5 years before the follow-on offerings but of these, only 31 are with the underwriter of the follow-on offering. Sample differences, particularly with respect to shelf registered issues, are likely the reason for the different findings here and inDrucker and Puri (2005).
8Because of the different process governing disclosure and distribution of shelf-registered offers, the under-pricing discount, analysts’ and market mak-ing activity prior to the offermak-ings cannot be compared to non-shelf offermak-ings. Secondary share offerings are more akin to large block trades by insiders
underwriters as these underwriters share the responsibility for the offering, and this could affect the underwriter behavior studied here. We also excluded offerings by foreign firms; OTCBB or Nasdaq small cap offerings; closed-end funds, and real estate investment trusts; ADRs, or securities with warrants attached. Finally, we also deleted a number of offerings due to missing data: not underwritten or no identifiable underwriter in previous equity deals. The final sample is 1277 follow-on offerings. We allow firms to have multiple follow-on offerings in our sample.
To determine whether firms switched underwriters or not, we examined the SDC database for previous equity offerings by the same issuer since 1990, and noted the identity of the lead underwriter in the most recent equity offering prior to the sample event. One difficulty that arises in doing so is that over this sample period there were a number of mergers of investment banking firms. We collected information on all of these mergers, and we then designated as part of the successor investment bank any merger partners. Thus, an issuer using Alex Brown as the underwriter for its IPO and Deutsche Bank as the underwriter for its follow-on offering would be classified as a non-switcher for purposes of this analysis because Alex Brown is now a part of Deutsche Bank.9
We obtained monthly market making volume data from the Nas-daq for January 1996–March 2002 for a subset of 885 NasNas-daq firms in our sample. Analyst coverage and recommendations were pro-vided by IBES. Daily trading price data are from CRSP. Public debt underwriting data are collected from SDC debt offerings and we include all debt issued within five years prior to the equity offering date and identify the lead underwriter of the debt offering. Private loan underwriting data are collected from Dealscan. For the private loans we identify the loan arranger and include loans during the five years prior to the equity offering.
There are 79 distinct lead underwriters for the 1277 offerings in our sample. Collectively, the 10 most active underwriters cover approximately 76% of the dollar value of follow-on offerings in our sample. As a simple measure of underwriter reputation, we ranked lead underwriters of the universe of equity offerings dur-ing 1996–2003 usdur-ing the Carter and Manaster ranks (seeCarter and Manaster, 1990for discussion).10These ranks range from 1 to 9, with more prestigous underwriters having higher ranks.
1.2. Switching and non-switching issuers
The issues surrounding the retention of existing clients and attracting new ones can be developed more fully by considering the frequency with which issuing firms switch underwriters for the follow-on
offer-desiring liquidity, as opposed to the more standard offering motivation of firms seeking to raise capital.
9 Alex Brown was purchased by Bankers Trust in 1997. Banker’s Trust was then taken over by Deutsche Bank in 1999.
10We use the Carter–Manaster reputation variable, rather than the Megginson and Weiss (1991)market share variable as our measure of repu-tation because we want to compare repurepu-tation across investment banks and the CM rank facilitates this. For example, many investment banks have the same rank (e.g. Goldman Sachs and Citigroup both have CM rank 9), so we can differentiate between small changes in reputation (one rank above or below) versus large changes in reputation which involve moving several CM ranks. By contrast, the MW reputation measure is a continuous variable, and thus classifying a difference in market share as small or large would be arbitrary. We redid our anaysis using the MW measure instead of the CM measure, but the results were so similar that we report here only those based on the Carter–Manaster ranking.
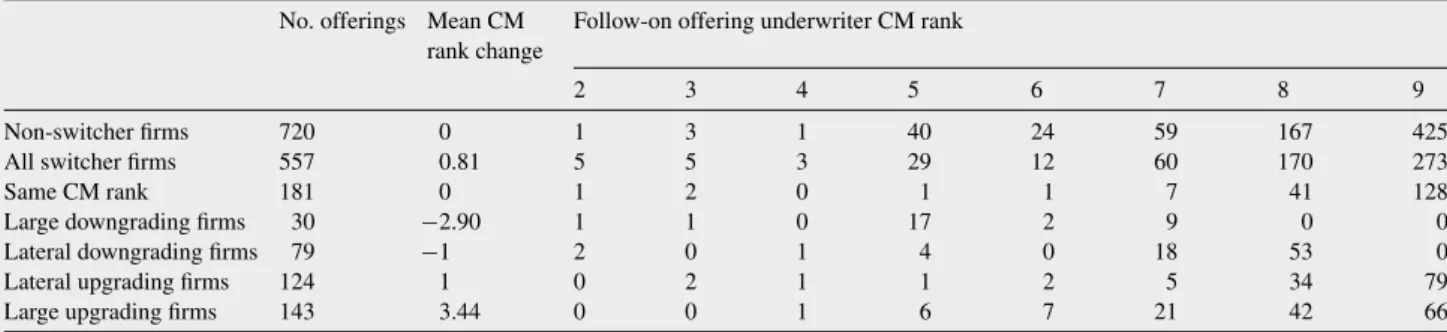
ings in our sample. Table 1 shows that switching is a frequent event: 44% of issuing firms (557 out of 1277) switched underwrit-ers from their previous offering. This figure is higher than the 31% reported byKrigman et al. (2001), and it is consistent with changes in the investment banking industry landscape, such as the demise of the Glass-Steagall Act, having increased competition in the more recent sample period we study here.11For our purposes, the fact that almost half of the follow-on offerings are being led by a new under-writer suggests that there is significant competition for underwriting follow-on offerings.
Where do these switching firms go? We identify five groups of switching firms based on the difference inCarter and Manaster (1990)reputation ranks of the current and prior lead underwriters.12 We find that most firms switch to an underwriter of either the same CM rank, or one rank above or below, and thus use these as cutoffs to separate our switching firms. One-third of the switching firms (181 out of 557) aresame rankswitchers: they change to a lead underwriter that has the same CM rank, with most of these under-writers having high ranks (8 or 9). A small number (30) of our issuers arelarge downgraders: issuers that change to an underwriter who is more than one CM rank below the prior underwriter, with the average issuer selecting an underwriter 2.9 ranks below the prior underwriter. Seventy-nine firms arelateral downgraders, moving down one CM rank: most frequently from 9 to 8, or 8 to 7. Another group of 124 switching firms arelateral upgraders, moving up one CM rank and most frequently moving from 7 to 8, or 8 to 9. The remaining 143 switching firms are thelarge upgraders: firms that switch to an underwriter of much higher reputation than their prior underwriter (more than one CM rank above). The average change in reputation is 3.44 CM ranks for the large upgraders, with most firms moving to an underwriter ranked 7, 8 or 9 on the Carter–Manaster scale.
1.3. Offering statistics
The offerings in our sample are typical of the follow-on offerings studied in other research. InTable 2we report a wide range of descriptive statistics, with means and medians given to reflect the diversity in the underlying sample. The average issuer has a market capitalization of approximately $1 billion, they have not had a pre-vious offering in more than 2 years (837 days), the offering amount is around $130 million, mostly primary shares. Fees average 5.19%, there is a negative share price announcement effect (−2.27%), and a further price discount connected with the offering (−2.79%).
Table 2 also shows important differences between switch-ing issuers and non-switchswitch-ing issuers. Non-switchswitch-ing issuers, and issuers that switch to a same rank investment bank, tend to be larger and the offering size is larger as well. The average fees paid by non-switchers are only 5.01%, significantly lower than the fees paid by switching firms. A smaller fraction of shares are primary shares for non-switchers than for switching firms. Breaking the switching sample down further reveals that large movers (in terms of upgrad-ing or downgradupgrad-ing by more than one Carter–Manaster rank) are generally much smaller firms. Gross spreads for large movers are
11 If we limit our sample to the 754 equity offerings that are the first sea-soned offering since the firm’s IPO, our rate of switching is 38% which is still higher than theKrigman et al. (2001)study, suggesting that switching may have increased over time.
12 As our sample is from 1996 to 2003 we use updated Carter–Manaster ranks available on Jay Ritter’s website.
32 K. Ellis et al.
Table 1 Frequency of switching and change in underwriter quality. This table shows the number of firms in our sample of 1277 that change lead underwriters from the prior equity offering to the sample offering. Non-switcher firms retain the same lead underwriter from the prior offering. Five sub-groups of switchers are identified based on theCarter and Manaster (1990)(CM) rank of the lead underwriter: Same CM rank are those firms that switch to another investment bank with the same CM rank; large downgrading (upgrading) firms are those that move to an underwriter with a lower (higher) CM rank and the difference in rank is greater than one. Lateral downgrading (upgrading) firms are those that move to an underwriter with a CM rank that is one rank below (above) the prior underwriter’s CM rank. The mean change in CM rank from the prior underwriter to the current underwriter is calculated for each sub-group. The frequency of lead underwriters with CM ranks 2–9 are given for each subgroup, with 9 being the highest Carter–Manaster rank.
No. offerings Mean CM rank change
Follow-on offering underwriter CM rank
2 3 4 5 6 7 8 9
Non-switcher firms 720 0 1 3 1 40 24 59 167 425
All switcher firms 557 0.81 5 5 3 29 12 60 170 273
Same CM rank 181 0 1 2 0 1 1 7 41 128
Large downgrading firms 30 −2.90 1 1 0 17 2 9 0 0
Lateral downgrading firms 79 −1 2 0 1 4 0 18 53 0
Lateral upgrading firms 124 1 0 2 1 1 2 5 34 79
Large upgrading firms 143 3.44 0 0 1 6 7 21 42 66
also significantly higher than they are for switchers in general, and higher still than for non-switching firms. Interestingly, announce-ment effects are least negative for the large up-or-down switchers, but their price discounts are largest.
TheF-statistics in the last column demonstrate that the means of the descriptive statistics of the various categories of sample firms (switchers/non-switchers, large switchers/small switchers, etc.) are significantly different from each other. This variability suggests that the follow-on offering process results in a wide diversity of outcomes for issuers and investment banks alike. In the next sections, we inves-tigate this diversity by analyzing the main elements of competition in the follow-on offering process.
2. Elements of competition
2.1. Are investment banks active?
As our focus is on the cross-section of lead underwriters, rather than comparing lead underwriters to non-underwriters, it is important to first establish that this focus is appropriate. Other work has compared the behavior of lead underwriters to unaffiliated investment banks13 and shown that analyst coverage and debt underwriting is linked to becoming the lead underwriter. As we are examining market making in addition to these services, we could potentially have a large pool of investment banks with whom to compare the lead underwriters. Table 3shows the pool of investment banks for our deals: the total number of investment banks is 411 per deal.
However when we focus on investment banks that are actively involved with the firm prior to the offering, the numbers drop dras-tically. For example, the average firm in our sample only has 3.7 investment bank analysts providing buy/sell recommendations 90 days prior to the offering, and has only 0.7 investment banks acting as a debt underwriter or loan arranger in the five years prior to the deal. For the subset of our sample that trades on Nasdaq, there are 16.6 investment banks acting as market makers three months prior to the deal.
13Commercial banks that underwrite equity deals are included in our sam-ple as investment banks.
Overall, for non-Nasdaq firms, the number of investment banks that are either providing analyst coverage or have arranged a loan, excluding both the current and prior lead underwriter is 4.3. When we limit this further to investment banks that have a CM rank at least as high as the lead underwriter, there are on average 1.5 such investment banks per company. For Nasdaq firms, there are 17.3 active investment banks (act as a market maker, provide analyst coverage, or have arranged a loan) but only 4 investment banks that are also ranked at least as highly as the lead underwriter. These numbers suggest that it is rare to find investment banks with links to equity-issuing companies, and including all investment banks in the pool of potential underwriters would result in the inclusion of many inactive underwriters.
In addition, despite the low frequency of active investment banks, the majority of current and prior lead underwriters are active. For Nasdaq firms, the current lead underwriter is active1486% of the time, while the prior lead underwriter is active 95% of the time. For non-Nasdaq deals, the current lead underwriter is active 63% of the time and the prior lead is active 60% of the time. These participation rates vary across switching, in particular for the non-Nasdaq switching deals, the current lead underwriter is only active 47% of the time.
Given the infrequency of links between non-underwriting invest-ment banks and equity-issuing firms, and the contrasting high frequency of links between underwriters and equity issuers, it is not surprising that prior work has found strong connections between analyst coverage, debt underwriting and the likelihood of being cho-sen as an underwriter. However, it does also suggest that comparing non-underwriters to underwriters results in comparing two distinct groups. Thus, we choose to focus on examining the cross-sectional differences among lead underwriters, and also in comparing new lead underwriters to prior lead underwriters.
14An active investment bank provides analyst coverage 90 days prior to the deal or has arranged a loan in the last 5 years or acts as a market maker three months prior to the deal.
Table 2 Descriptive statistics. Summary statistics of the sample of 1277 NYSE, AMEX and Nasdaq follow-on equity offerings during 1996–2003. Market capitalization is the market value of equity on the day prior to the offering in millions. The offering details are: dollar value of the equity offering in millions (offering amount), number of shares in the offering in millions (shares offered, price of the SEO in dollars (offer price), fraction of the offer that is new shares rather than insider sales (primary shares), fraction of the company that is being sold (float), fee paid to underwriters (gross spread), lockup days following SEO (lock-up period). Price reactions around the SEO are: three-day cumulative abnormal return around filing date of offering (announcement return), one year cumulative abnormal return prior to filing date (one year CAR), percent difference between closing price on the day prior to the offering and the offering price (pricing discount), standard deviation of returns over 90 days prior to filing date (price volatility). Time from filing to offer date is measured in days (days from filing to completion) and the time since the last equity offering is measured in days (days since last offering). Underwriter reputation is measured by the Carter–Manaster rank for the lead underwriter of the last equity offering (old lead CM rank) and current lead underwriter (new lead CM rank). The frequency of old lead underwriters acting as a co-manager is given for the deals with new lead underwriters. The four debt variables measure the frequency of the old/new lead underwriter acting as lead underwriter for a public debt offering or arranger for a syndicated loan.
Whole sample Non switcher Large down Lateral down Same rank Lateral up Large up Test for equality
No. obs. 1277 720 30 79 181 124 143 Market cap Mean 1007.9 1220 303 477 1317 585 360 5.9 Median 414.6 475 154 311 523 327 208 103.7 Offering amount Mean 133.4 153.6 47.7 77.2 166.7 98.1 68.8 8.9 Median 79.8 92.4 43.8 58.8 80.3 73.0 53.0 99.1 Primary shares Mean 76.9% 71.9 90.5 84.7 82.9 81.6 82.8 11.7 Median 88.9% 80 100 100 99 95 94 62.1 Float Mean 23.2% 22.5 30.1 21.9 20.4 24.9 27.4 4.6 Median 19.9% 19 22 21 17 23 24 26.1 Gross spread Mean 5.19% 5.01 5.86 5.50 5.11 5.33 5.72 30.9 Median 5.23% 5.00 5.80 5.50 5.19 5.26 5.75 159.2 Announcement return Mean −2.27% −2.40 0.78 −2.11 −2.38 −2.65 −1.93 1.1 Median −2.43% −2.52 1.20 −1.70 −2.35 −3.45 −2.34 7.5
One year CAR
Mean 75.2% 68.5 98.0 93.8 83.4 80.9 78.3 4.6 Median 61.0% 56.7 80.6 82.8 66.4 61.2 65.5 17.5 Pricing discount Mean −2.79% −2.37 −4.43 −4.13 −2.72 −2.57 −4.15 12.3 Median −1.96% −1.62 −4.16 −3.05 −2.06 −1.96 −3.27 48.8 Price volatility Mean 4.38% 4.50 4.65 4.67 4.10 4.03 4.23 2.1 Median 3.88% 3.79 4.32 4.37 3.66 3.75 3.96 7.9
Days between filing and completion
Mean 35 32 46 38 36 36 43 7.9
Median 29 27 40 30 30 30 36 79.5
Days since last offering
Mean 837 547 1733 1421 1265 1087 1023 71.7
Median 555 343 1647 1322 1149 897 839 305.5
Old lead CM rank
Mean 7.82 8.25 8.4 8.34 8.55 7.43 4.62 219.5
Median 8 9 9 9 9 8 5 480.1
New lead CM rank
Mean 8.16 8.25 5.5 7.34 8.55 8.43 8.06 45.5
Median 9 9 5 8 9 9 8 190.3
Old lead is co manager
Mean 36.7% – 10% 20.3% 38.1% 42.7% 44.1% 6.2
34 K. Ellis et al.
Table 2 (Continued)
Whole sample Non switcher Large down Lateral down Same rank Lateral up Large up Test for equality New lead public debt
Mean 4.46% 5.97% 0.00% 3.80% 3.31% 3.23% 0.70% 2.2
Median 0 0 0 0 0 0 0
Old lead public debt
Mean 4.69% 5.97% 0.00% 0.00% 6.63% 4.03% 0.00% 3.4
Median 0 0 0 0 0 0 0
New lead private debt
Mean 4.53% 5.97% 3.33% 3.80% 4.97% 5.65% 3.50% 0.4
Median 0 0 0 0 0 0 0
Old lead private debt
Mean 5.39% 5.97% 0.00% 2.53% 4.97% 2.42% 0.00% 2.8
Median 0 0 0 0 0 0 0
2.2. Fee and price competition
For equity offerings, firms incur direct cost through underwriting fees as well as indirect costs via the discount of the offer price rela-tive to the prevailing market price. As noted inTable 2, average fees are 5.19% of the proceeds, and the average discount is 2.79%. While there is no discernable pattern in fees and discounts over time, there is a considerable cross-sectional spread in the fees paid, ranging from 1.45% to 8.91% and the pricing discount ranges from−26% to +13%. Consistent withBurch et al. (2005), non-switching firms pay lower fees than switching firms, and this difference of 40 basis points is statistically significant. These lower fees for repeat clients are consistent with a strategy by the underwriter to retain loyal busi-ness. Loyal firms are also rewarded via a smaller pricing discount:
−2.37% versus−3.35% for firms that switch underwriters.
We investigate how deal complexity affects the deal’s compet-itive cost using multivariate regressions with either fees or pricing discount as dependent variables. As independent variables, we con-trol for the difficulty of the marketing efforts and the due diligence required for the deal via size, measured as the log of the offering pro-ceeds, and stock price uncertainty, proxied by the standard deviation of the return over three trading months prior to the announcement of the offering. We also control for the change in the firm’s outlook proxied by one year cumulative abnormal return prior to offering announcement (CAR =(rit−rmt),t= 1,. . ., 252). We include the time since the last offering asKrigman et al. (2001)suggest that the underwriter may be required to do more due diligence on the firm, and hence charge a higher fee, if substantial time has passed. We also include the underwriting ranking, dummy variables for our five categories of switching (large downgrade, lateral
down-Table 3 Number of investment banks in the pool of potential underwriters. For each firm we examine how many investment banks are actively involved in the firm prior to the offering. We include all 411 distinct investment banks that have a Carter–Manaster rank in Jay Ritter’s updated 1992–2000 sample, and appear on either the IBES database or the list of Nasdaq market makers during 1996–2002. We count how many of these investment banks are providing analyst coverage 90 days prior to the offering date; how many have acted as a debt underwriter or loan arranger in the five years prior to the offering; and for Nasdaq firms, how many investment banks act as a market maker three months prior to the offering. We count the total number of investment banks that are “active,” i.e., either providing analyst coverage or acting as a lender/debt underwriter, or acting as a market maker (for Nasdaq firms). Next we restrict our pool of potential underwriters to investment banks who have a Carter–Manaster rank at least as high as the selected lead underwriter.
Whole sample Non switcher Switcher Large down Lateral down Same rank Lateral up Large up
No. obs. 1277 720 557 30 79 181 124 143
Number of investment banks 411 411 411 411 411 411 411 411
Number of IB Analysts 90 days prior 3.7 3.8 3.7 2.4 3.2 4.5 4.2 2.7
Number of IB lenders 0.7 0.7 0.7 0.1 0.7 1.1 0.6 0.5
Nasdaq firms
Number of Nasdaq offerings 885 519 366 16 56 107 81 106
Number of IB market makers 16.6 16.8 16.4 13.5 15 20.8 15.2 14
Number of active IB, excl old and new lead 16.0 16.4 15.5 13.0 13.8 19.8 14.4 13.3 Number of Active IB, CM rank≥new lead 4.0 3.9 4.0 7.8 5.7 4.4 3.1 2.9
% active new lead 86.2 99.4 67.5 62.5 78.6 85.0 63.0 48.1
% active old lead 95.2 99.4 89.3 62.5 92.9 91.6 88.9 89.6
Non-Nasdaq firms
Number of non-Nasdaq offerings 392 201 191 14 23 74 43 37
Number of active IB, excl old and new lead 4.3 4.6 4.0 1.5 4.7 4.7 4.0 3.0 Number of active IB, CM rank≥new lead 1.5 1.8 1.2 1.2 2.0 1.4 1.0 0.8
% active new lead 62.5 77.6 46.6 64.3 43.5 52.7 37.2 40.5
Table 4 Direct and indirect costs. This table shows the results of two regressions: one modeling the fees (gross spread as a percent of amount offered) and the other modeling the pricing discount (return from the close price the day before the offering to the offer price). The independent variables are: size, measured by the log of the offering proceeds; risk, measured as the stock return standard deviation measured over the 90 days prior to filing. Five dummy variables are used for the five categories of switching based on Carter–Manaster ranks (large downgrade in underwriter reputation, lateral downgrade in underwriter reputation, lateral upgrade in underwriter reputation and large upgrade in underwriter reputation, switch within CM rank). The Carter–Manaster (CM) rank of the underwriter is on a 1–9 scale, with 9 representing the highest reputation underwriters. The time since prior offering is in years, and the one year return prior to offering is the cumulative abnormal return (CRSP value-weighted return is the market return). Year dummies are also included but not reported. Sample size is 1277 offerings.T-statistics are in parentheses.
Dependent variable Fees Discount
Intercept 15.87 [46.5] −16.80 [−8.62] Log amt −0.5640 [−28.53] 0.8765 [7.76] Large downgrade 0.0449 [0.42] −0.9916 [−1.62] Lateral downgrade 0.0602 [0.90] −1.0067 [−1.64] Lateral upgrade 0.1604 [3.01] 0.0584 [0.19] Large upgrade 0.3481 [6.87] −1.2046 [−4.16] Same rank 0.1086 [2.31] −0.3661 [−1.36]
Stock price volatility 5.70 [5.85] −39.22 [−7.05]
CM rank of underwriter −0.0795 [−5.55] −0.0467 [−0.57]
Time since prior offering −0.0097 [−1.07] −0.0739 [−1.43]
One year return prior to offering 0.0903 [2.89] −0.1120 [−0.63]
R2 56.2% 14.5%
grade, lateral upgrade, large upgrade, same rank), and year dummy variables.
Table 4shows that deal complexity does affect the cost of the deal: smaller deals and firms with higher price volatility have higher fees (in relative terms) and more pricing discount. High reputation underwriters charge lower fees. Perhaps the most important result of Table 3is that after controlling for size and risk (and the other control variables), underwriters for upgrading or same rank switchers do not generally compete proactively on fees but downgrading switchers do. On the dimension of underpricing, after controlling for deal attributes, we find that the underwriters for large upgraders provide worse underpricing discounts compare to the underpricing discount of non-switching firms.
Overall, we find that fees and discounts vary with a deal’s com-plexity. Firms that have a big upgrade in underwriter reputation pay significantly higher fees and face steeper pricing discounts, even after controlling for size and risk.
2.3. Analyst coverage
A second aspect of competition is analyst coverage. We first consider the overall analysts’ interest in our sample of firms.Table 5shows the total number of analysts covering the sample firms before and after the offering. Three months before the offering date, the firms have on average 4.37 analysts providing buy/sell recommendations, and this increases to 5.83 analysts three months after the offering.15 There is little difference in these numbers between switchers and nonswitchers, but there is considerable diversity in analyst cover-age within switching firms. Large downgraders and large upgrading firms tend to have fewer analysts, while those switching to same ranked underwriters have the most analysts.
Do firms switch underwriters to add quality analyst coverage? To address this, we examine the number of top tier analysts
(ana-15The number of analysts 90 days prior to the offering differs from the number inTable 3because inTable 5we are including non-investment bank analysts as well as investment bank analysts.
lysts associated with a top 10 underwriter) for each firm. Prior to the offering, firms have on average 0.77 top tier analysts providing coverage. After the offering, all firms increase the number of quality analysts making recommendations, but the increase is only signif-icant for the large upgrading firms and the non-switching firms. Surprisingly, despite the increase in the number of analysts fol-lowing a firm, most switching firms do not gain top-tier coverage whereas non-switching firms do.
To focus on whether underwriters strategically provide analyst recommendations around the offering to attract or retain busi-ness, we compare the average recommendation 90 days before and after the offering date for the new lead underwriter, the old lead underwriter, and the consensus recommendation. For non-switchers, there is only a marginal increase in the lead underwriter’s recommendation around the offering. Compared to the consen-sus recommendation, however, the lead underwriter is significantly more positive.16Hence, the non-switchers enjoy consistently high recommendations and so have little reason to seek them else-where.
For switching firms, a different pattern emerges. For down-grading or same rank switchers, the new lead underwriter is more optimistic before the offering than is the old underwriter, suggesting that greater optimism may be a reason for the switch. This finding is consistent with the notion that upgraders move for reputation
rea-16 These <fn0080>results complementKrigman et al. (2001)’s finding that a prime reason why firms switch underwriters is dissatisfaction with their research coverageKrigman et al. (2001)find that only 68% of the lead IPO managers for the switched firms covered the target firm ahead of the follow-on offering, compared with 80% coverage for the non switchers. They also examined the number of research reports issued for the follow-on offering firms, finding that for switchers the old lead provided follow-only 1.27 reports in the 6 months prior to the follow-on offering while for non-switcher the lead provided 3 reports. They conclude that firms will more likely to switch when research coverage is minimal. Finally, they also documented another dimension of the competition for follow-on offering: a substantially greater increase in All-Star lead manager analysts for the switchers than the non-switchers.
36
K.
Ellis
et
al.
Table 5 Underwriter analyst recommendations around offering. This table presents the analyst recommendations from the prior lead (old lead), the current lead underwriter (new lead), and the consensus of all other analysts (unaffiliated consensus). For non-switching firms, the old lead and the new lead are the same underwriter. The analyst recommendations are on a scale of 1 (low) to 5 (high). Sample size is 1265 firms as 12 had no analyst coverage. Analyst recommendations are on a scale of 1–5 with 5 representing a strong buy recommendation. Top tier analysts are analysts from investment banks with a Carter–Manaster rank of 9.
Whole sample (n= 1265) Non-switchers (n= 712) Switchers (n= 553) Switchers Large downgrade (n= 30) Lateral downgrade (n= 78) Same rank (n= 179) Lateral upgrade (n= 123) Large upgrade (n= 143) Number of analysts 90 days prior 4.37 4.31 4.45 2.93 3.96 5.49 4.88 3.35 90 days post 5.83 5.82 5.84 4.43 5.32 6.79 6.12 4.99
Ttest (over time) 10.31 8.44 6.12 2.48 2.58 1.74 2.91 4.15
Number of top tier analysts
90 days prior 0.77 0.9 0.6 0.13 0.35 0.92 0.78 0.27
90 days post 1.07 1.27 0.81 0.13 0.64 1.20 0.93 0.47
Ttest (over time) 5.64 5.13 2.76 0 1.63 1.74 0.79 1.87
New lead underwriter recommendation
90 days prior 4.46 4.47 4.43 4.36 4.58 4.40 4.38 4.45
N 793 567 226 14 40 92 42 38
90 days post 4.54 4.53 4.55 4.63 4.61 4.49 4.60 4.53
N 1050 600 450 24 64 142 102 118
T test (over time) 2.85 1.69 2.36 1.45 0.29 1.12 2.12 0.78
Old lead underwriter recommendation
90 days prior 4.42 4.47 4.31 3.57 3.90 4.20 4.51 4.55
N 823 567 256 7 29 93 67 60
90 days post 4.47 4.53 4.32 3.57 3.96 4.24 4.53 4.49
N 833 600 233 7 26 85 60 55
Ttest (over time) 1.51 1.69 0.15 0 0.32 0.3 0.22 -0.52
T-test (new vs. old)
90 days prior 1.25 0 1.98 2.81 4.13 1.97 -1 -0.83
90 days post 2.53 0 4.31 3.35 4.47 3.06 0.65 0.43
Unaffiliated consensus recommendation
90 days prior 4.31 4.35 4.26 3.74 4.19 4.25 4.31 4.38
N 1121 645 476 25 65 165 110 111
90 days post 4.35 4.39 4.31 4.03 4.27 4.29 4.30 4.43
N 1232 702 530 29 74 176 120 131
T-test (new lead vs. consensus)
90 days prior 5.48 3.67 3.53 2.66 3.26 1.88 0.67 0.54
sons, while other switchers are looking for better performance from their underwriter.
The new underwriter is also more optimistic than the consensus belief, both before and after the offering. This strongly positive effect is found for all firms except for large upgraders. We conclude that investment banks do use optimism as a competitive variable, and winning banks distinguish themselves from their competitors by offering more positive recommendations.17
2.4. Market making capabilities
A third potential dimension of competition relates to the underwrit-ers’ market making activities. For stocks listing on the NYSE, the specialist serves as market maker, and hence any market making role by the underwriter is strictly passive.18For stocks listed on the Nasdaq, however,Ellis et al. (2000)show that the lead underwriter in a Nasdaq IPO always makes a market for the stock and is almost always the dominant market maker for the first few months the stock is traded, controlling more than 50% of the order flow. Also,Ellis et al. (2000)show that many market makers do very little volume, and around 70% of the trading volume is done by three market mak-ers. This suggests that market making may be an important variable in the competition for Nasdaq-listed offerings, and that we should examine, not only whether the lead underwriter is a market maker, but whether or not the lead underwriter is one of the dominant market makers.
We collect data from the NASD on issuing company trading vol-ume executed by each underwriter in the period 3 months before to 3 months after the offering for 885 Nasdaq offerings in our sample during January 1996 to March 2002. The data inTable 6 reveal the average number of market makers per month for our sample is 54 three months prior to the offering, and 69 market mak-ers three months after the offering, and the range (not reported in the table) varies from three market makers to 265. As suggested by Ellis et al. (2000), there are “wholesaler” firms, such as Her-zog or Knight Securities, who do not underwrite securities but instead specialize in making markets. We link our market maker identities to Carter–Manaster ranks to only include market mak-ers who also do underwriting. With this restriction, the average number of investment-bank market makers per stock is 17 three months prior and 22 three months post offering, with a range of 1–86.
As many of these market makers may be doing very little trading volume, we focus on the three market makers who are transacting the most volume. Three months prior to the offering, the top three market makers are doing 62.4% of the volume, and the old lead underwriter is one of these dominant market makers in 72.7% of stocks, whereas the new lead underwriter is for 63.5% of stocks. As a benchmark, a non-lead underwriter investment bank with the same or higher Carter–Manaster rank as the new lead underwriter is one of the dominant market makers for only 42.3% of the stocks,
17Examining each year of our sample separately, we do find that analyst recommendations were overall lower in 2002–2003 following the Global Settlement. Due to the small sample size per year we cannot determine statistical significance, however, the same optimistic recommendations by new lead underwriters (excepting large upgraders) prior to the deal were still found in the yearly samples.
18The underwriter could submit limit orders, for example, or actively par-ticipate in block trades, but he cannot set the bid and ask quotes as he can for Nasdaq-listed stocks.
thus both the old and new lead underwriter are relatively active in market making prior to the offering.
The likelihood of the old or new lead underwriter being an active market maker is related to switching: old underwriters for switch-ing firms were much less active market makers before the offerswitch-ing than is the case for non-switching firms. Whereas nonswitching firm underwriter did about 30% of trading and was a dominant market maker 87.7% of the time, the soon-to-be-replaced underwriter was handling much less (an average of 17.8%), and was only a dominant market maker 51.6% of the time. These data suggest firms switch because of less-active market making by the old underwriter.
For the switching firms, the new lead underwriter is less active in market making than the old lead underwriter when the firm switches to a better or same ranked underwriter. However, when the firm switches to a lower ranked underwriter, the new underwriter is as active as the old underwriter in market making: doing 14% of the trading volume versus 15% (difference not statistically signif-icant) and acting as a dominant market maker in 25–37.5% of the stocks versus 25–51.8% of the stocks (difference not statistically significant). This suggests that market making activity may be more important for these types of offerings. Overall, the data show that for all switchers, the new underwriter takes on a much larger role after the offering, being a dominant market maker 68.7% of the time three months after the offering.
2.5. Debt underwriting and loan arranging
Another connection between underwriters and equity issuers that has been examined byDrucker and Puri (2005)is debt tie-ins to equity deals. As we are focusing on the lead underwriter’s behav-ior prbehav-ior to the deal, rather than what is being promised after the deal, we examine lending links prior to the deal, not concurrent. Table 2shows that less than five percent of our sample firms have had a public debt offering underwritten by either the old or new lead underwriter in the prior five years, and a similarly small portion of our sample has had a private loan arranged by either underwriter.
Table 3shows that debt relationships between investment banks and equity issuers are rare: the average deal has less than one lender associated with it. Although these numbers are very small, they are consistent with the sample size in Drucker and Puri, who found 6.7% of SEOs (including shelf registrations) had debt tie-ins.
For switcher firms the new lead underwriter arranged a private loan 3.3% of the time, compared to 0% of the time for the old lead underwriter, and the underwriters of non-switching firms had a debt relationship 6.0% of the time. This suggests that debt relationships can be another competitive strategy of underwriters, however they are infrequent.
3. Is the market competitive?
Our analysis thus far has separately analyzed the extent to which fees, discounts, market making, prior debt offering, reputation, ana-lyst coverage and recommendations play a role in the competition for follow-on offerings. We now take a broader perspective on the nature of competition by allowing each dimension to enter into a comprehensive measure of competition or underwriter quality. After constructing an overall competitive score for each deal, we examine whether investment banks do indeed compete for under-writing clients, and we relate the competitive score to investment bank reputation, and the probability of gaining or losing clients.
38
K.
Ellis
et
al.
Table 6 Market making activity around follow on equity offerings. The sample in this table is restricted to Nasdaq offerings, January 1996 to March 2002, and the sample size is 885. These data are from the Nasdaq monthly market making volume statistics. We focus on two particular months: the calendar month three months prior to the offer date and the calendar month three months post. We include market makers who are registered and trade during the month. IB market makers are market makers who have a Carter–Manaster rank during 1992–2000 according to Jay Ritter’s updated Carter–Manaster rankings. The top three market makers for each firm-month are the market makers that do the largest percentage of trading volume during the month. A “high-ranked” investment bank is any investment bank with CM rank equal or above the CM rank of the new lead underwriter. The sample is split into six subgroups: the non-switchers use the same underwriter from offering to offering, and the switching firms are split into five groups based on the change in Carter–Manaster ranking from the old lead underwriter to the new lead underwriter.
Whole sample (n= 885) Non-switchers (n= 519) Switchers (n= 366) Large downgrade (n= 16) Lateral downgrade (n= 56) Same rank (n= 107) Lateral upgrade (n= 81) Large upgrade (n= 106) Number of market makers
90 days prior 53.7 54.3 52.8 44.9 49.4 68.0 48.5 43.8
90 days post 68.6 69.0 68.2 66.8 63.1 86.0 63.8 56.2
Number of IB market makers
90 days prior 16.6 16.8 16.4 13.5 15.0 20.8 15.2 14.0
90 days post 21.5 21.7 21.2 20.4 19.4 26.2 20.5 17.6
Old lead UW is in top 3
90 days prior 72.7% 87.7% 51.6% 25.0% 51.8% 54.2% 61.7% 45.3%
90 days post 64.0% 86.5% 32.4% 12.5% 37.5% 29.0% 43.8% 27.6%
New lead UW is in top 3
90 days prior 63.5% 87.7% 29.2% 25.0% 37.5% 38.3% 25.9% 18.9% 90 days post 79.1% 86.5% 68.7% 81.3% 60.7% 65.4% 66.3% 76.2% High-ranked IB is in top 3 90 days prior 42.3% 49.3% 32.2% 56.3% 37.5% 32.7% 33.3% 24.5% 90 days post 49.6% 56.9% 39.3% 37.5% 48.2% 43.0% 35.0% 34.3% Old UW volume 90 days prior 26.1% 31.3% 17.8% 14.6% 15.0% 17.3% 21.3% 17.5% N 835 512 323 10 52 95 72 94 90 days post 21.0% 27.1% 10.9% 10.7% 11.0% 9.6% 12.5% 10.9% N 820 514 305 8 47 91 71 88 New UW volume 90 days prior 25.1% 31.3% 11.8% 14.2% 13.9% 11.5% 10.4% 11.3% N 750 512 237 10 43 89 47 48 90 days post 23.6% 27.1% 18.6% 25.8% 16.4% 16.8% 19.5% 19.9% N 875 514 360 16 56 105 79 104
T-test old UW vs. new UW
90 days prior 0.98 4.94 0.05 0.39 3.14 3.86 2.40
Our motivation for constructing a competitiveness score for each deal is that equity issuers face a wide range of services from underwriters, and must select an underwriter that provides the best combination of services. This may result in paying higher fees, or less accurate pricing if the issuer places high impor-tance on analyst coverage or market making participation prior to the deal, but overall, if underwriters are competing for issu-ing clients, they are providissu-ing a set of services that addresses the needs of the clients. While our prior analysis examines each dimension of underwriter behavior separately, it ignores the interac-tion between the various competitive dimensions. The competitive score captures the more complex and multidimensional nature of competition: on average, what importance is placed on analyst coverage versus fees, pricing accuracy, etc. To the extent that issu-ing firms value different thissu-ings from an underwriter (e.g., some may place utmost importance on market making, whereas others place the most importance on low fees) we will have noise around our measure, which only captures the common attributes of the deals.
As our competitiveness score focuses on the behavior of the lead underwriter, it is measuring the outcome of competition between the unsuccessful investment banks that are not cho-sen as the lead underwriter and the successful investment banks that are chosen as the lead underwriter. If investment banks are competing for underwriting mandates on these dimensions, then we can compare the resulting behavior (competitiveness scores) of the successful investment banks across deals. The null hypothesis is that under a perfectly competitive equilibrium these scores should all be equal. The finding that scores are not equal is consistent with varying degrees of non-competitive behav-ior.
3.1. Correlations among investment banking variables
As a first step to constructing an overall competitive score for each deal, we gauge the interaction between attributes via correlations. We standardize the relevant variables by subtracting the sample mean from each observation and dividing the difference by the sam-ple standard deviation. This results in each variable having a normal distribution with mean zero and standard deviation of one. As some of our variables are inverted (for example, lower fees are better) we invert the standardized variables so that a positive value implies the underwriter is “better” than the mean. There are 15 pair-wise cor-relations between the six standardized variables. For non-Nasdaq stocks we assign a neutral value of zero for the market making variable.19
For the non-switchers, 10 correlations are significant: eight positive and two negative. The significant negative correla-tions are between market making with reputation and fees. This result suggests that market making activity provided by the lead underwriter prior to the offering may be a substitute for these attributes. The eight significant positive correlations suggest that high quality underwriter behavior along one dimen-sion translates into high quality behavior along others: notably fees are positively correlated with reputation, pricing discount, and debt relationship. For the switchers, 11 correlations are significant: ten positive and one negative (reputation is
nega-19Alternatively we could work with the non-Nasdaq and Nasdaq sub-samples separately. We have done this analysis and the results do not change significantly.
tively correlated with recommendation). Thus, as there is only one negative correlation, there is little evidence that underwrit-ers consistently compensate for non-competitive behavior on multiple dimensions with competitive behavior on other dimen-sions.
Overall, the correlation analysis suggests there are several strong interactions between the variables we are examining, and combin-ing the variables into one competitive measure for each deal may provide more information than analyzing each variable individu-ally.
3.2. Construction of an overall measure of competition
We combine our standardized variables to provide a comprehen-sive measure for each deal (scorei) of the competition for follow-on
offerings.20
scorei=a1STD feei+a2STD discounti+a3STD reputationi
+a4STD MMi+a5STD reci+a6STD debti
An immediate problem in constructing this measure is how to weight the various dimensions. As a first approximation, we assume each (standardized) measure has the same impact and use equal weights to combine the six standardized mea-sures of underwriter activity into a single measure of overall underwriter competition for each deal. Thus each attribute gets a weight of 1/6 (or 16.7%). The sample mean of our com-prehensive measure is zero and its standard deviation is 0.53, narrower than the standard deviation of one for the individ-ualz-scores, due to the correlations among variables. Follow-on offerings associated with a measure of zero are deals with aver-age terms, whereas a positive measure represents a deal with overall better terms and hence a more competitive lead under-writer.
Equal-weighting may be problematic in that different elements may have different importance in the overall deal competitiveness. There is no a priori reason to believe that, say, fees and market making will have the same impact on how competitive a deal is. Thus the second measure we use finds the weights that maximize the overall level of competition in the market for follow-on offer-ings. The intuition here is that we try to find the set of weights (for the six variables) that will result in a maximum level of compe-tition. If the market is perfectly competitive, the overall measure for each deal will be equal to zero: in equilibrium, all deals pro-vide the same service when all elements are considered. To find the optimal weights, we solve for a system of equations where the weights minimize the squared deviation from zero for each
20 For non-Nasdaq offerings, underwriters cannot directly compete on the market-making dimension and in our analysis we assign a neutral standardized value for market making for the non-Nasdaq offerings (i.e. STD MM= 0). Similarly, for offerings with no analyst coverage, we assign a neutral value,STD rec= 0. In robustness checks we have replaced these assumptions by various alternatives, including calculating scores for Nasdaq and non-Nasdaq offerings separately with different weights, or assigning a negative value toSTD MMfor the non-Nasdaq offerings, or assigning a negative value toSTD recfor offerings with no analyst coverage. Although our optimal weighting schemes differ under each of these alternatives, our results are not sensitive to these differences.
40 K. Ellis et al. deal21: Min a1,...,a6 1277 i=1
(scorei)2=(a1STD feei+a2STD discounti+a3STD reputationi+a4STD MMi+a5STD reci+a6STD debti)2
s.t. 6 j=1 aj=1 aj≥0, j=1, . . . ,6
The outcome of this optimization is presented in Panel A of Table 7. Interestingly, when we optimize the degree of market overall competitiveness, reputation, market making, recommendations and debt relationship receive slightly higher weights than in the equal weighting scheme and pricing discount receives a slightly lower weight. It should also be noted that fees receive particularly low weight (1.9%) and market making activity receives higher weight than one would expect (23.3%). We can think of two reasons for this outcome. First, since market making is negatively correlated with other deal features, to minimize variation, the weight on this element is larger. Second, fees are positively correlated with rep-utation, pricing discount recommendations and debt relationship. Thus, to maximize competition, the weight given to this variable is low. But overall, the weighting of the variables is not radically different between the two weighting schemes.
Since a deal’s score may be related to deal features (size of deal, volatility of stock price, time since last deal, stock price performance prior to offering) we examine the underwriter activity net of these effects, by regressing the deal’s competitive score on deal features and time dummies, and examining the residuals. The regression results (Table 7, Panel B) show that features of the deal are important determinants of the underwriter competitiveness, in ways consistent with prior results we present: larger deals have higher scores, risky deals have lower scores, and the longer the time since last offering make the term of the deals less attractive.
More importantly, we are interested in the competitiveness of deals in each of our switching and non-switching categories. If deal features capture all the variation in competitive scores, then there should be no difference between the score for switching firms and non-switching firms, because underwriters will provide competitive overall service conditional upon the size and risk of the deal.
InTable 7, Panel C, we average the regression residuals for non-switchers, and the five categories of switchers. We can reject our null hypothesis of perfect competitiveness in five out of six cases. The significantly positive average residual for non-switchers indicates that underwriters that retain clients are providing superior overall service to those clients (controlling for deal size, price volatility, etc.) above and beyond what would be required in a perfectly com-petitive market. By contrast, we cannot reject the null for follow-on offerings by firms that switch without any large change in reputa-tion. The insignificant residuals indicate that underwriters are facing competition for these deals. This is consistent with these deals hav-ing the largest pool of potential underwriters as seen inTable 3 (active investment banks).
When switching involves a large change in reputation, either up or down, we reject the null as underwriters do not compete on the
21Rather than using the public debt and private debt relationships sepa-rately, we form one variable that takes the value one if the lead underwriter has a prior public or private debt relationship, and zero otherwise. Then we calculate standardized scores for this single debt variable.
dimensions we have outlined, rather providing poorer service overall (prior to the deal) than for other deals.22These results are consistent across the weighting schemes and are robust to the exclusion of prior debt offerings as one of the competitive variables.23
3.3. Investment bank competitiveness and client loyalty
In the analysis above we found that the competitiveness score dif-fers across deals that retain an underwriter versus deals that switch underwriters, and that underwriters are competitive for deals that switch without a large change in underwriter reputation. We now consider how this competitiveness score differs with attributes of the investment bank.
InTable 8Panel A we calculate the mean and median competi-tiveness score for the investment banks in our sample with aCarter and Manaster (1990)rank of 8 or 9 (theMegginson and Weiss (1991) reputation measure is also presented). Overall, the highest ranked (CM = 9) investment banks have positive average competitiveness scores and mostly positive median scores, whereas the investment banks that are ranked CM = 8 have negative average and median competitiveness scores. Thus, reputation is related to the overall service quality provided by an underwriter leading up to a deal.
Investment banks providing higher quality overall service to their underwriting clients should have more success in retaining clients and attracting new clients. If clients focus on a combina-tion of underwriter services, rather than on one particular attribute (for example, analyst coverage), then our competitiveness score should explain the likelihood of an investment bank gaining or los-ing a client. For the individual investment banks, we calculate a loyalty index of their issuers, defined as the percentage of issuers who use the same bank for their next offering. Table 8Panel A shows that among the underwriters with CM rank greater than seven, these loyalty ranks range from a high of 83.6% for Goldman Sachs to a low of 26.3% for Prudential. We also see that for Goldman Sachs, 36% of deals come from new clients, whereas new clients accounted for 82% of deals for Thomas Weisel and 73% of deals for UBS Warburg. Thus, even within the top-tier underwriters, there are substantial differences in underwriters’ abilities to retain and attract investment banking clients. Underwriters with higher loy-alty do have higher competitiveness scores (Pearson’s correlation
22For firms graduating to a high reputation underwriter, the below average service prior to the deal (i.e., little analyst coverage or market making), does not translate into below average coverage after the deal.
23We split the sample into two sub-periods for robustness. We calculate optimal weights for 1996–1999 and 2000–2003 separately and calculate regression residuals for each sub-period. The results are consistent across the sub-periods: significant positive residuals for non-switchers; significant negative residuals for large up or down switchers; insignificant residuals for same-rank switchers; weakly significant negative residuals for lateral switchers.