Transportation Research Procedia 14 ( 2016 ) 886 – 895
2352-1465 © 2016 The Authors. Published by Elsevier B.V. This is an open access article under the CC BY-NC-ND license (http://creativecommons.org/licenses/by-nc-nd/4.0/).
Peer-review under responsibility of Road and Bridge Research Institute (IBDiM) doi: 10.1016/j.trpro.2016.05.083
ScienceDirect
6th Transport Research Arena April 18-21, 2016
Managing greenhouse gas emissions from warehousing and
transshipment with environmental performance indicators
David Rüdiger
a,*, Andrea Schön
b, Kerstin Dobers
aaFraunhofer Institute for Material Flow and Logistics, Joseph-von-Fraunhofer-Str. 2, 44227 Dortmund, Germany b
Schenker AG, HO Essen, Alfredstr. 61, 45130 Essen, Germany
Abstract
When considering a complete ecological assessment of logistics activities and the development of comprehensive decarbonization strategies, it's important to address not only transportation but the warehousing and transshipment processes as well. In national inventories, the total energy demand of warehousing can equal around one quarter of the transport emissions. The issue of energy-efficient processes at logistics facilities gains importance because of changing regulations and market requirements (e.g. the new European Energy Efficiency Directive which prioritizes the energy demand of buildings). Furthermore, logistics companies tend to realize energetic and/or ecological improvements at logistics facilities and report savings achieved.
As opposed to logistics facilities, the ecological assessment of transportation and the derivation of appropriate environmental performance indicators (EPI) are widely standardized (cf. EN 16258). How to assess, monitor and manage greenhouse gas emissions (GHG) at warehouses or terminals are still major research and standardization issues. That is why the Fraunhofer Institute for Material Flow and Logistics has defined a comprehensive assessment approach for logistics facilities, calculated specific emission factors and developed a flexible yet detailed allocation scheme for different logistics services (e.g. refrigerated warehousing). This article addresses the developed method and provides an argumentative basis for further standardization. This will be realized by the presentation of a classification scheme for logistics facilities based on ecological aspects and the consideration of attributes of logistics items in the discussion about how GHG emissions of logistics facilities are usually influenced. To illustrate strengths and weaknesses of the method, exemplary implementations at facilities of the research partner, DB Schenker, will be published. Focus will be on the emissions of a cross-docking center, a warehouse and a spare parts depot. The provided assessment method for GHG emissions of logistics facilities and the allocation scheme for EPIs enable logistics companies to monitor and manage the emissions of goods storage and transshipments on a continual basis. Consequently, the
* Corresponding author: David Rüdiger Tel.: +49 231 9743 359 E-mail addresses:David.Ruediger@iml.fraunhofer.de
method can trigger the development of decarbonization strategies at logistics facilities and foster an organizational or technological improvement process.
© 2016The Authors. Published by Elsevier B.V..
Peer-review under responsibility of Road and Bridge Research Institute (IBDiM).
Keywords:Greenhouse gas emissions; logistics centers; logistics facilities; warehousing; transhipment terminals; environmental performance indicators; allocation scheme; GHG protocol; green logistics
1. Introduction
According to the latest figures of the International Panel on Climate Change (IPCC), there is still a steady growth of the annual greenhouse gas (GHG) emissions worldwide. “The total anthropogenic GHG emissions were the highest
in human history from 2000 to 2010 and reached 49 Gt CO2eq/yr in 2010” (IPCC 2014). In terms of mitigating the
effects of global warming, political frameworks are required that address specific markets and sectors. Logistics for goods storage and transportation is one of the relevant sectors. In 2009, the World Economic Forum estimated that logistics (transport, warehouses and terminals) accounted for around 5.5% of the global GHG emissions and specified that roughly 4.95% came from freight transport and 0.55% from logistics facilities (WEF 2009). For the UK national GHG inventory, McKinnon calculated even higher shares. “In terms of logistics activities, it is estimated that 3% of total UK emissions are from warehousing. This compares to about 4% from heavy goods vehicles and 2% from vans” (McKinnon 2015). The figures demonstrate the importance of GHG emissions caused by logistics facilities for a complete assessment of the GHG emissions of transport networks and supply chains.
Many countries have agreed on mitigation strategies and have set national reduction targets. Despite a general lack of sector specific reduction targets, many directives and legal requirements already strongly address specific economic sectors (e.g. the logistics sector). Within the European Union (EU), not only the Emission Trading Scheme (ETS) is relevant for the logistics sector (airline industry included since 2012, maritime shipping industry expected to be included by 2018). Other political measures can also be identified. For example, the Décret 2011-1336 in France defines a legal obligation to report GHG emissions for all commercial transports with origin and destination in France. In the UK, the 'Companies Act 2006 (Strategic Report and Directors’ Reports) Regulations 2013' requires quoted companies to report on GHG emissions as part of their annual directors’ report (Defra 2013). Moreover, a few countries are preparing GHG related toll systems for highways and some municipalities intend to, or have already implemented environmental zones for cities in order to penalize or ban polluting road traffic. Within the EU, the political regulations to cut GHG emissions also include buildings such as public, industrial or private ones. In 2012 the European Commission (EC) has published the European Energy Efficiency Directive (EED 2012/27/EU) which prioritizes the energy demand of buildings and its related indirect GHG emissions. The EU directive requires organizations and companies to report the energy input levels on a recurring basis and to define energy saving measures. Only small and medium-sized enterprises (SME) are exempt, along with companies that have already employed or plan on employing either an energy management system (ISO 50001) or the European Eco-Management and Audit Scheme EMAS.
Considering the GHG reduction targets (e.g. EU-27 target 1990-2020: - 20%) and the related political regulations, many companies in the EU have started to prepare for an extended GHG reporting obligation. So far only a few standards and guidelines have been published for the logistics sector, especially for the GHG management of logistics facilities. In this paper, a method for managing GHG emissions from warehousing and transshipment activities with a set of environmental performance indicators (EPI) will be presented that support monitoring and interpret developments in a sophisticated manner. This mainly includes a derivation and definition of assessment boundaries, calculation rules, as well as allocation approaches for different services of logistics facilities. In order to illustrate strengths and weaknesses of the method, exemplary implementations at facilities of the research partner DB Schenker will be published. The method described is a result of the German research project 'Green Logistics' (cf. Green Logistics).
© 2016 The Authors. Published by Elsevier B.V. This is an open access article under the CC BY-NC-ND license (http://creativecommons.org/licenses/by-nc-nd/4.0/).
1.1. State-of-the-art in ecological assessment of logistics activities
In the past, numerous different norms, (industry) standards, methods, guidelines and tools have been developed to determine and improve the environmental performance of companies. Many of these methods are based on the LCA pursuant to ISO 14040 & 14044, which is used to systematically assess the environmental impacts of the entire life cycle of production and services systems. Due to its complexity, the LCA is hardly applied in the area of logistics services. Against the backdrop of increasing discussions on climate change, the assessment of GHG emissions is rather focused when talking about environmental effects of logistics services today, as can be seen from the various recent initiatives on an international level, such as the GHG Initiative and its standards (WRI and WBCSD, 2005, 2013), and ISO standards 14064 & 14065. A system specifically for the logistics sector and its services was not available until the EN 16258 standard was introduced in 2012. This standard provides the first concrete framework for determining the energy consumption and GHG emissions of transport processes, and includes prioritized calculation rules, defined parameters and allocation/declaration requirements. Many of the existing initiatives and tools for the carbon accounting of transport activities (e.g. Green Freight Europe, EcoTransIT) along with companies have implemented the norm. However, the application of EN 16258 in industry practice showed numerous interpreting options of this framework leading to incomparable results on the GHG emissions of transport services (see e.g. DG MOVE Study 2014).
As a result of the wide discussion of EN 16258, the EU project COFRET together with DIN was encouraged by ISO to realize the International Workshop Agreement on “CO2e emissions of freight transport” (IWA 16). During the
course of three international workshops, general as well as mode-specific gaps were defined and the most appropriate and best aligned starting points (per transport mode and for logistics sites) were specified. In regards to carbon accounting for logistics sites, the approach of the German research project 'Green Logistics' was analyzed and compared to the approaches Green Efforts and ITEC (cf. IWA 16 report). The industry initiated the Global Logistics Emission Council GLEC to develop a globally harmonized framework for logistics emissions accounting covering all modes, transfers and regions. Again, GLEC discussions about carbon accounting methods for logistics sites refers to the Green Logistics approach as one of the main starting points. Therefore, the article at hand focuses on this approach, specifies the general framework and describes its application in industry practice.
1.2. Types and functions of logistics facilities within logistics networks
Transport networks and logistics facilities define the basis of logistics infrastructure. In order to derive a basic distinction of logistics facilities, it seems quite useful to consider a material flow oriented definition of logistics. One simple definition is the TTS concept (cf. DHL Glossary). The concept sets a focus on the three fundamental logistics processes for logistics items (transport, transshipment, storage). Considering this definition, logistics items are either in the status of being transferred in space (transport), in the phase of changing a means of transport or transport vehicle (transshipment), or being transferred in time (storage). In respect to this concept, the basic distinction of logistics facilities would be as follows: transshipment terminals (e.g. airports, seaports, rail terminals, cross-docking centers) and warehouses. In practice, the conceptual distinction is often not that clear. Sometimes operations of transshipping and storing goods take place at the same facility. That can be named as a distribution center.
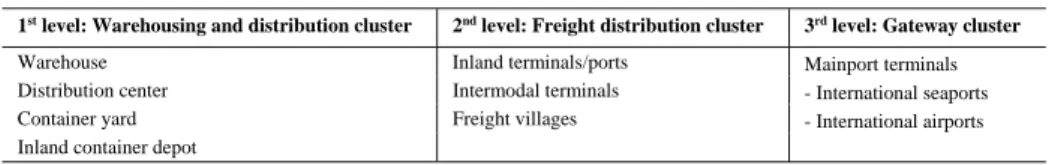
Huber et al. (2014) stated that “there is still little empirical knowledge about hubs and they are considered insufficiently in most freight transport demand models”. For the reason to overcome this gap, Huber et al. consulted significant literature and provided an overview on different classification models. They found out that the work of Higgins et al. (2012) provided a solid base for further classification (cf. table 1). It entails a 3-level hierarchy of logistics facilities according to their role in the supply chain and similarities to one another. “In general, as these facilities move up the scale in functionality and value added services, they can be understood to incorporate and expand on many of the features of the logistics centers below them in the hierarchy” (Higgins et al. 2012, p. 14). In other words, the facility’s size, its influence and function in regional freight and the number of value-added services provided increase from 1stlevel (low functionality) to 3rdlevel (high functionality).
Higgins et al. provide definitions for the types of logistics facilities presented in table 1. Basically, in all explanations, it is relevant whether or not transshipment or storage activities exist and what kind of additional value-added services are provided, such as order picking, returns processing, labelling, customs clearance, freight assembly,
etc. In this regard, Higgins et al. mention the “ongoing evolution of freight and logistics activities” which leads to the difficulty of taking into account all conceivable value-added services at logistics facilities.
Table 1: Classification of logistics centers based on functionality and value added services (cf. Higgins et al. 2012) 1stlevel: Warehousing and distribution cluster 2ndlevel: Freight distribution cluster 3rdlevel: Gateway cluster Warehouse Inland terminals/ports Mainport terminals
- International seaports - International airports Distribution center Intermodal terminals
Container yard Freight villages Inland container depot
Against this background and the objective to monitor the EPIs of logistics facilities in a sophisticated fashion, the aim was to develop a classification model for logistics facilities that take into consideration the most obvious and essential elements that determine the energy and resource consumption at facilities. As mentioned earlier, the main category is defined by transshipment terminals and warehouses (cf. table 2). An additional category 'distribution centers' was added for facilities that perform transshipment and warehousing activities in parallel (very common in food logistics). The 1stsub-category refers to logistics contracts and their main elements which can be distinguished.
At first the model differentiates the handling of goods with or without specifications on the cooling of goods (refrigerated vs. ambient goods). This is of high importance for the logistics facility’s processes and energy demand. Then, only for warehouses, it is differentiated if the contracts entail any detailed specifications for the order picking/packing process. This is due to the very common business model of contract logistics. Compared to a simple warehouse, the demand for packaging materials is much higher to run a contract logistics service.
Table 2: Classification of logistics facilities based on logistics contracts to be considered at the logistics center
Main class 1stsub-category Contracts to be considered at the logistics center 2ndsub-category
Transshipment terminal
Transshipment of ambient goods
Contracts on the transshipment/transloading performance, often in regard to the types (e.g. TEU, trailers, pallets) and numbers of logistics items or tons transshipped, without specifications on cooling processes
e.g. rail - road …
Transshipment of refrigerated goods
Same as above, but with contractual specifications on cooling process (e.g. use of plug-ins for reefer containers)
e.g. road - sea … Transshipment of ambient and
refrigerated goods
Contracts in regard to transshipment/transloading performance with and without specifications on temperature management
e.g. road - rail - sea …
Warehouse
Simple storage of ambient goods
Contracts on ambient storage performance, often in regard to throughput, stock levels, numbers of required storage locations and storage duration
e.g. manual … Simple storage
of refrigerated goods
Contracts on refrigerated storage performance, often in regard to throughput, stock levels, numbers of required storage locations, storage duration and min/max temperature requirements
e.g. 2-6 °C …
Simple storage of ambient
and refrigerated goods Contracts in regard to ambient and refrigerated storage performance (cf. above)
e.g. 2-6 °C and 18 °C …
Storage of ambient goods with order-picking (contract logistics)
Contracts on ambient storage performance, often in regard to throughput, stock levels, numbers of required storage locations and storage duration and with specifications for order-picking process (e. g. packaging requirements)
e.g. fully-automated …
Storage of refrigerated goods with order-picking (contract logistics)
Contracts on refrigerated storage performance, often in regard to throughput, stock levels, numbers of required storage locations and storage duration and with specifications for order-picking process (e. g. packaging requirements)
e.g. 2-6 °C …
Storage of ambient and refrigerated goods with order-picking (contract logistics)
Contracts in regard to ambient and refrigerated storage performance (cf. above) with specifications for order-picking (e. g. packaging requirements)
e.g. 2-6 °C and 18 °C …
Distribution center
Transshipment and storage of ambient goods
Contracts in regard to transshipment and warehousing activities (cf. above) without specific temperature requirements
e.g. mainly warehousing, …
Transshipment and storage of refrigerated goods
Contracts in regard to transshipment and warehousing activities (cf. above) with specific temperature requirements
e.g. 2-6 °C … Transshipment and storage of
ambient and refrigerated goods
Contracts in regard to transshipment and warehousing activities (cf. above) with and without specific temperature requirements
e.g. 2-6 °C and 18 °C …
The 1stsub-category refers to logistics contracts and their main elements which can be distinguished. At first the
model differentiates the handling of goods with or without specifications on the cooling of goods (refrigerated vs. ambient goods). This is of high importance for the logistics facility’s processes and energy demand. Then, only for warehouses, it is differentiated if the contracts entail any detailed specifications for the order picking/packing process. This is due to the very common business model of contract logistics. Compared to a simple warehouse, the demand for packaging materials is much higher to run a contract logistics service.
The results presented in table 2 are part of an ongoing research activity. At the moment, a survey on the carbon footprint of different logistics facilities is conducted by Fraunhofer IML which aims at expending insight on raw materials and supply. It will help further classify the technical, organizational and structural characteristics and differences of logistics facilities (2ndsub-category). For instance, it can be observed that in countries with low wage
costs, the degree of automation is lower compared to a country with high wage costs. The degree of automation is an important indicator for the energy intensity of processes. Other important influencing factors on the energy intensity of processes are the year of construction and the size of logistics facilities.
2. Calculating greenhouse gas emissions for logistics facilities
GHG emissions of logistics facilities are caused by a variety of processes. In contrast, to transport processes several sources of energy and resource consumption need to be considered. In order to receive comprehensible and comparable values, it is first important to determine system boundaries based on standardized criteria. With regard to the GHG protocol corporate standard, this chapter addresses the issue. After having defined a set of boundaries for one specific logistics center, the sources of energy and resource consumption can be further specified. In section 2.2, how different processes need to be assessed to derive GHG emission values will be presented.
2.1. Assessment boundaries and scopes for logistics facilities according to the GHG protocol
The terms of organizational and spatial boundaries of the GHG protocol corporate standard (WRI and WBCSD 2005) refer to a logical assignment of processes and emissions to a given research question. In essence, it is about avoiding false or incomplete accounting. This paper aims at providing a method to assess and interpret holistically the GHG emissions which are caused by the activities at logistics facilities. The organizational and spatial boundaries of a logistics facility can either be defined by the property or parts of the property. The property area is also used for other businesses (e.g. production). Generally speaking, buildings are relevant for many logistics facilities, especially if goods are consolidated or deconsolidated. However, for a few logistics facilities such as container terminals at seaports, logistics buildings play either a minor role or no role at all. In this case, the open areas are dominating for the realization of logistics operations.
In regard to a complete assessment of the energy and resource consumption at logistics facilities, it’s important to discuss the role of administrative processes and staff mobility (i.e. employee commuting and business trips). According to Dobers et al. 2014, these processes cannot be neglected. In practice one can find administration offices integrated into logistics buildings, independent offices at the logistics facility or independent offices separated from the logistics facility. That makes it difficult to define a strict rule whether these processes need to be integrated into a reporting of a logistics facility or not. Given that, it seems reasonable to allow the facility´s manager to make the decision. It should be decided on the relation of administrative tasks to the facility´s logistics operations.
A meaningful comparison of emissions over time requires a consistent timeframe. The GHG protocol corporate standard states that most companies will select a single year as their base. However, some companies will find it easier to use the inventory year as a basis for setting and tracking progress towards a given GHG target (WRI and WBCSD 2005, p. 35). Both procedures are compliant with the standards’ principles. The method presented in this paper adopts the reporting requirement of one year. In addition, a reporting for sub-sets of a year can prove useful to analyze the influence of daylight intensity or outside temperature on the carbon footprint of a logistics facility.
After having set the general assessment boundaries for a logistics facility, the GHG protocol corporate standard requires the emissions associated with operations be identified and to categorize them as direct and indirect emissions. “Direct GHG emissions are emissions from sources that are owned or controlled by the company. Indirect GHG emissions are emissions that are consequences of the activities of the company but occur at sources owned or controlled by another company.” (WRI and WBCSD 2005, p. 25) The standard distinguishes three scopes. Scope 1 is comprised of all direct emissions. Indirect emissions of the purchase of electricity, steam, heat or cooling are summarized in scope 2. Scope 3 is defined for all other indirect emissions resulting from activities like the extraction, production and transport of purchased materials. Due to the broad range of conceivable scope 3 emissions and thus,
the difficulty to decide on the significance of processes, a scope 3 specific supplement has been published for the GHG protocol corporate standard in 2013 (WRI and WBCSD 2013).
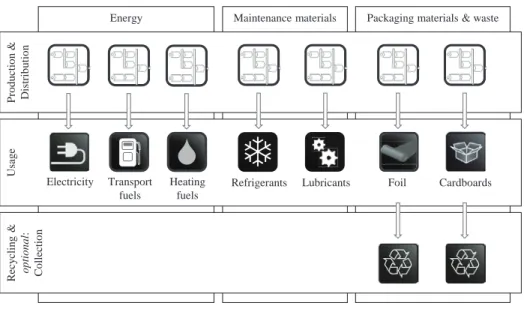
Considering the assessment boundaries discussed earlier, the 'corporate value chain (scope 3) accounting and reporting standard' requires managers of logistics facilities to assess the upstream (cradle-to-gate) emissions of purchased goods and services such as packaging materials, fuels or other raw materials and supplies (WRI and WBCSD 2013, p. 34). In addition, it is required to assess the scope 1 and scope 2 emissions of waste management suppliers that occur during disposal or treatment (WRI and WBCSD 2013, p. 35). The reporting of emissions from transportation of waste is optional and can be neglected. Other scope 3 emission categories elaborated in the standard have little to no relevance for logistics facilities. Figure 1 presents a holistic perspective of the energy and resource consumption at logistics facilities which need to be assessed by managers for being fully compliant of the GHG protocol reporting standards.
Fig. 1. Holistic perspective on energy and resource consumption at logistics facilities.
2.2. Calculation approaches for processes to determine GHG emissions
Basically GHG emissions (E) are calculated on the basis of measured or statistical values on the quantities (Q) of energy and resource consumption. A direct measurement of GHG emissions is not practical. The validity of results strongly depends on the accuracy of consumption values. Furthermore, it is important to identify appropriate emission/conversion factors (EF) that represent the technical, spatial and temporal frame of activities. At logistics facilities the electricity consumption is often one of the major sources of GHG emissions for a reporting company. Therefore, it is important that the emission factor for electricity is as accurate as possible. Usually the environmental agencies of countries publish country-specific emission factors for grid electricity on a regular basis that refer to the types of fuel or generation technologies used. Countries such as Austria or Sweden are characterized by high shares of renewable energies which result in low carbon electricity generation whereas countries such as Greece or Poland have rather high carbon electricity generation. It’s worth noting that many countries have set strategic goals for low carbon electricity production and fund the extension of renewable energies. This is why emission factors can vary significantly over time. Considering the example of Germany, the emission factor for electricity production improved continuously since 1990 (1990: 744 CO2/kWh; 2000: 627 CO2/kWh; 2010: 546 CO2/kWh - UBA 2013).
The general equation for emissions calculation of energy and resource consumption (Q) is:
ܧ௧௧ =σ ܧ=σ ܳ×ܧܨ with ݅= 1, … ,݊ (݊= number of processes) (1) Energy Maintenance materials Packaging materials & waste
Produ ct io n & Distr ib u tio n Usag e R ecy clin g & opt ional : Co llectio n
7
6
Electricity Transport fuels Heating fuelsWith regard to the GHG protocols’ scope definitions, most companies will find it easy to obtain primary consumption data (i.e. measured values) for scope 1 and 2. At logistics facilities the data sources are electricity/heat meters or reports on the diesel/gas demand of conveying vehicles. In contrast, companies usually find it rather difficult to include scope 3 emissions into a GHG balance. As an example, suppliers of packaging materials are prone to keeping detailed information a secret (e.g. energy intensity of the production and delivery), claiming a possible loss in bargaining position and fearing discussions on market prices. Therefore, emission inventories are usually based on a mixture of different calculation approaches covering measured and generic values. Due to the fact that a high level of accuracy can only be obtained when primary consumption data is used, the basic ambition should be to have as much as primary data as possible. Otherwise the frame for interpretation is weak and it will be hard to identify actual savings potential.
3. Deriving environmental performance indicators for logistics services at logistics facilities
In general, figures related to GHG emissions are advantageous in that different processes of energy or resource consumption can be transferred into one collective value. Tracking emissions over time in a consistent manner facilitates a continuous improvement process and is beneficial to cut purchasing volumes, related costs and related emissions. Due to the fact that logistics facilities undergo significant changes in order quantities, logistics items handled, or demanded services year after year, the informative value of absolute GHG emissions is limited. The problem can be solved with environmental performance indicators (EPI) that put the annual amount of GHG emissions in reference to the relevant logistics performance (e.g. number of goods handled at a logistics facility). Besides, EPIs are well-suited to allocate GHG emissions to customers based on their specific demand of services.
In order to define appropriate EPIs, it’s important to analyze how the material flow in logistics facilities is usually described. In practice, a large variety of approaches exist (e.g. economics, frequency of use, reliability, quality). Richards 2014 comprehensively presents indicators for the performance management at logistics facilities. In having analyzed the reference values of common indicators, three different categories can be distinguished (cf. Fig. 2). Typically, physical values refer either to the throughput (e.g. average throughput), to the inventory levels/available space (very often weighted figures on the basis of required space) or to the packaging/waste intensity of logistics items (e.g. packaging intensity of parcels).
Fig. 2. Approaches to describe the material flow of logistics facilities in regard to energy and resource consumption.
3.1. General aspects of deriving environmental performance indicators for logistics facilities (allocation scheme)
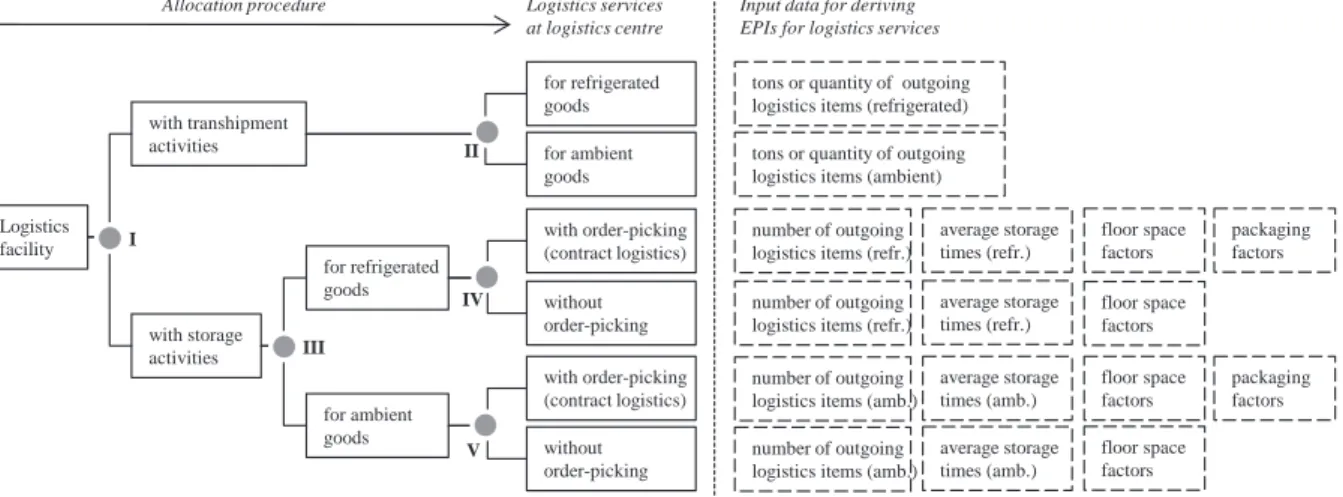
In order to derive meaningful EPIs for logistics services at logistics facilities, it’s required to consider the various elements that can be used to characterize logistics facilities. With regard to the aspects presented earlier, an appropriate allocation scheme has to reflect different types of logistics facilities, the logistics services offered, the significance of processes for a logistics facility’s GHG emissions inventory and appropriate reference values to describe consistently the characteristics of material flow. Figure 3 provides an overview of the allocation scheme which has been developed in the research project 'Green Logistics' and lists the data required to derive EPIs for logistics facilities. In general, the allocation scheme follows a two-step procedure. First, it is required to determine sub-sets of total GHG emissions for the logistics services offered at a logistics facility. Second, for each sub-set of GHG emissions, service-specific EPIs can be determined. Considering the example of a combined transshipment terminal (e.g. container terminal at a seaport) that offers only the services of transshipping regular containers (ambient) and reefer containers (refrigerated) the relevant part of the allocation scheme is the first two lines. In other words, the container terminal can be described as a logistics facility with transshipment activities for ambient and refrigerated goods (cf. Fig. 3). Consequently, two different EPIs need to be derived (i.e. EPI (ambient) and EPI (refrigerated)).
The roman numerals in figure 3 refer to decision points where companies need to allocate appropriate parts of energy and resource consumption to sub-sets. At best this can be realized by identifying general causalities between
services/emissions and by using measured consumption values. If for some reason this cannot be realized (e.g. one central electricity meter for several services), companies should consider the use of approximation approaches. The technical report of the assessment method 'Green Logistics' (step 3) illustrates typical causalities and provides approximation approaches for different logistics services (cf. Green Logistics Method). In considering the example of the container terminal and having derived two sub-sets of GHG emissions, service-specific EPIs can now be determined. For instance, the EPI for the transshipment of refrigerated goods is a result of dividing the specific sub-set of GHG emissions by the tons or quantity of outgoing logistics items (refrigerated).
Fig. 3. Overview of the allocation scheme and the data requirements to derive EPIs for logistics services.
3.2. EPIs for the storage of ambient goods in a warehouse with order-picking processes (contract logistics)
This section aims at illustrating the derivation of EPIs for the storage of ambient goods in a dedicated warehouse with order-picking processes (cf. Fig. 4). In practice, such a logistics service is commonly described as a contract logistics service. To begin, outgoing logistics items need to be classified in respect to greater differences of the material flow characteristics (cf. Fig. 2) or in respect to other company-specific criteria. Typically at a contract logistics warehouse, one can find pallets and parcels which can differ significantly in regard to the packaging/waste intensity. Thus, at a minimum, these logistics items should be distinguished at contract logistics warehouses.
Fig. 4. Data requirements to derive EPIs at a dedicated warehouse for ambient goods (contract logistics).
The total GHG emissions can be sorted into three main groups (cf. Fig. 1): energy, maintenance and packaging/waste. Having analyzed various options for different types of warehouses, it seems most suitable for warehouses to allocate GHG emissions of energy and maintenance processes to floor-space figures (m2) and to allocate packaging/waste related GHG emissions to the numbers of outgoing items. With regard to floor-space figures and the idea to define a simple but consistent calculation approach, it seems quite reasonable to consider the space which is related to the number of storage positions. Compared to other methods, this approach has the advantage that the actual available storage space can be calculated uniformly. The results are not influenced by the specific design of the warehouse (e.g. high bay warehouse, shelf warehouse).
The allocation procedure for warehouses is based on floor-space weighted inventory levels and for packaging/waste related GHG emissions on the numbers of outgoing items (weighted). This requires companies to determine for each considered logistics item (݅) two different weighing factors: floor-space factor (ݏ݂) [m2/item] and packaging factor (݂) [g CO2e/item]. The inventory levels (ݏݐܿ݇) can be derived from numbers of outgoing items (݅ݐ݁݉ݏ) and the average storage time measured in days (ݐ). Packaging/waste intensities should be based on item-specific average consumption values (ݍ). The equations for EPIs (݁) for contract logistics services are:
Logistics facility with transhipment activities with storage activities for refrigerated goods for ambient goods for refrigerated goods for ambient goods with order-picking (contract logistics) without order-picking with order-picking (contract logistics) without order-picking I II III IV V
Allocation procedure Logistics services at logistics centre
Input data for deriving EPIs for logistics services
tons or quantity of outgoing logistics items (refrigerated)
tons or quantity of outgoing logistics items (ambient)
number of outgoing logistics items (refr.)
average storage times (refr.)
packaging factors
number of outgoing logistics items (refr.)
average storage times (refr.)
number of outgoing logistics items (amb.)
average storage times (amb.)
packaging factors
number of outgoing logistics items (amb.)
average storage times (amb.) floor space factors floor space factors floor space factors floor space factors
݁௪௨௦=
ாೝାாೌೌ
σቆ൬ೞయలబೌೞ × ൰ × ௦ቇ
with ݅= 1, … ,݊ (݊= number of logistics items) (2)
݁=
σ(௫௧௦)
σ ௧௦ with݅
= 1, … ,݊ (݊= number of logistics items) (3)
and ݂=σ൫ݍ×ܧܨ൯ for k = 1, …, ݉ (݉= packaging/waste categories)
4. Example validation of the assessment method and allocation scheme
DB Schenker Logistics includes carbon reporting of all its logistics sites since 2008. Within the scope are all Scope 1-3 emission sources like energy consumption (oil, CNG, propane gas, district heating, electricity, petrol and diesel) from on-site sources (heating, cooling, forklifts, electronic devices, lighting) as well as upstream/downstream emissions from business travel and company cars including cooling gas leaks. The emission factors have been provided by external institutions and eco inventory databases (Ecoinvent, Gemis). The emissions are referred to m2as a normalizer and clustered
in functional areas (offices, warehouses and terminals) as well as climate regions (with/without heating). As heating and electricity have been identified as the main drivers, a target has been set to reduce energy consumption by 18% per m2
(2013-2020).
DB Schenker Logistics participated in the 'Green Logistics' research project and has extensively supported the development of a standardized assessment and allocation method for logistics facilities. From the end of 2013 until the beginning of 2014, three different logistics facilities have been analyzed (i.e. a cross-docking center for palletized goods, a warehouse for sanitary equipment and an automotive spare parts warehouse) (cf. Tab. 3).
Table 3. Exemplary implementations of the method presented at logistics facilities of the research partner DB Schenker.
Name Cross-docking center for palletized goods in Northern Germany Warehouse for sanitary equipment in Northern Germany Spare parts warehouse for an automotive production plant in Northern Germany
Class of logistics facility
Dedicated transshipment terminal for ambient goods
Dedicated warehouse for the simple storage of ambient goods
Dedicated warehouse for storage of ambient goods with order-picking (contract logistics) Property
description
Total logistics area: 31,400 m2
Building floor area: 5,100 m2
Open area: 26,300 m2
Total logistics area: 27,000 m2
Building floor area: 10,500 m2
Open area: 16,500 m2
Total logistics area: 55,000 m2
Building floor area: 50,000 m2
Open area: 5,000 m2
Performance description
Outgoing goods (2013): 6,255,644 tons (freight)
Outgoing goods (2013): 143,000 small cardboards and 143,000 large cardboards Average storage times (2013): 45 days for small cardboards and 15 days for large cardboards
Outgoing goods (2014): 1,300,000 boxes and 330,000 pallets
Average storage times (2014): 17 days for boxes and 7 days for pallets
Allocation factors
-Floor space factors: 0.1 m2per small
cardboard and 1 m2per larger cardboard
Floor space factors: 1.37 m2per pallet and
0.08 m2per box
Packaging factors (2014): 30,32 g CO2e per
box and 119,45 g CO2e per pallet
GHG emissions and sources
482.34 Mg CO2e (2013):
50% yard logistics, 41% electricity, 9% heat (geothermal energy system)
158.54 Mg CO2e (2013):
68% electricity, 27% heat, 5% foil purchase
2,830.70 Mg CO2e (2014):
66% electricity, 29% heat, 2% yard logistics, 2% cardboard recycling, 1% foil recycling
EPIs EPI 2013 (transshipment): 77.10 g CO
2e/ton (freight) EPI 2013 (warehousing): 20.67 kg CO2e/m2(inventory) EPI 2014 (warehousing): 206.63 kg CO2e/m2(inventory) EPI 2014 (packaging): 48.37 g CO2e/dispatch item
The characteristics of the logistics facilities vary a lot in terms of logistics area, services realized and other technical/ organizational attributes (e.g. technical equipment, operating times). That is why the total GHG emissions of a given reference year show significant differences (from 158.5 Mg CO2e to 2,830 Mg CO2e). According to the requirements of the
allocation scheme (cf. Fig. 3) GHG emissions of transshipment activities have been allocated to the quantities of outgoing freight (measured in tons) and GHG emissions of warehousing activities to the average size of area used by inventory units (measured in sqm). For the service of contract logistics, an additional EPI has been derived to assess and monitor the packaging/waste intensity of different dispatch items in a sophisticated fashion.
Hence the manager of the cross-docking center should try to maximize that throughout while simultaneously reducing the energy and resource consumption. The manager of a warehouse needs to optimize the ratio of storage space used and the energy and resource consumption related. In case of several dispatch items that show significant differences in
packaging/waste intensity (e.g. ~30 g CO2e per box and ~120 g CO2e per pallet), managers should consider the benefit of
additional EPIs for tracking progress towards a given GHG target (cf. spare parts warehouse).
5. Conclusion and Outlook
How to assess, monitor and manage GHG emissions at warehouses or terminals still is a major research and standardization issue. That is why this paper has addressed the development of a comprehensive assessment and allocation methodology. The applicability has been proved in a broad industrial context. This paper has focused on the results of exemplary implementations at the logistics facilities of DB Schenker Logistics. On the base of the presented EPIs, managers of logistics companies can develop suitable decarbonization strategies and foster an organizational or technological improvement process that aims at reduced carbon intensity. For future research, there is a need to develop further the classification model of logistics sites in regard to the energy intensity of processes and influencing factors. Furthermore, it is of high importance to improve the inter-company comparability of carbon footprints with standardized emission factors and a set of interpretation parameters.
References
COFRET: Carbon Footprint of Freight Transport. http://www.cofret-project.eu
Decree 2011-1336. Ministry of Ecology, Sustainable Development, Transport and Housing (Ed.), Decree n° 2011-1336 of 24.10.2011 on information on the quantity of carbon dioxide emitted during transport services
Defra 2013: Environmental Reporting Guidelines: Including mandatory greenhouse gas emissions reporting guidance. Department for Environment, Food & Rural Affairs, June 2013
DG MOVE Study, 2014: Fact-finding study in support of the development of an EU strategy for freight transport logistics. Lot 3: Introduction of a standardized carbon footprint methodology. European Commission, DG for Mobility and Transport. http://ec.europa.eu/transport/themes/sustainable/consultations/2014-06-13-harmonised-carbon-footprinting-measures_en.htm.
DHL Glossary: https://www.dhl-discoverlogistics.com/
Dobers et al., 2014: Comparability of the Environmental Effects of Logistics Services, Sector Guidance for Ecological Assessments. Transport Research Arena, Paris
EcoTransIT: Ecological Transport Information Tool for Worldwide Transports. http://www.ecotransit.org/index.de.html EED 2012/27/EU: Directive 2012/27/EU of the European Parliament and of the council of 25 October 2012 on Energy Efficiency EMAS. Eco Management and Audit Scheme. EU EMAS-Regulation 2010
EN 16258. Methodology for calculation and declaration of energy consumption and GHG emissions of transport services (freight and passengers). BSI EN Standard 16258:2012
GLEC: Global Logistics Emission Council. http://www.theglec.org
Green Efforts: Green and Effective Operations at Terminals and in Ports. http://www.green-efforts.eu/ Green Freight Europe: http://www.greenfreighteurope.eu/
Green Logistics Method: Procedure for the allocation of emissions (step 3) of the Green Logistics Method. http://green-logistics-network.de/en/download/reports
Green Logistics: German Research Project of Efficiency Cluster Logistic Ruhr. http://www.green-logistics-network.de/en
Higgins et al., 2012: Varieties of Logistics Centers, Developing a Standardized Typology and Hierarchy. Transportation Research Record Journal of the Transportation Research Board, 12/2012, Canada
Huber, S. et al., 2014: Integration of Transport Hubs in Freight Transport Hubs in Freight Transport Demand Modelling. European Transport Conference, Frankfurt a. M.
IPCC, 2014: Summary for Policymakers. In: Climate Change 2014: Mitigation of Climate Change. Contribution of Work-ing Group III to the Fifth Assessment Report of the Intergovernmental Panel on Climate Change. Cambridge University Press, Cambridge and New York, p. 6 ISO 14040 & 44. Environmental management – Life cycle assessment. (2006) ISO Standard
ISO 14064 & 14065. Greenhouse gases - Parts 1, 2 and 3 (2006); Requirements for greenhouse gas validation and verification bodies for use in accreditation or other forms of recognition (2007). ISO Standard
ISO 50001. Energy Management. BSI ISO 50001:2011
ITEC: Intermodal Terminal Eco-Efficiency Calculator, http://www.intermodal-terminals.eu/content/e2/e596/index_eng.html
IWA 16 report: International Workshop Agreement IWA 16:2015: International harmonized method(s) for a coherent quantification of CO2e emissions of freight transport, First edition, 2015-02-01
McKinnon, A., 2015: Green Logistics, Improving the Environmental Sustainability of Logistics. Kogan Page, London, 3rd
edition, pp. 196 Richard, G., 2014: Warehouse Management, A Complete Guide to Improving Efficiency and Minimizing Costs in the Modern Warehouse. Kogan
Page, London. 2ndedition
UBA 2013: Entwicklung der spezifischen Kohlendioxid-Emissionen des deutschen Strommix in den Jahren 1990 bis 2012. 07/2013 WEF 2009: Supply Chain Decarbonization, the role of logistics and transport in reducing supply chain carbon emissions, 2009
WRI and WBCSD, 2005, 2013: GHG Protocol Corporate Standard (2005); Corporate value chain (Scope 3) accounting and reporting standard: supplement to the GHG protocol corporate accounting and reporting standard (2013). Washington, DC, Geneva, Switzerland