Session-Based Overload Control in QoS-Aware
Web Servers
Huamin Chen and Prasant Mohapatra
Abstract—With the explosive use of Internet, contemporary web servers are susceptible to overloads and their services deteriorate drastically and often cause denial of services. In this paper, we pro-posed two methods to prevent and control overloads in web servers by utilizing session-based relationship among HTTP requests. We first exploited the dependence among session-based requests by analyzing and predicting the reference patterns. Using the depen-dency relationships, we have derived traffic conformation functions that can be used for capacity planning and overload prevention in web servers. Second, we have proposed a dynamic weighted fairing sharing (DWFS) scheduling algorithm to control overloads in web servers. DWFS is distinguished from other scheduling algorithms in the sense that it aims to avoid processing of requests that belong to sessions that are likely to be aborted in the near future. The experimental results demonstrate that DWFS can improve server responsiveness by as high as 50% while providing QoS support through service differentiation for a class of application environ-ment.
Index Terms— Capacity planning, Dynamic weighted fair shar-ing, Overload control, Quality of service, Scheduling algorithm, Service differentiation, Session-based control, Web server.
I. Introduction
As the wide spread usage of web service grows, the number of accesses to many popular web sites is ever increasing and oc-casionally reaches the limit of their capacity and consequently causes the servers to be overloaded. As a result, end users ei-ther receive busy signal or nothing at all before the browser indicates a time-out error or the user aborts (stops) the request. Subsequently, the server may get choked or crash causing denial of services. Such abnormality is often regarded as the servers’ poor quality and compromises their long term survivability. In e-commerce applications, such server behavior could translate to sizable revenue losses.
Research on overload prevention and control has been lim-ited compared to the other issues such as web caching, repli-cation etc., which addresses the performance improvement of web servers. These performance enhancement techniques, how-ever, are inadequate in ensuring a busy web server from being overloaded due to the fact that the web traffic is highly volatile and bursty [10], [15]. Proper capacity planning and forecast-ing methods can prevent servers from beforecast-ing overloaded under controlled traffic conditions.
In many web sites, especially in e-commerce, online brokers, and supply chain sites, majority of the requests in the web traffic are session-based. A session contains temporally and logically related request sequences from the same client. Sessions can H. Chen and P. Mohapatra are with the Department of Computer Science, Engineering II, One Shields Avenue, University of California, Davis, CA 95616. Email:{chenhua, prasant}@cs.ucdavis.edu.
be identified either by HTTP/1.1 persistent connections [12] or from the state information within the presence of cookies [14]. Sessions exhibit distinguishable features from individual requests. For example, session integrity requires that once ad-mitted for processing, all the following requests within a session should be honored. Similarly, session affinity would require that requests belonging to the same session are handled by the same front-end server for security and locality reasons. These features may complicate or contradict the research conclusions of the per-formance studies on web servers where the number of request completions have been considered as the primary performance measure. For example, admission control on per request basis may lead to a large number of broken or incomplete sessions when the system is overloaded. Capacity planning schemes based on individual requests also have the same deficiency.
Session integrity is a critical metric for commercial web ser-vice. For an online retailer, the more the number of sessions completed, the more revenue that is likely to be generated. The same statement cannot be made about the individual request completions. Sessions that are broken or delayed at some critical stages, like checkout and shipping, could mean loss of revenue to the web site. From the end users’ perspective, this means poor service availability. Therefore, it is more useful to use session integrity to evaluate the service availability of servers, especially during high-load periods.
In this paper, we explore the session characteristics and their potential in overload control and prevention. A workload char-acterization study is done first to gain an insight to the load pat-terns in web servers. The workload characterization study was based on the server log from a popular online retailer. We found that, despite the seemingly complication of session sequences, some statistical results can used in simplifying the session-based traffic model. Based on these results, the session logic can be utilized for capacity planning of QoS-aware servers and request scheduling, which improves server’s productivity. We have done an experimental study by modifying the scheduling scheme of the Apache web server. The proposed dynamic weight fair shar-ing (DWFS) scheme provides a performance improvement of about 50% in terms of response delay and significantly reduces the session abortion rate for the workload and system configu-ration used in the experimentation.
The rest of the paper is organized in the way. Section II char-acterizes session-based HTTP requests. Section III provides capacity planning tools to prevent server overload. Section IV proposes a request scheduling algorithm to control server over-load and improve server performance followed by the experi-mental results in Section V. The related works are discussed in Section VI followed by the concluding remarks in Section VII.
II. Session-Based Web Traffic Characterization A session during web accesses can be represented as a finite state machine with each state representing a stage that a request is undergoing. Figure 1 depicts an example of such representation. The directed arc (A,B) represents a transition from stateA to state B with a probability P(A,B). The four states A, B, C, D could be representing states corresponding to main menu, checkout, browsing and search in an e-commerce site.
A B C D P(A,D) P(A,B) P(B,C) P(B,A) P(C,A) P(A,D) P(B,D) P(C,D)
Fig. 1. An example of a web session represented as a state machine. In web service, a stage can be a single URL or a group of URL’s that have the same reference pattern and resource claim profile. A session can be compulsory or voluntary. A com-pulsory session refers to the situation in which the descendant requests are generated by the browsers instead of clients. The requests for embedded image files within an HTML page is an example of this case. We call the page that has embedded files as themain page. In voluntary sessions, the descendant requests are generated by the clients explicitly. For example, the client clicks a link within the current main page to browse another page. In current web server architecture, most of the image files are served by edge servers [2] or dedicated image servers which are physically separated from those serving the main pages. There-fore, the performance of these servers is largely affected by the service of main pages. Thus, the following discussion is focused on voluntary sessions.
During our research, we obtained the trace of accesses to a server from a popular online retailer1. Based on the reference
traces, we characterized the basic behavior of session-based traf-fic.
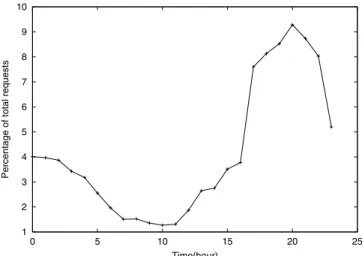
The characterization are derived from a typical daily traffic trace. Previous studies [10] have characterized the web traffic as very bursty, which is also observed in our result shown in Figure 2. From Figure 2, it is observed that the traffic load is highest during the period of 17:00 to 23:00 hours, which accounts for over 50% of the daily traffic. The traffic volume peaked at 20:00-21:00, where nearly 10% of overall requests were initiated. So the server is presumably more heavily loaded during this period (during evening hours), which was confirmed from the server side performance data recorded by the MS Performance Monitor. We further investigate the relationship between request queue length (the waiting requests and those being served) and the request processing time under heavy server load. Since the pro-cessing time for individual URL’s varies, for fair comparison, we adopt the stretch factor from [23], which refers to the quotient between the current processing time and the processing time of the same URL under normal load. The stretch factor reflects
1We refrain from mentioning the name of the retailer honoring a
non-disclosure agreement. 1 2 3 4 5 6 7 8 9 10 0 5 10 15 20 25
Percentage of total requests
Time(hour) Fig. 2. Traffic histogram of the server trace for a day.
the current server load. Figure 3 depicts the queue length and stretch factor during the 20:00-21:00 period. It is observed that the two curves show similar pattern, indicating that the server load is proportional to the queue length. While the queue length is a good indication of server load, the nature of the jobs in the queue also has a great impact on server performance. Servers whose workload is dominated by static files (like HTML pages, images) generally perform better than the ones with high propor-tion of dynamic files (like CGI, ASP, etc). Therefore, unless the composition of workload is comparable, using the queue length as an indicator of server load is incorrect.
10 100 1000 10000 0 10 20 30 40 50 60 Time(minute) Queue length Average stretch factor
Fig. 3. Queue length and stretch factor.
We sorted the requests into different queues according to their nature (main menu, checkout, search, browsing) and analyzed the composition of workload at each time period. These queues usually have different resource consumption profiles. For main menu queues, the major task is static HTML and image files ren-dering, and the update frequency is relatively low. For checkout queues, the process is SSL-secured and thus is very CPU inten-sive. For search queues, the back-end database is queried and the server only receives the query results and assembles them in HTML format. Browsing queue is like main menu queue except that more image files are rendered. Figure 4 presents the nature of the workload composition during the period
20:00-21:00, which is observed to be relatively stable.
It has been realized that the requests within a session reveal statistically dependent relationship[7][17]. Conclusions from these studies show that historic reference patterns can be ex-ploited to predict the subsequent requests. Prediction method of subsequent requests within a session are different. In this study, we use the transition probability for prediction, which derives the subsequent URL from the current one. This method requires no sophisticated mathematical modeling and uses less compu-tation power in practice. The probability is obtained either from offline historic records like server logs or from online statistics. The work in this paper is based on this method, however other methods can also be applied in a similar way. We will later show that even with this simple prediction method, the performance improvement is significant. 0 0.1 0.2 0.3 0.4 0.5 0.6 0.7 0 10 20 30 40 50 60
queue 1 queue 2 queue 3 queue 4 Fig. 4. Queue composition for the 1 hour duration.
Figure 5 shows the transition probability (in percentage) ma-trix among the stage vector components: main menu(MM), checkout(CO), search(SR), browsing(BR) from the online re-tailer’s server log. The row vectors show the transition from one stage to another. For example, the second row indicates that the transition possibility from CO to MM, CO, SR, and BR is 13.5%, 44.9%, 40.2%, and 1.4%, respectively. The server log file format follows W3C extended logging [18]. Each request entry contains a user ID for the login user which facilitates the identification of session owners. Session integrity is maintained by the IIS server (Microsoft Internet Information Server).
MM CO SR BR
MM 74.8 0.6 19.5 5.1 CO 13.5 44.9 40.2 1.4 SR 18.1 3.4 74.3 4.3 BR 13.7 1.0 14.6 70.7
Fig. 5. State transition matrix.
Another issue related to the session behavior is the user think-ing time between consecutive requests within a session. It is ran-dom in nature and varies for different web sites. In our server trace, the thinking time was usually short and less than 60 sec-onds. Characterization of other traces reveals similar results.
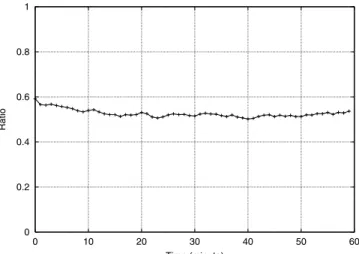
When the traffic is high, which is the case for heavily loaded servers, the long term effect of the thinking time can be ignored. Finally, when evaluating the relationship between the num-ber of outstanding requests and the numnum-ber of active sessions, we found that the ratio between the two is stable. Though each session can fork several requests simultaneously, the fact that others do not send any requests offsets it, which makes the over-all behavior as stable. Figure 6 shows this ratio for the trace of the period 20:00-21:00. In this figure, the average value is 0.526 with standard deviation of 0.017, which means the variation is small and the ratio is stable. This result is useful in estimation of the request arrival rate based on the number of active sessions.
0 0.2 0.4 0.6 0.8 1 0 10 20 30 40 50 60 Ratio Time (minute)
Fig. 6. Ratio of request arrival rate to session generation rate.
Obtaining server traces from e-commerce sites has been dif-ficult due to security and propriety reason. We could manage to get the traces from one corporation. Although our analysis and results use only this set of trace, the proposed methodology is applicable for any other server trace. So we have laid em-phasis on the methodology, the trends, and relativeness of the results, rather than the absolute numbers (which are specific for the trace).
III. Session-Based Capacity Planning
We have considered QoS-aware web servers for our study, in which requests are served based on their priority levels. The basis of priority assignment is actively discussed in [11] and is beyond the scope of this study. In QoS-aware web servers, an important and interesting performance metric is the delay bound, which is the maximum response delay a request encoun-ters. Besides the processing time of each request, there are other latencies associated with the service of a request, such as queu-ing delay and network transmission delay. In this paper, we only consider the delay at the server side. The study of network delay is not within the scope of this paper and being extensively stud-ies in literature [11]. We assume that the service level agreement (SLA) that can be provided by a web server would consist of a bounded delay for each QoS level if the request arrival rate does not exceed an agreed amount. From the web server perspective, QoS attributes are defined in terms of the maximum rate of re-quest arrival and the latency bound of each rere-quest. An SLA can thus be stated in terms of(λ, δ, s), whereλis the maximum rate
of arrival,δis the delay bound, andsis the proportion of requests that meet the delay bound. In a QoS-aware web server, overload is said to occur when the SLA is violated for an extended period of time. Thus, we formally define overload as follows.
Consider a predefined SLA for a specific QoS level is(λ, δ, s). If for an extended period of timeT, while the arrival rate is less thanλ, the proportion of requests that meet the delay bound stay less thans, the web server is said to be overloaded. It is implicit in this definition that the SLA negotiation was done considering the server capacity and current conditions.
The following analysis focuses on the worst case where re-quests compete for CPU resources. The QoS rules are defined for each of the URL’s or for URL groups. The SLA specifies the delay bound of the QoS groups when the request arrival rate is below some threshold.
Notations Description
Pa,b state transition probability fromato
b λi
a request arrival rate of session classi
to statea
µi
a request departure rate of session
classifrom statea
di
a delay bound of classiat stagea
Ta processing time at stagea
φi session generation rate of classi
rrs ratio between the number of
re-quests and the number of sessions TABLE I
Notations used for the analysis.
We only consider a steady-state system because a transient model is mathematically intractable and may be of little practical use. In a steady-state system, the number of requests arriving at and departing from the server must be equal. Thus, the arrival rateλpi is equal to the departure rateµpi under the steady-state assumption.
The turnaround time at each stage is less than the lower limit, which is the sum of the delay bound and the processing time. Thus,
µpi ≥ T 1
i+dpi.
Consider that the input to each stage is the output from the other stages with certain transition probability. Excluding the source and sink stages, we then have
λpj =µpi ∗Pi,j=µp·Pj
whereµp andPj are the vector forms ofµpi andPi,j and the second expression is the dot product.
With a preemptive priority scheduling discipline, the high pri-ority requests are scheduled before the low pripri-ority ones. Thus the departure rate of a priority group is less than the service rate of higher priority groups.
1 Ti+dpi ≤µ p i ≤ λ p i p j=1λji ∗Ti (1) Using the steady-state assumption,
1 Ti+dpi ≤λ p i ≤[ λ p k p j=1λjk∗Tk ]·Pi (2)
Finally, using inequation 2 for all the stages and presenting in a matrix form, we get:
[T 1 i+dpi]m∗n ≤[λ p i]m∗n≤[ λ p k p j=1λjk∗Tk ]m∗n∗[P]n∗n (3)
wheremis the number of priority groups andnis the number of stages. We call this expression as the traffic conformation inequation.
Inequation 3 reveals the the relationship between delay and traffic volume of the QoS priority groups. To infer the SLA from this function, we can work in a stepwise manner. It is obvious that for the highest priority, the request arrival rate at stage i is constrained by
1 Ti+d1i ≤λ
1
i
In practice, theλ1i can be set to its lower bound so that they will not cause excessive delay for the lower priority groups and maximize system utilization by allowing more requests into the system. Thus the arrival rate of the next immediate priority group is bounded by 1 Ti+d2i ≤λ 2 i ≤[ λ 2 k 2 j=1λjk∗Tk ]∗Pi
Similarly, the arrival rate of other priority groups can be ob-tained.
After obtaining the request arrival threshold, it is easy to de-fine the session generation rate using ratiorrs. As discussed in Section 2,rrsis more or less stable when the traffic volume is high. Thus the session generation rate of classiis given by
φi=rrs
λi
j (4)
IV. Productive Scheduling Algorithm
Several factors are responsible for causing the server output to degrade. Apart from the intrinsic mismatch of operating system entities, scheduling of requests is another critical factor. For example, queues consisting of time-consuming requests have a good chance of getting accumulated. As a result, they could dominate in controlling CPU resources in a round robin schedul-ing mode. Consequently, more time is spent on these queues and the effective overall output is degraded. Intuitively a con-servative admission control can prevent the server from being overloaded. But such conservativeness is not easy to realize because of the burstiness of traffic and the likely-hood of the
server under-utilization. We believe a relatively relaxed admis-sion control assisted by an efficient scheduling algorithm is a better alternative. The admission control admits as many ses-sions as possible so long as the server is not overloaded. Our previous work on admission control based on predictable service time [8] could serve this purpose. In addition, the scheduling algorithm takes care of the situation when the admitted sessions are beyond the server’s capacity. It seeks the best scheduling that produces as many completed sessions (not necessarily requests) as possible.
In the context of sessions, each of the waiting queue repre-sents a particular task of the session sequence and its output serves as input to the other queues. So proper shaping of these queues by means of priority scheduling among different queues can alleviate overload conditions. This is the basic idea of our scheduling algorithm.
Another phenomenon that is frequently observed in web servers is that during overload, more number of tasks gets aborted. Before abortion, these tasks consume excessive system resources during the crunch period. To resolve this ill-effect we use a scheme of scheduling where the portion of sessions that have a higher probability of getting completed are scheduled first.
A. Scheduling Algorithms Comparison
The popular scheduling algorithms that are used in web servers include round robin (RR), earliest deadline first (EDF) and weighted fair sharing (WFS). RR and EDF do not consider the relationship of inter-session request transition thus they can-not help in session-based overload control. WFS provides higher levels of service to the tasks that have higher priority. Thus the queue length accumulation at some stages can reach a steady-state by lowering the request injection rate and raising the service rate. However, this discrimination increase request accumula-tion at other queues, which in turn would result in request drops because of timeout. This domino effect disrupts the normal re-quest transition flow into other queues and eventually leads to lower throughput in terms of the number of completed sessions. We introduce a measure calledserver’s productivity, which is defined as a function of request completion and request error rate for a server, and can be formally expressed as follows. Server’s productivity during time intervalT:
If the number of requests completed withinTisc, and the num-ber of requests aborted during this time ise, then theserver’s
productivityduringT is(c−e).
A request abortion occurs either because of some of the inter-nal problems at the server side or due to the processing timeout imposed by the script language like ASP and PHP. A request could also be aborted by the user because of the impatience. Ignoring the internal problems of the server, we use request timeout to represent all the server processing failures. To illus-trate how the weight assignment could affect server productivity, we simulated a round robin scheduler and collected the results under different weight assignments. The simulator has 4 queues corresponding the four states (MM, CO, SR, BR) with the same
transition probability as was listed in Figure 5. The processing time of the stages is 0.5, 1, 1.5, and 2, respectively. The timeout duration was assumed 20 time units and the simulation dura-tion was set to 10,000 time units. The more weight a queues is assigned, the more CPU time it can use. Table II displays the different server productivity. It is observed that proper weight assignment can significantly improve the overall performance by increasing the number of completed requests and reducing the number of timeouts. In this set of results, the best case perfor-mance is nearly 8 times better than the worst case. This inference inspires to seek productivity improvement through appropriate weight assignment. Weight as-signment requests completed requests timed out server’s productiv-ity (1,1,1,1) 3077 747 2330 (5,1,1,1) 3930 616 3314 (1,5,1,1) 1585 826 759 (1,1,5,1) 2520 880 1640 (1,1,1,5) 1685 879 806 (5,1,5,1) 3463 477 2986 (1,5,1,5) 1161 767 394 TABLE II
Server’s Productivity comparison.
Next we propose adynamic weighted fair sharing (DWFS)
scheme based on the temporal relationship in web session in such a manner that the weight distribution is not static all the time. Instead, it depends on the accumulation at the queue and the output rate with the goal to improve the server productivity. Unlike the traditional algorithms that seek short term through-put improvement, DWFS tries to smooth the domino effect of overloads in pursuit of sustained throughput.
B. Dynamic Weighted Fair Sharing (DWFS)
The objective of DWFS is to improve the server’s productiv-ity through dynamic weight assignment for scheduling purpose. In an overloaded server, processing at one queue is not pro-ductive when it overwhelms other queues. For example, in an e-commerce server, the merchandise browsing and checkout are two queues. If the browsing queue is processed faster than the checkout queue, then the clients proceed to check out only to be jammed, and most of the requests get timed-out. In this case the browsing queue is unproductive. On the other hand, if the server distributes more weight on check out queue such that the requests in the browsing queue will experience longer but tol-erable service time, then the input to the downstream checkout queue is reduced and their probability of receiving service is in-creased, consequently the end user can perceive a faster service. The other aspect of DWFS is that, if a server knowsa priori
that the request it is serving is unproductive, it can stop or delay processing the current request queue and transfer the weight to serve other queues to improve the server’s productivity.
The modeling tool used for DWFS is a queuing network with limited waiting room. A k-waiting room queue can accommo-date at most k entries waiting for service and the new arrivals
are simply dropped. More specifically, as a measure to allow dynamic weighing, k is defined to be the quotient of service time and session timeout period. Each output from a queue produces a credit if the output goes to a queue that is not yet full (produc-tive queues). The credit reflects the produc(produc-tiveness of the ser-vice. If service to a queue is known to be unproductive, then its weight is transferred to handle other queues. This conflicts with philosophies behind some other scheduling algorithms who seek maximal throughput from the server in all situations. In DWFS, some jobs may be dropped or delayed even though they could have been served before deadline if more weight were assigned to them. However, for the long run, more incoming requests can meet their service expectation thus the overall throughput increases. If the drop rate is not high to overshadow the through-put, the server’s productivity improves.
Productivity function: f(n) = n i=1 n j=1 Pi,j∗1(Lj∗wTj j < T imeout) (5)
wherewj is the normalized weight assigned to queuejandLj is the queue length. 1(x) = 1ifxis true,0otherwise.
The productivity function defined in equation 5 states that if the output from a queue is served before the deadline, then it is considered productive. The productiveness of the output is determined by the destination it leaves for; if the destination queue is full, then no credit is earned but a penalty is imposed, otherwise a credit is added. The credit can also be inversely pro-portional to the queue length to avoid filling up the queue. Since there are more than one possible destinations for the output, the credit is reflected by multiplying it with the transition probabil-ity. The capacity of the waiting room depends on the service weight; the more weight assigned to the queue, the less time a request takes to complete, and more requests can be served before the timeout period expires.
The objective of the productivity function is to distribute the weight to maximize the functionf(n). One can solve the above function and obtain the optimal weight assignment at any par-ticular moment. We have written a solver program as we did in the implementation of the web server’s scheduling code.
It is inferred from the productivity function that, when other parameters are fixed, the timeout value determines the urgency of the session. Later in the section V, we will discuss the impact of quality differentiation based on the timeout value.
V. Experimental Performance Evaluation From the above discussion, we can see that the DWFS’s ap-proach to relieve an overloaded server is to add weights on those requests whose descendant requests within the same session can be honored. Those requests whose descendant requests are pre-dicted to miss their delay bound are delayed for later processing. To verify the feasibility of this scheme, we implemented the al-gorithm in an Apache web server and evaluated its performance.
A. Experimental Setup
The test-bed contains a web server and several clients. The server has an Intel PIII 733MHZ CPU and 128MB RAM, run-ning Apache 1.3.19 for MS Windows 2000. Apache [3] is an open source, widely used web server. At runtime, the Apache server consists of worker processes (or threads in some systems like MS Windows) and controllers. Each of the worker processes handles one connection from a job pool that the controller pro-cess keeps feeding into. This working mechanism does not fit to DWFS in the sense that the worker processes have no control over the job queues. We have changed the way new jobs are added by modifying the Apache code. As shown in Figure 7, instead of connections, in our modification, the jobs are HTTP requests and the parser sorts them into different queues based on their URL’s and records the timestamp they are added into the queue. Then the priority assigner assigns different priority to the requests based on their IP addresses. The DWFS module exercises the DWFS algorithm to assign jobs to the worker pro-cesses and drops the requests that have timed out. Since Apache server itself has no control over the CPU time slot, the weights are assigned as the requests from the queues are dispatched to the ready queue. At this time, the request that exceed the timeout are dropped. Finally the processor handles the requests within the ready queue.
HTTP request parser stage 1 stage 2 stage 3 stage 4 priority assigner DWFS ready queue processor HTTP response request timeout
Fig. 7. Implementation paradigm.
The clients used in the test-bed are several Sun UltraSparc 10 workstations running Solaris 2.8. The benchmarking tools used in the experiment is our modified version of WebStone 2.5. WebStone [22] is also open source. The request distribution in the original WebStone benchmark is not adequate for our purpose. The way a client picks a URL is randomized and the URL array size is too small. We modified the source so that the each client sequentially picks a URL from the array to simulate a session and all the clients together replay the request trace of the online retailer that we have characterized earlier.
The working mechanism of the experiment is as follows. A master process instructs a configurable number of clients to send HTTP requests to a web server for a specified time period. Dur-ing the test, the clients choose a URL from an array and keep track of the connection time, response time, and other parame-ters. After the test finishes, the clients send the statistics to the web master and the latter reports the test results after collect-ing all the clients’ data. The final results contain information such as server connection rate (the number of connections the server accepts; the higher the better), average response time (the average timespan the client receives the whole response; the smaller the better), average throughput (the server’ throughput during the test time; the higher the better). There are other HTTP
benchmarking tools available like httperf[16], SpecWeb99[20], SURGE[6], etc. But WebStone’s ability to control the number of clients and URL array and its excellent result reporting tools was appropriate and the modified version was adequate for our experiment.
We created over 4,000 files in the web server and divided them into 4 queues as stated in the previous section. The average processing time of URL’s in each queue under normal server load is 0.5s, 20s, 10s and 5s respectively. In the test, the WebStone clients were instructed to replay the trace of the online retailer’s server collected during the period 20:00 - 21:00.
B. Experimental Results
From the test, we found that some of the performance param-eters such as server connection rate, number of completed re-quests and server throughput (in terms of the number of rere-quests served) were more or less the same, while the average response time varied significantly. For better comparison, we have chosen the response time as the primary performance measure for our analysis. We also analyzed parameters such as request timeout rate due to DWFS, the queueing time, and the processing time of each request from the server log at the web server side. We ob-served that the web server was overloaded when the number of clients reached 40 and essentially became saturated after being requested by 60 clients, so the following results and discussions are focused on the results with the number of clients as 40, 50, and 60.
The experiments were conducted under different DWFS ses-sion timeout settings and the results were compared to the orig-inal Apache server with the same configurations. In the DWFS tests, the clients were evenly divided into 3 priority classes. Each priority class has a scheduling timeout, the shorter timeout a re-quest is assigned, the higher is its priority and thus it gets better service. In WebStone, the webmaster process always tries to evenly divide the number of total processes on the client work-stations, making the number of processes in each of the priority class approximately equal.
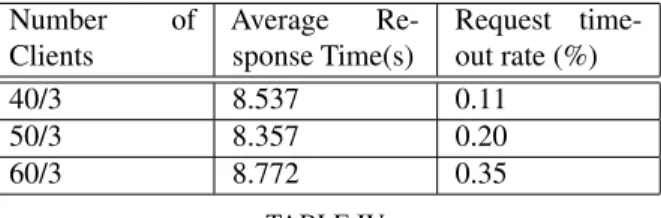
Tables III, IV, and V show the DWFS results with different timeout values, and Table VI shows the results from the unmodi-fied Apache server with the same configuration Figure 8 depicts the response time comparison of the four configurations. In Ta-bles III, IV and V, the values inNumber of Clientsis represented as an fraction because the number of processes in each priority class varies in each test iteration but is approximately one-third of the total number of clients. Since the original Apache server does not drop requests because of timeout, only the average response time is listed in Table VI.
Number of Clients Average Re-sponse Time(s) Request time-out rate(%) 40/3 6.902 0.16 50/3 7.152 0.28 60/3 6.968 0.44 TABLE III
DWFS with session timeout 10 seconds
Number of Clients Average Re-sponse Time(s) Request time-out rate (%) 40/3 8.537 0.11 50/3 8.357 0.20 60/3 8.772 0.35 TABLE IV
DWFS with session timeout 15 seconds
Number of Clients Average Re-sponse Time(s) Request time-out rate(%) 40/3 9.512 0.01 50/3 9.864 0.16 60/3 10.584 0.24 TABLE V
DWFS with session timeout 20 seconds
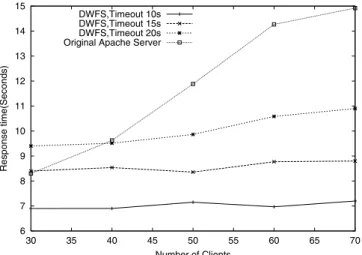
It is observed from the tables that, DWFS can significantly improve server performance by reducing the response time up to 52%. The smaller the session timeout, the shorter is the response time and thus better is the service. DWFS incurs addi-tional request timeout. The timeout rate rises significantly with regards to the number of clients and the timeout value. But such occurrence is less than 0.5%, the impact of which is insignifi-cant on the service availability provided by an overloaded server. This observation also distinguishes DWFS from the shortest-job-first scheduling in the sense that the shortest-job-shortest-job-first scheduling starves long jobs which may lead to more request timeouts. Fi-nally, the relatively steep slope of the original Apache server curve compared to DWFS curves reveals that the server perfor-mance using DWFS is more scalable when the number of the clients increases.
To investigate the underlying factors of the response time dif-ference, we further analyzed the anatomy of the response time. We divided the response time into queueing time and processing time. Queueing time is the period a request is being queued and processing time is the interval between when the request was read and the time when the HTTP response sent. In Apache ar-chitecture, the queueing time starts when a job is accepted and ends at the point when the request starts getting processed by a worker thread; its processing time starts at that point. For a DWFS enabled Apache server, however, since every request line is read immediately after it has been accepted, the queueing time spans from the time the request is read to the moment when a worker thread begins to process it. Figure 9 presents the anatomy of the response time under different configurations. The x-axis
Number of Clients Average Response Time(s)
40 9.623
50 11.885
60 14.267
TABLE VI
6 7 8 9 10 11 12 13 14 15 30 35 40 45 50 55 60 65 70 Response time(Seconds) Number of Clients DWFS,Timeout 10s DWFS,Timeout 15s DWFS,Timeout 20s Original Apache Server
Fig. 8. Response time comparison.
label specifies server type/timeout value/number of clients. The timeout value is zero for the original Apache server because it has no scheduling restraints.
From Figure 9, it is observed that the queueing time of the original Apache server is dependent on the number of the clients. The more the number of clients, the longer is the queueing time. We believe this effect is a direct result of its best effort scheduling discipline, where requests are queued on a first-come-first-serve manner and short requests have to wait for the completion of long requests even if these long requests’ turnaround time may exceed the delay bound and be aborted by the impatient clients. For the DWFS’s case, the queueing time also varies for different timeout settings but is much shorter than those of the original Apache server. Under the same timeout setting (thus the same priority class), the queueing time remains stable, which in turn means that the session level serviceability is maintained. This is due to the preemptive scheduling and the early dropping of those requests whose pre-assigned service time cannot be guaranteed for the descendant requests within the same sessions.
0.0 Apache,0,40Apache,0,50Apache,0.60 DWFS,10,40/3DWFS,10,50/3DWFS,10,60/3DWFS,15,40/3DWFS,15,50/3DWFS,15,60/3DWFS,20,40/3DWFS,20,50/3DWFS,20,60/3 0.0 2.0 4.0 6.0 8.0 10.0 12.0 14.0 16.0 Time (second) Queueing time Processing time
Fig. 9. Anatomy of the average response time.
Finally, we compared the session abortion rate under different configurations. We assume that a session is aborted if one of the requests within it does not receive service before its delay bound.
In the real world, when this occurs, the end users get impatient and abort the session. In DWFS, a session gets aborted when the request has not been processed before its timeout value. While there is no timeout restraint in Apache, we assume that every session has a timeout value of 15 seconds. Figure 10 depicts the comparison. It is observed that for DWFS, the aborted session rate is relatively small and the priority class with longer timeout value usually has lower abortion rate. For Apache server, the aborted session rate is sensitive to the number of clients which means more and more sessions get aborted as the server load increases. 0 2 4 6 8 10 12 14 16 40 45 50 55 60
Session Abortion Rate(%)
Number of Clients DWFS,Timeout 10s
DWFS,Timeout 15s DWFS,Timeout 20s Original Apache Server
Fig. 10. Session abortion rate comparison.
VI. Related Work
A limited number of work has been reported on sessions char-acterization in web servers. In [4], the authors provide parame-ters based on the World Cup 98 server log, which include session length, inter-session time, and their implication on server per-formance. Our characterization work provide complementary results on workload composition, session stage transition, and the ratio of request arrival rate to session generation rate. These empirical results can be exploited to recognize user browsing behavior and capacity planning.
In the context of capacity planning, [13] provides a model based on bandwidth demands for memory, processors data bus, NIC and I/O buses. It is practical for server configuration. Our capacity planning model is targeted towards session level SLA specification and overload prevention.
Although a plethora of work on web servers have addressed performance issues in web servers, the studies on overload trol has been limited. An approach for overload control by con-tent adaptation has been proposed in [1]. Under high load the servers resorts to low fidelity images that consume less system resources, thus reducing the load. Content adaptation is ap-plicable mainly to static web content. Overload control using operating system support has been studied in [15], [21], [5]. The server behavior under overload has been analyzed in [15] and three solutions are proposed to help relieve an overloaded server. These solutions include direct control over kernel timeouts and resource limits, resource introspection, and disaster manage-ment. Three kernel-based mechanims that prevent server from
being overloaded by admission control and service differentia-tion are presented in [21]. Their mechanisms include TCP SYN policing that control the TCP connection rate, prioritized listen queue and HTTP header-based connection control that provides service differentiation. A new kernel facility called resource container which can effectively audit overall resource usage by each process is presented in [5]. This scheme is useful for service differentation as well as overload control. In [19], the authors have studied web server overload control through three different schemes. The first approach is based on the network interface level request dropping. The second approach refers to a feedback machanism from the application level to throttle the traffic vol-ume. The third approach is a hybrid of the other two schemes. These schemes significantly improve server throughput under high load. All these solutions have not considered the session integrity and hence have limited applications for session-based web traffic.
Most of the prior work on overload control are evaluated on a per request basis, which may not be adequate for many ap-plication enhancement that may require session-based overload control. A session-based admission control scheme has been reported in [9], which prevents overload by efficient admission control. They monitor the server load periodically and estimate the load in near future. If the predicted load is higher than a pre-defined threshold, no new requests are admitted. This situation may lead to denial of services. The proposed DWFS scheme is targeted for efficient scheduling of requests and complements the work reported in [9] in maintaining long term server avail-ability.
VII. Conclusion
Overload control ensures service availability in varying work-load and is an indispensable part of network server engineering. This paper presents QoS capacity planning and scheduling algo-rithm for overload control based on characterization of a com-mercial web server log. The main idea of the proposed scheme is to use session-based overload control. Performance measures of web services in terms of sessions is more meaningful than the measures based on individual requests. We have targeted QoS-aware web servers that provide guaranteed QoS based on the requirement of sessions. The traffic conformation function provides quantitative solution for SLA specification and can be used in commercial servers. We have proposed and evaluated a new scheduling algorithm called DWFS, which discriminates the scheduling of requests on the basis of the probability of com-pletion of the session that the requests belong to. The proposed scheduling algorithm improves server productivity under heavy load by more than 50% in the configuration studied in this paper. This work can be used as a framework for further development and deployment of session-based overload control techniques.
Acknowledgments
This work was supported in part by the National Science Foun-dation through the grants CCR-0296070 and ANI-0296034.
References
[1] T. Abdelzaher, N. Bhatti, “Web Content Adaptation to Improve Server Overload Behavior”, In Proceedings of the 8th WWW Conference, Toronto, Canada, May 1999.
[2] Akamai Corporation,http://www.akamai.com. [3] Apache Group,http://www.apache.org.
[4] M. Arlitt, “Characterizing Web User Sessions”, In Proceedings of the Per-formance and Architecture of Web Servers Workshop, Santa Clara, CA, June 2000.
[5] G. Banga, P. Druschel, J. Mogul, “Resource containers: a new facility for resource management in server systems,”, In Proceedings of OSID, Feburary 1999.
[6] P. Barford, M. Crovella, “Generating representative web workloads for network and server performance evaluation”, In Proceedings of the ACM Sigmetrics Conference on Measurement and Modeling of Computer Sys-tems, Madison, WI, June, 1998.
[7] J. Borges, M. Levene, “Data mining of user navigation patterns”, Pro-ceedings of the Workshop on Web Usage Analysis and User Profiling, Aug 1999, San Diego, CA USA.
[8] X. Chen, P. Mohapatra, H. Chen, “An Admission Control Scheme for Predictable Server Response Time for Web Accesses”, In Proceedings of the 10th WWW Conference, Hong Kong, May 2001.
[9] L. Cherkasova, P. Phaal, “Session-based Admission Control-a Mechanism for Improving Performance of Commercial Web Servers”, In Proceedings of IEEE/IFIP IWQoS 99.
[10] M. E. Crovell, A. Bestavros, “Self-Similarity in World Wide Web Traf-fic:Evidence and Possible Causes”, IEEE/ACM Transactions on Network-ing, December 1997.
[11] Internet Engineering Task Force,http://www.ietf.org.
[12] R. Fielding, J. Gettys, J. Mogul, H. Frystyk, L. Masinter, P. Leach, T. Berners-Lee, “RFC 2616:Hypertext Transfer Protocol–HTTP/1.1,” http://www.ics.uci.edu/pub/ietf/http/rfc-2616.txt. [13] K. Kant, Y. Won, “Server Capacity Planning for Web Traffic Workload”,
In IEEE Transactions on Knowledge and Data Engineering, Vol. 11, No.5, September 1999.
[14] D. M. Kristol, L. Montulli, “Internet Draft: HTTP State Management Mechanism”,
http://www.ics.uci.edu/pub/ietf/http/draft-ietf-http-state-man-mec-12.txt.
[15] J. C. Mogul, “Operating System Support for Busy Internet Services”, In Proceedings of the 5th Workshop on Hot Topics in Operating Systems, Orcas Island, WA USA, May 1995.
[16] D. Mosberger, T. Jin, “httperf - A Tool for Measuring Web Server Perfor-mance”, In Workshop on Internet Server Performance, Madison, WI USA, June, 1998.
[17] J. Pitkow, P. Pirolli, “Mining Longest repeating subsequences to predict world wide web surfing”, USENIX Symposium on Internet Technologies and Systems, Boulder, CO,1999.
[18] Logging Properties Reference,www.windows.com/windows2000. [19] V. Tewari, R. Iyer, K. Kant, “Overload Control Mechanisms for Web Servers”, In Performance and QoS of Next Generation Network, Nagoya, Japan, November 2000.
[20] The Standard Performance Evaluation Corporation, http://www.spec.org.
[21] T. Voigt, R. Tewari, D. Freimuth, A. Mehra, “Kernel Mechanisms for Service Differentiation in Overloaded Web Servers”, In Proceedings of the 2001 USENIX Annual Technical Conference, Boston, MA USA, June 2001.
[22] WebStone,http://www.mindcraft.com/webstone.
[23] H. Zhu, H. Tang, T. Yang, “Demand-Driven Service Differentiation in Cluster-Based Network Servers,” In Proceedings of the IEEE INFOCOM 2001, Anchorage, April 2001.