A Modeling Tool for Multidimensional Data using the ADAPT Notation
Peter Gluchowski, Christian Kurze, Christian Schieder Chemnitz University of Technology
{peter.gluchowski | christian.kurze | christian.schieder}@wirtschaft.tu-chemnitz.de
Abstract
Conceptual models are designed to express user requirements of information systems in a formal and self-explanatory manner from a business users point of view. Furthermore, they should contain enough information for IT staff to use them as a basis for technical deployment.
Within the domain of OLAP information systems, multidimensional data models are used to translate the specific user requirements into multidimensional data structures. Application Design for Analytical Processing Technologies (ADAPT) is one of the appropriate notations to express these models on a conceptual level. Up to the publication of this paper, ADAPT lacks any formal foundation. We will contribute to solving this issue by proposing a metamodel for ADAPT and a software prototype that transforms conceptual data models into logical ones in order to ease the development of data warehouse systems.
1. Introduction
Numerous steps must be taken during the development of data warehouse systems to accomplish a highly productive realization of user requirements. Although the development process is often not oriented to sequential procedure models, but passes various rebounds and iterations, the process stages
requirements engineering and technical design prove to be of great importance. Regrettably, the transfer between the two phases turns out to be difficult, as the qualitative description of business requirements cannot immediately be converted into a formal technical specification.
Especially in the context of data modeling it is advisable to apply special techniques supporting the
modeling of relevant structures on a conceptual level
independently of the database technology eventually
used to overcome this issue. These conceptual data
models summarize the results of the information demand analysis and serve as a foundation for further developments [8, 9]. Usually, conceptual modeling
relies on a graphical notation that allows writing, understanding and managing schemata by both designers and users [1].
The conceptual notation analyzed in this paper,
called Application Design for Analytical Processing
Technologies (ADAPT) [2], was first published in 1996 and offers a set of symbols which facilitate the visualization of multidimensional data structures in a mostly self-explanatory way. To the best of our knowledge, ADAPT lacks any formal foundation to date. The present article closes this gap by introducing a metamodel which contains precise specifications for admissible combinations and connections of model elements.
While conceptual models are to capture user requirements, logical models are to capture implementation aspects. They hide some details of physical data storage but could be implemented on a computer system directly. Modeling multidimensional data structures on a conceptual level reveals the navigation structures along the dimensions in a self-explanatory way, but the logical representation, for example by relational tables, does not; hierarchy levels and attributes are simple columns without further metadata.
The next step in implementing data models is their transformation into physical models. Their concepts describe the details of how data is stored in a specific system. Physical data models are meant for computer specialists and therefore not further covered within this paper.
Formally correct ADAPT models can be applied as a base for the automatic compilation of logical data models. However, the transformation into a logical model does not prove to be trivial as different database technologies and several realization options compete against each other [10]. This paper provides a solution which leads to the automatic transformation of ADAPT diagrams into logical data schemata for diverse target platforms.
The remainder of this paper is structured as follows: section two introduces basic multidimensional concepts; section three briefly overviews related work. An introduction to both ADAPT and the metamodel is
provided in section four. Part five focuses on the essential conversion steps from conceptual towards logical data models. The last section discusses the prototype and gives an outlook on future research work.
2. Multidimensional Data Modeling
The ontological discrimination between schema
and instance layer is a fundamental aspect in modeling multidimensional data structures. This section elaborates on the conceptual elements used to describe
multidimensional data schemata [3, 20]: dimensions,
hierarchies, measures, and attributes. They are used to turn business data into actionable information. Indeed,
a simple spreadsheets structure is a kind of
multidimensional data structure; a two-dimensional one.
Dimensions represent the essential components of a multidimensional schema. They are a partially ordered
set of dimension elements (also named as dimension
members or dimension positions), which represent the
dimensions individual values; the dimensions
instance. For example, an analysis of a companys
turnover might be parameterized by the dimensions
product, organizational unit and time. Each single product sold by our company is an element of the product dimension.
Dimension elements might be grouped by means of
hierarchically ordered levels, so-called dimension
hierarchies. Within the schema description dimension elements are condensed into generalized abstract
dimension levels (or hierarchy levels). To refer to the
product dimensions example, this leads to an
aggregation of single products into product subcategories and/or product categories. The examined
levels elements are connected by
parent-child-relationships. Usually this results in tree structures with a root node (top level element), several leaf nodes (leaf level elements) and multiple nodes in between on the particular levels. Deviations from this ideal structure will occur in practical use such as parallel hierarchies or unbalanced tree structures.
The semantics of measures are determined by the
semantics of their descriptive dimensions. By spanning a spatial structure of orthogonal dimensions and defining cells at the dimension element intersections, a multidimensional matrix is created. This is often
referred to as a data cube or hypercube. The contents
of these cells, the so-called facts, are precise numerical
values of the modeled business measures. Within research community there is neither a distinct nor a generally accepted definition of the terms measure, measurement and fact. According to our
understanding, measures describe the schema of facts.
Within the given example, the measure turnover is
determined by the dimensions product,
organizational unit and time. Its data type should be
currency. Picking out individual dimension members
such as product x, organizational unit y and time
period z allows indexing a single turnover value, the
fact t.
Two different alternatives exist to model measures. On the one hand it is possible to create one data cube for each measure. On the other hand, one cube can contain several measures by introducing a measure dimension; with each member representing one measure.
For the remaining part of the paper it is essential that measures are not isolated from each other. Often, they are linked via calculation rules. These rules are used for the dynamic calculation of dependent facts from the externally given independent facts. Complex dependencies within systems of financial control can be created in this way.
Attributes are an integral part: business attributes in particular give a deeper insight into multidimensional data structures. There are two distinct options. Attaching attributes to a dimension implies that every single element within this dimension inherits these attributes, for example each product and each product group. Applying an attribute to a certain hierarchy level opens up the possibility of attributes that are valid for this individual level only; each product might have a weight whereas a product category will not have a weight.
3. Related Work
This section categorizes some of the related work. Due to numerous studies in this area this can be a short overview only and makes no claim to be complete.
3.1. Modeling Frameworks
Several methodologies are intended to represent multidimensional data models on a conceptual level. They can be categorized into three different types [1]: extensions to the Entity-Relationship model, extensions to the UML, and ad hoc models. Each one is appropriate to represent basic multidimensional concepts but they differ significantly in their ability to represent more sophisticated concepts such as irregular hierarchies.
Entity-Relationship based models extend the basic ER notation by means of multidimensional concepts. The ME/R model [4] extends the ER model by adding three elements: a fact relationship set, a dimension
level set and a rolls-up relationship set. Using this approach, only static data structures can be described; dynamic and functional aspects are not covered. [5] uses dimensions, fact relationships, cardinalities in Martin notation, hierarchies and analysis criteria as
well as a xor operator to express hierarchy anomalies.
Adaptations of UML are exemplified in [6] and [7] as well as the customizations of the model driven architecture (MDA) such as [8]. The approach in [6] uses stereotypes to typify classes as cubes, dimension levels, measures and so on; they are displayed with the same icons as in the ADAPT notation. [7] proposes a UML profile for multidimensional data modeling. The MDA approach presented in [8] tries to offer a framework for all the relevant data warehouse components, for example ETL processes, data sources and repositories. The authors extend the UML as well as the Common Warehouse Metamodel (CWM) and use the Query/View/Transform (QVT) language for establishing transformations between different models.
Ad hoc approaches raise the level of abstraction by directly using domain concepts. Therefore, ad hoc approaches can be seen as Domain Specific Languages (DSLs) [18]. They are especially useful if the modelers themselves are not software developers; language visualization and ease of use are emphasized. Modelers do not have to cope with stereotyped classes or variations of entity types; they can intuitively use multidimensional modeling concepts like cubes and dimensions.
Therefore ad hoc approaches differ from ER or UML approaches by not adapting a certain notation to new fields of application, but developing a new visual language in order to support modelers on a higher level of abstraction.
ADAPT ranks among these ad hoc approaches. There are several other methodologies with a formal foundation such as the Dimensional Fact model [9]. The model consists of some fact schemes whose basic elements are facts, measures, attributes, dimensions and hierarchies. They are accompanied by several other features such as attributes or the additivity of attributes along dimensions.
We have chosen ADAPT for the purpose of this paper because it allows the creation of semantically rich models due to several different model elements. Furthermore, ADAPT is relatively easy to learn and mostly self-explanatory. In contrast to other ad hoc modeling techniques a stencil for Microsoft Visio has been made available free of charge, thus facilitating the application of the modeling language in practice.
3.2. Model Transformation
Some of the above-named papers already include possibilities to transform conceptual models into logical representations. Several approaches concentrate explicitly on transforming conceptual models into logical ones like [5]; and sometimes the other way round, which is actually more relevant, as seen in [10]. These approaches are often discussed under the term
schema evolution. It has gained much interest in both research and practice. Therefore, an online bibliography concentrating on this area is available [17]. Currently 418 papers on schema evolution are listed.
In most cases, the methodologies concentrate on a star schema or one of its variants. The prototype presented in section 5 tries to offer an open architecture which can be extended in order to support more than one target schema.
A new level of abstraction has been introduced by the concepts of model management, as commented in section 6. Currently, the cited online bibliography [17] contains 61 papers on this approach.
4. ADAPT foundations
The ADAPT notation emerged during the 1990s in the course of an attempt to create a graphical, business oriented representation of OLAP data models [2]. Due to its pragmatic roots, the notation lacks any formal foundation. Further, by the time of the publication of this paper, the modeling language had largely been ignored in scientific publishing on conceptual modeling. To overcome these deficiencies we will introduce the basic building blocks of the modeling language, demonstrate their usage and subsequently provide a formal foundation by presenting a UML-based metamodel.
4.1. Modeling with ADAPT
The notation provides a variety of symbols which are depicted in figure 1. Each one of them represents a conceptual object of an OLAP application.
A common issue of modeling in analytical contexts is the necessity to not just model the schema of a multidimensional problem (such as hierarchy levels), but to model specific instances within this schema where appropriate (such as individual dimension members). Dynamic aspects, especially calculation models of derived measures, are of great importance. ADAPT closes both gaps by offering special symbols, as described within the following paragraphs.
The basic elements of this notation are Hypercube
(or Cube for short) and Dimension. A Hypercube is the basic unit of storage for business data in a multidimensional database, physically, an n-dimensional array. A dimension is the representation of an axis of such a cube. Detailed modeling of
dimensions is done via the symbols Hierarchy, Level,
Member, Attribute, Scope, and Model.
Dimension Dimension1 Dimension2 Cube Hierarchy Level { } Attribute { } Scope { } Member Model
Figure 1. Basic symbols
We show the elements utilization and interaction
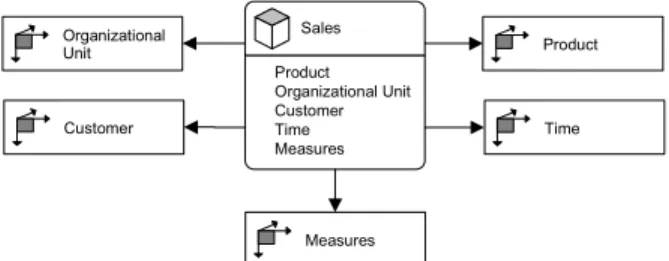
by applying the notation to model the business case of a company which wants to analyze its product sales (e.g. units and turnover) by different organizational units (e.g. stores) to customers (e.g. in different geographic locations) over time (e.g. months). This simple example can be sufficiently modeled by using one cube (Sales) with five dimensions (Organizational Unit, Customer, Product, Time, Measures). In a first step we refrain from displaying the dimensions in detail. The resulting diagram is shown in figure 2.
Product Organizational Unit Customer Time Measures Sales Organizational Unit Customer Time Measures Product
Figure 2. Sample cube with five dimensions
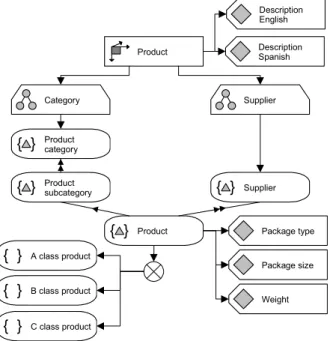
By taking a detailed look at the product dimension we can demonstrate the other design elements. Our example company sells products from different suppliers in several product subcategories which aggregate into product categories. For the abstract
representation of these objects the Level element is
used. The sales department wants to analyze the data by supplier as well as product categorization. Therefore, we need to model two parallel hierarchies (Category and Supplier) with different depths or number of levels.
The Member element is particularly useful when modeling dimensions with few elements such as
budget, actual and variance in a scenario dimension or a small number of key performance indicators in a
measure dimension. Dependencies between measures
or scenarios can be indicated by using the Model
element. Models help to represent calculation rules within systems of financial control, for example the DuPont-System. To leverage diagram clearness it can be useful to depict one cube per measure and use the model element to show calculations between cubes.
Self Precedence Used By Strict Precedence Loose Precedence Connector
Figure 3. Connector symbols
Among the conceptual representation of hierarchy levels various types of relations may exist. The
connection operators Loose Precedence (one arrow)
and Strict Precedence (two arrows) connecting the
hierarchy levels allow the modeling of unbalanced tree
and forest structures. The usage of Loose Precedence
between product and product subcategory suggests that not all products can be assigned to a specific product line. In other words, there is not necessarily a parent
object for each instance on the upper next level. Strict
Precedence on the other hand indicates the mandatory aggregation of product subcategory to product category; for each instance there is always a corresponding parent element. Figure 3 displays the provided connector symbols representing the different
relationships. Self Precedence qualifies recursive
relationships within a hierarchy. Used By is a
specialized connector for characterizing input parameters for and dependencies between models. The
simple Connector denotes all other relationships
between any two elements.
Scopes or subsets summarize related dimension elements. They are suitable for modeling categories within dimensions. The elements of a scope are either explicitly defined or can be derived from other database objects by calculations. Our example uses the results from an ABC analysis to classify products into three different classes (A, B and C class products).
Fully Exclusive Fully Overlapping Partially Exclusive Partially Overlapping
Figure 4. Subset operators
Four Subset operators visualize relationships
among different scopes. Fully Exclusive indicates
disjoint subsets which contain the complete original set
of dimension members. Fully Overlapping separates
the total dimension into non-disjoint parts. Partially
Exclusive connects disjoint subsets, which do not cover
Cube Dim ension Mem ber Attribute Hierarchy <<connector>> 1..* 1..* <<connector>> 1 1..* <<connector>> 0..* 1 <<connector>> 1 1..* Level Subset Operator Scope <<connector>> 1 1 <<strict precedence>> 1 1 <<loose precedence>> +parent 0..1 0..* <<strict precedence>> +parent0..* 0..1 <<self precedence>> +parent 0..1 0..1 <<connector>> 0..* 1 <<connector>> 1..* 1 <<connector>> 1 0..* Fully Exclusive Partially Exclusive Fully Overlapping Partially Overlapping Model <<used by>> 0..* 2..* <<connector>> 1 1 <<connector>> 0..* 1
Figure 6. ADAPT metamodel
indicates partial division of the population into subsets; dimension members may be found in more than one subset. In our example each product exclusively
appears in one class. Therefore we apply the Fully
Exclusive operator. Product Category Supplier Product category { } Product subcategory { } { } Supplier Product { } { } A class product { } B class product Description English Description Spanish Package type Package size Weight { } C class product
Figure 5. Sample product dimension
By using the Attribute element we can depict
additional information on the characteristics of dimension elements. Attributes can be assigned to all elements of a dimension, elements of a certain level or members of a dimension scope. In our example we use attributes to associate language-dependent descriptions to every single element of the dimension at all hierarchy levels. However, package type, package size and weight only make sense on single products.
Figure 5 shows the entire representation of the product dimension in ADAPT as described in our example case above. Our exposition thereby is limited to the application of the most important elements. For a more detailed explanation see [2].
4.2. ADAPT Metamodel
This section introduces the ADAPT metamodel, which is depicted in figure 6. It has been created following the design science approach [19]. Furthermore, ADAPT can be seen as a Domain Specific Languages and the development of metamodels is a typical approach in implementing DSLs [18]. We make use of the UML notation whereby classes represent modeling objects as well as operators; stereotyped associations represent the different connector types.
Within the first step of the development process, we selected the most important elements of ADAPT which support the basic ideas of multidimensional modeling presented above. These elements form the classes within the metamodel. The second step consisted of establishing relationships between the modeling elements according to [2].
The navigation directions of the metamodels
associations indicate the direction in which the arrow heads of each connection symbol should lead. For
example, the association between Cube and Dimension
is navigable from Cube towards Dimension and
stereotyped with connector. This implies the usage of a
connector (see figure 2) between Cube and Dimension with the arrow pointing towards the dimension. Please notice that the arrows of Strict Precedence and Loose Precedence are heading to the parent level when connecting hierarchy levels with each other.
{XOR}
In order to increase clarity, the classes do not contain any attributes. Every class should have at least a name as well as containers for storing the connected
elements. In case of Cube this would include a
collection of corresponding dimensions. A name can
be omitted only at Subset Operator and its child
classes.
A dimension is linked with one or more members,
hierarchies or attributes via connectors. The
XOR-Constraint expresses that either individual dimension members or hierarchies exist.
There might be a connector or a strict precedence between hierarchies and the uppermost hierarchy level. Using strict precedence claims that there should be an artificial overall hierarchy level. Strict precedence and loose precedence as well as self precedence connect single hierarchy levels. Strict or loose coupling allows more than one parent level; in case of a recursive relationship exactly one parent and one child level exist. Subset operators divide a hierarchy level into different dimension views. A connector establishes the connection between level and subset operator; more than one subset operator can be connected to one hierarchy level. The subset itself consists of one or more scopes.
Attributes are, as already stated, attached to dimensions. Alternatively, they might be linked to hierarchy levels and scopes via connectors.
Calculation models have at least two inbound members and create one calculated value. A member is allowed to take part in more than one calculation model. Calculation rules between different cubes should not be considered here.
The proposed metamodel does not support all aspects of the ADAPT notation. For example, scopes are bound to hierarchy levels via subset operators. The authors of [2] see the possibility to link scopes directly with dimensions in order to categorize individually
modeled members. It is also not intended to limit the
range of attributes possible values.
The use of identifiers should be limited. Ideally, each identifier is distinct within its object type. For instance, each dimension and each hierarchy level require different names. The same does not apply to elements with different semantics, for example both a dimension and a hierarchy can be identically named.
5. Modeling Tool Prototype
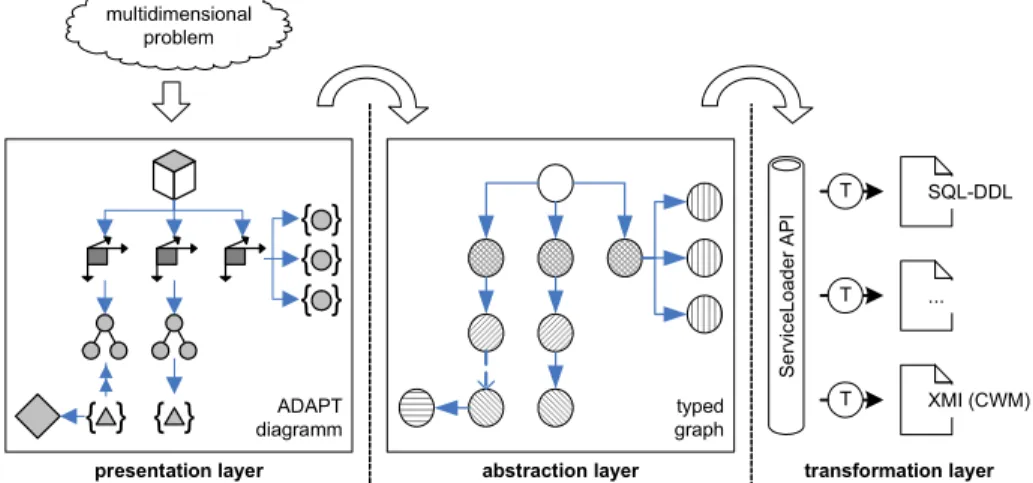
The presented prototype should be easily extendable by means of multiple database systems that can be accessed via the modeling tool. The main problem behind this thought is the existence of various target platforms which differ in the way they store multidimensional data: ROLAP, MOLAP und HOLAP. Therefore, a way of accessing multiple transformation algorithms must be found, and each algorithm has to be parameterized. The right-hand side of figure 7 summarizes this approach. In order to concentrate on this requirement we use the concept of reutilization by not inventing a new modeling language or a new editor but using ADAPT and an existing ADAPT stencil for Microsoft Visio.
5.1. Architecture concept
The prototype is based on a three-layer architecture as shown in figure 7. An editor for ADAPT is situated within the graphical or presentation layer. In our case this will be Microsoft Visio because of an already well-proven stencil. Starting with Visio 2003, it is possible
to save diagrams in an XML format, DatadiagramML
(formerly known as XML for Visio).
The abstraction layer acts as an intermediary between graphical modeling and transformations.
multidimensional problem SQL-DDL ... ADAPT diagramm
{ }
{ }
{ }
{ }
{ }
T T T typed graphpresentation layer abstraction layer transformation layer
Se rvic eLoad er A P I XMI (CWM)
ADAPT diagrams are represented as directed typed graphs in order to reduce the loss of information between diagrams and internal storage. A typed graph
G can be defined as the following tuple: G = (N, E, tN,
tE, s, t) with a finite set of nodes N, a finite set of edges
E, an assignment of a type to each node tN: N ĺN as
well as to each edge tE: E ĺE, and the assignment of
source and target for each edge s, t: E ĺ N [10]. The
instances of N, E, s and t arise from the ADAPT
diagram whereas E and N reflect the modeling
elements of the notation itself.
The third layer provides transformational functionalities. Therefore, one of the most important requirements is the extensibility by means of adding new transformation algorithms without intervening into the source code of the modeling toolset.
In version 6 of the Java Standard Edition (SE), the ServiceLoader API has been made public [16]. It helps to find, load and use so-called service providers. Within the context of this API a Service is a collection of interfaces and classes that provide access to specific program functionality. A service provider reflects the actual implementation. In the case of the prototype each transformation algorithm represents a service provider. They are defined by the service provider interface (SPI), which consists of a set of public interfaces and abstract classes. Only the classes and methods contained within the SPI are visible to the actual application.
To create an SPI it is necessary to find a generic interface which offers capabilities for creating multidimensional modeling constructs. The following operations are suitable for our purpose:
• create database <database>: This operation creates a new database as a container for all other structures and quantitative values.
• create dimension <dimension>: Dimensions are essential for multidimensional data structures. Each dimension has to receive a distinct name.
• create measure <measure>: As a next step, measures have to be instantiated within the database. • create cube <name> <var1>, <var2>, ..., <varm>
<dim1>, <dim2>, ..., <dimn>: The fourth method assembles data cubes from the given dimensions and variables.
A reference to a partial graph is passed to each method.
5.2. Transformation Examples
The prototype is evaluated by a case study, which has been simplified for the purpose of this paper. A second production cube containing four dimensions (Product, Plant, Time and Measures) extends the example given in section 4.1. The dimensions product
and time are shared by both cubes. Further research will include evaluation in real-world business applications. At the moment there are negotiations on how to integrate our software in a large project within the telecommunication industry sector.
5.2.1. Galaxy Schema. Within a galaxy schema, cubes and dimensions correspond to fact and dimension relations, respectively. They are connected via foreign key relationships [3].
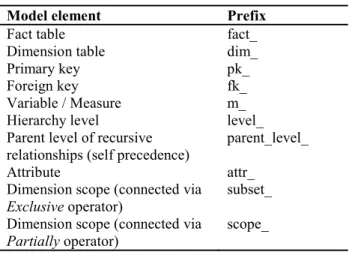
Table 1. Prefixes for identifying relations and their attributes
Model element Prefix
Fact table fact_
Dimension table dim_
Primary key pk_
Foreign key fk_
Variable / Measure m_
Hierarchy level level_
Parent level of recursive relationships (self precedence)
parent_level_
Attribute attr_ Dimension scope (connected via
Exclusive operator) subset_ Dimension scope (connected via
Partially operator) scope_
In order to identify the modeling constructs in the generated schema, prefixes which precede each identifier (such as relations or columns) are introduced. A summary is given in table 1.
A second assumption concerns the data types of each individual modeling element. Table 2 outlines them. Our future task is to use transformation parameters to implement a solution which allows a flexible setting of data types.
Table 2. Data types for modeling elements within a galaxy schema
Model element Data type
Primary key INTEGER
Foreign key (has to be the same
as primary key) INTEGER
Fact DOUBLE
Hierarchy level VARCHAR(255)
Attribute VARCHAR(255)
Dimension Scope VARCHAR(255)
Each dimension corresponds to a relation
dim_<dimension name> with a serially-numbered primary key. Attributes of the dimension itself
name>. If there are dimension members, only one
single column is generated <dimension name>. The
members are added later on via INSERT statements.
CREATE DATABASE ...; USE ...;
# dimension Product
CREATE TABLE dim_product(...); # dimension Time
CREATE TABLE dim_time(...); .
. . # cube Sales
CREATE TABLE fact_sales(...); # cube Production
CREATE TABLE fact_production(...); . . . dim_time pk_time level_year level_month ... fact_sales fk_oranizationalunit fk_customer fk_product fk_time m_units m_turnover dim_organizationalunit pk_organizationalunit ... dim_product pk_product level_product category level_product ... dim_customer pk_cusotmer ... fact_production fk_product fk_plant fk_time m_units dim_plant pk_plant level_plant level_parent_plant ... co n cep tu al ADAP T lo g ical g al axy sch ema co d e S Q L DDL Product Ogranizational Unit Customer Time Measures Sales Sales Product Category Product category { } Product { } Organizational Unit Customer Time Measures Sales Product Plant Time Measures Production Production Time { } Year Month { } Plant Measures Production { }Units { }Units { }Turnover T
Figure 8. Transformation steps from conceptual ADAPT towards SQL DDL
According to the metamodel, hierarchies are permitted only if there are no dimension members. Hierarchy levels are represented in a column
level_<level name>; the same holds for attributes of
levels: attr_<attribute name>. Levels in parallel
hierarchies are represented by one column for each
level. Subsets connected via Fully Exclusive or
Partially Exclusive result in one column per subset
operator. The columns name corresponds to the names
of each scope: subset_<name scope 1_name scope 2_
... _name scope n>. An alternative would be the
creation of a column with a SET data type containing
one entry for each scope. Overlapping operators (Fully
Overlapping and Partially Overlapping) result in one column for each scope. This allows an element to be contained in different scopes. Recursive connections between hierarchy levels are represented by a column
parent_level_<level name>.
Fact tables fact_<cube name> are connected via
foreign key relationships to dimension tables (fk_<dimension name>). For each measure a column
fact_<fact name> is created. An alternative would be the creation of a measure dimension; each measure would map onto one dimension element.
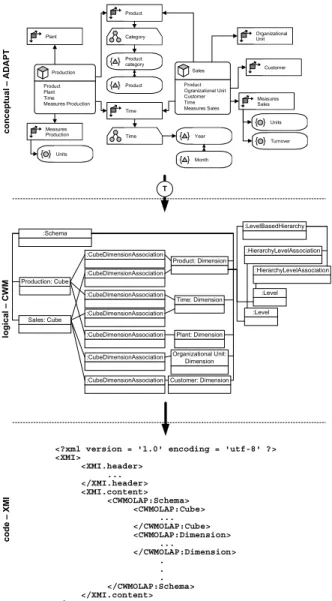
5.2.2. Common Warehouse Metamodel (CWM).
Another worthwhile approach is mapping structural information onto the CWM. The OLAP package within the analysis layer appears appropriate for this task. The assumptions in table 3 apply to data types.
The Netbeans Metadata Repository (MDR) is an implementation of a Meta Object Facility (MOF) compliant repository. It is appropriate for generating interfaces according to the Java Metadata Interface (JMI) specification. These interfaces are used to access an extent within the repository which contains the metamodel and its instance.
Table 3. Data types for modeling elements within the OLAP package of CWM
Model element Data type
Attribute String
Identifying Attribute Integer
Fact Float A schema has to be instantiated as a container for storing the model elements of the whole ADAPT diagram. Each cube and each dimension map onto the corresponding classes of the CWM. A
CubeDimensionAssociation connects cubes and dimensions. The mapping of a dimension organizes as follows: for each dimension level an object has to be generated and has to be published to the according dimension. Hierarchies are represented as instances of
the class LevelBasedHierarchy. Additional semantics
can be given to hierarchies by using the class
ValueBasedHierarchy. It is useful for hierarchies that have some kind of topological order within the individual levels. Because of complexity reasons, the current implementation only supports instances of
LevelBasedHierarchy.
Despite the relatively low depth of CWM, some arguments can be found to build a conceptual metadata
schema on the basis of CWM. Some parts of the metadata can be stored according to the standard which leads to an easier exchange of metadata via XMI. Standard conformant extensions of the reference model offer the possibility to adapt it to enterprise specific needs. These extensions can be easily published and used by other CWM users. The usage of XMI offers the advantage of checking files against a document type definition or an XML schema in order to discover transmission errors.
<?xml version = '1.0' encoding = 'utf-8' ?> <XMI> <XMI.header> ... </XMI.header> <XMI.content> <CWMOLAP:Schema> <CWMOLAP:Cube> ... </CWMOLAP:Cube> <CWMOLAP:Dimension> ... </CWMOLAP:Dimension> . . . </CWMOLAP:Schema> </XMI.content> </XMI> Product Ogranizational Unit Customer Time Measures Sales Sales Product Category Product category { } Product { } Organizational Unit Customer Time Measures Sales Product Plant Time Measures Production Production Time { }Year Month { } Plant Measures Production { }Units { }Units { }Turnover :Schema Sales: Cube Production: Cube Product: Dimension Time: Dimension Plant: Dimension Organizational Unit: Dimension Customer: Dimension :CubeDimensionAssociation :CubeDimensionAssociation :CubeDimensionAssociation :CubeDimensionAssociation :CubeDimensionAssociation :CubeDimensionAssociation :CubeDimensionAssociation :LevelBasedHierarchy :Level :HierarchyLevelAssociation :Level :HierarchyLevelAssociation co n c ep tu al AD AP T lo gic al CW M co d e XM I T
Figure 9. Transformation steps from conceptual ADAPT towards XMI
6. Discussion and Future Work
The prototype shows the possibility of finding a generic interface for algorithmic transformation of conceptual data models based on the ADAPT notation
into different logical representations. A suitable way of parameterization has to be implemented.
For an aggregation of the Java tool and Visio into one implementation the features of Eclipse Graphical Editing Framework (GEF) have to be evaluated. The research prototype GraMMi [12] offers interesting thoughts about a repository-based graphical modeling toolset. Another attractive proposition to develop multidimensional data models collaboratively within a web browser also needs to be investigated.
In this context some consideration has to be given to a quality evaluation of the data models. [11] proposes a two-dimensional approach: the first dimension is the classification concept (syntax, semantics and pragmatics), the second dimension includes measures (absolute and relative measures). Further research work needs be checked and adapted to
ADAPT diagrams.
Within the transformation layer an optimization of the generated schemata has to be implemented. Much improvement can be made within a star or galaxy schema. Some suggestions are given in [5].
The prototype makes use of object-at-a-time operations. This can be understood as the transformation of the original problem into an object-oriented one and manipulating the models and mappings in that representation. To raise the level of abstraction it would be better to use model-at-a-time and mapping-at-a-time operators. They are expected to
improve programmers productivity for metadata
applications [13].
Systems supporting such functionality are
discussed under the term model management systems
(MMS). They support the creation, compilation, reuse, evolution, and execution of mappings between
schemas represented in a wide range of metamodels
[14]. Such an MMS is not a user-oriented tool. In fact it is a reusable component that can be integrated into specific applications relating to data programmability problems.
The most relevant operators for our problem at the current state of research are generation as well as execution of mappings. New transformations could be generated quickly, in the best case even without writing any Java code; a graphical definition would be ideal.
An important topic on our research agenda is a reverse engineering approach of existing data warehouses which is not currently implemented and will require further research. In this context, visualization of data models is not restricted to the ADAPT notation, sometimes different representations are more useful. Fact sheets that can be viewed with Excel showing a description or the calculation of a measure are one example.
7. References
[1] S. Rizzi, A. Abelló, J. Lechtenbörger, and J. Trujillo, Research in Data Warehouse Modeling and Design: Dead or Alive?, Proceedings of the 9th ACM international workshop on Data warehousing and OLAP, ACM Press, Arlington, Virginia, USA, 2006, pp. 3-10.
[2] D. Bulos, S. Forsman, Getting Started with ADAPT, Symmetry white paper, http://symcorp.com/downloads/ ADAPT_white_paper.pdf [05-29-2008], 2006.
[3] R. Kimball, M. Ross, The Data Warehouse Toolkit The Complete Guide to Dimensional Modeling, Wiley, New York, 2002.
[4] C. Sapia, M. Blaschka, G. Höfling, B. Dinter, Extending the E/R Model for the Multidimensional Paradigm, Proceedings of the Workshops on Data Warehousing and Data Mining: Advances in Database Technologies, Springer, London, 1998.
[5] E. Malinowski, E. Zimámyi, Hierarchies in a Multidimensional Model: From Conceptual Modeling to Logical Representation, Data & Knowledge Engineering, Elsevier Science Publishers B. V., Amsterdam, 2006, pp. 348-377.
[6] T. Priebe, G. Pernul, Metadaten-gestützter Data-Warehouse-Entwurf mit ADAPTed UML, H. U. Buhl, A. Huther, B. Reitwiesner (Eds.), Information Age Economy, 5. Internationale Tagung Wirtschaftsinformatik 2001, Physica, Heidelberg, 2001 (in German).
[7] S. Luján-Mora, J. Trujillo, I. Song, A UML profile for multidimensional modeling in data warehouses, Data Knowledge & Engineering, Elsevier Science Publishers B. V., Amsterdam, 2006, pp. 725-769.
[8] J.-N. Mazón, J. Trujillo, An MDA approach for the development of data warehouses, Decision Support Systems, Elsevier Science Publishers B. V., Amsterdam, 2008, pp. 41-58.
[9] M. Golfarelli, D. Maio, S. Rizzi, The Dimensional Fact Model: A Conceptual Model for Data Warehouses, International Journal of Cooperative Information Systems, World Scientific Publishing, 1998, pp. 215-247.
[10] M. Blaschka, C. Sapia, G. Höfling, On schema evolution in multidimensional databases, Proceedings of the First International Conference on Data Warehousing and Knowledge Discovery, Springer, London, 1999, pp. 153-164. [11] J.-P. van Belle, A Proposed Framework for the Analysis and Evaluation of Business Models, Proceedings of SAICSIT, 2004, pp. 210-215.
[12] C. Sapia, M. Blaschka, G. Höfling, GraMMi: Using a Standard Repository Management System to Build a Generic Graphical Modeling Tool, Proceedings of the 33rd Hawaii International Conference on System Sciences, IEEE, 2000, p. 8058.
[13] P. A. Bernstein, Applying Model Management to classical Meta Data Problems, Proceedings of the 2003 CIDR Conference, 2003, pp. 209-220.
[14] P. A. Bernstein, S. Melnik, Model Management 2.0: Manipulating Richer Mappings, Proceedings of the 2007 ACM SIGMOD international conference on Management of data, ACM, 2007, pp. 1-12.
[15] D. Kensche, C. Quix, M. A. Chatti, M. Jarke, GeRoMe: A Generic Role Based Metamodel for Model Management, Journal on Data Semantics, LNCS 4380, Springer, 2007, pp. 82-117.
[16] J. OConner, Creating Extensible Applications With the Java Platform, http://java.sun.com/developer/ technicalArticles/javase/extensible/ [05-12-2008].
[17] P. Bernstein, E. Rahm, An Online Bibliography on Schema Evolution, ACM SIGMOD Record, New York, 2006, pp. 30-31.
[18] J. Luoma, S. Kelly, J.-H. Tolvanen, Defining Domain-Specific Modeling Languages: Collected Experiences, Proceedings of the 4th OOPSLA Workshop on Domain-Specific Modeling, Computer Science and Information System Reports, Technical Reports, TR-33, University of Jyväskylä, Finland 2004.
[19] A. R. Hevner, S. T. March, J. Park, S. Ram, Design Science in Information Systems Research, MIS Quarterly, Vol. 28 No. 1, 2004, pp. 75-105.
[20] N. Raden, Modeling a Data Warehouse, http://www.hiredbrains.com/artic3.html [08-21-2008], 1995.