High Performance Facility Synchronization in Office Design
Mousa T. Gargari
1,∗, Daniel Durbin
1, Eric Inglert
1, Mark Frey
2,
Bruce Mirrielees
2, Akshat Saxena
11School of Advanced Structures, College of Engineering and Applied Science, University of Cincinnati, Cincinnati, OH 45221, United States
2Hixson Architecture Engineering Interiors, Cincinnati, OH 45202, United States
Abstract: The architecture of office space has intuitively and profoundly evolved in response to organizational phenomena (i.e. vertical to horizontal management structures) and in response to processes (i.e. transaction-based to knowledge-transaction-based interactions). Architects have embraced new design processes such as integrated project delivery, new tools like building information modeling and new trends such as the sustainability move-ment. The architectural design process is still not responsive enough to clients’ enterprise needs. In simpler words, the present architectural design process is not streamlined to increase employees’ productivity, nor is it economical and sustainable enough in order to suit client’s needs. This study proposes High Performance Facility Synchronization (HPFS) as a synergistic system approach to be applied to office design. This paper demonstrates that using HPFS optimizes the return on investment by logically allocating the improvements budget to a suite of design interventions. The conclusions are drawn by applying HPFS to the adaptive reuse of an existing midrise multi-tenant office facility for single tenant occupancy.
Keywords: Office design, high performance office, efficiency, productivity
DOI: 10.7492/IJAEC.2012.024
1
INTRODUCTION
Researchers and design professionals have identified several parameters that, each one in its own way, can influence certain aspects of the office design with vary-ing degrees of effectiveness. Thermal comfort (Lan et al. 2011); lighting (Juslén et al. 2007); indoor air quality (Pawel et al. 2000) and culture (Haynes 2008), have been the main parameters studied and all have been quantified as a single parameter.
Others have proposed to combine two or more pa-rameters in order to achieve a higher degree of effi-ciency. Parametric studies have been conducted on the impact of these on either first-cost, cost of oper-ation, or performance and efficiency of employees. To this date a synchronized and holistic approach to the design of a high-performance facility has not yet been established. Mirrielees (2006) proposed that facilities (offices) should be considered as a system and con-ceptualized this as High Performance Facility Synchro-nization (HPFS). The HPFS concept can achieve both quantitative and qualitative improvements in perfor-mance that overcome the first-cost financial advantage
of conventional office design; HPFS optimizes the re-turn on investment by logically allocating the improve-ments budget to a suite of design interventions
This study involves the application of the HPFS con-cept to the adaptive reuse of an existing midrise multi-tenant office facility for single multi-tenant occupancy in or-der to quantitatively demonstrate the advantages of this new concept to the conventional office design pro-cedure.
2
LITERATURE REVIEW
2.1
Effect of Single Parameter
Thermal Comfort
There have been numerous studies that attempt to de-fine the relationship between thermal comfort and of-fice productivity. Lan et al. (2011) state that thermal comfort was derived from the actual requirements of people and was influenced by their metabolic heat pro-duction, physical activity, clothing and the four en-vironmental factors: air temperature, mean radiant temperature, air velocity and air humidity. Of these *Corresponding author. Email: [email protected]
factors, air temperature alone is the most commonly used parameter in the studies of thermal comfort. In an extensive literature reviewFrontczak and Wargocki (2011) concluded that creating a comfortable thermal environment was often considered to be the most im-portant factor for achieving overall satisfaction with Indoor Environmental Quality (IEQ).
Niemelä et al. (2002) conducted a case study of the effect of air temperature on productivity in two call centers and concluded that productivity decreased 5-7% when the air temperature exceeded 25◦C.Seppanen et al. (2006) developed a quantitative relationship tween work performance and temperature within, be-low and above the comfort zone. They also reported that field studies show a consistent decrease in perfor-mance of typical office work tasks when temperatures increase above 24-26◦C. Lan et al. (2011) presented a quantitative measure of relative performance as a function of thermal sensation and concluded that opti-mal performance was achieved when test subjects felt slightly cool.Fang et al. (2004) examined the impact of both air temperature and humidity on the perceived air quality in an office environment and concluded that the perception of air freshness and acceptability improved greatly as temperature and humidity decreased.
Lighting
The positive productivity effects from lighting control may be considered from the view of daylight, task light and indirect ambient light. Juslén et al. (2007) stud-ied the effect of a controllable task-lighting system that allowed people to select lighting levels and concluded that productivity was influenced positively. Lee and Guerin (2010) evaluated and compared the workspace quality of Leadership in Energy and Environmental De-sign (LEED) - certified buildings and employee’s satis-faction with job performance in five office types. This study revealed that cubicles with partitions over five feet tall inhibited light quality.Boubekri et al. (1991) studied the effect of sunlight patches on the occupant’s emotional response and satisfaction and found that sunlight penetration affected the feeling of relaxation when the observer was sitting sideways to the window, and researchers proposed a relaxation-sunlight algo-rithm (i.e. relaxation = −0.0076S2 + 0.247S + 7.5, where S is the percentage of sunlit area to the total floor area). The cumulative effect of these three light-ing strategies may result in synergistic lightlight-ing “sys-tems” and afford the designer the greatest overall pro-ductivity improvements.
Indoor Air Quality
Indoor air quality (IAQ) is known to affect produc-tivity in office spaces. Several studies have been con-ducted in an attempt to quantify the relationship be-tween the performance of office work and IAQ. Pawel et al. (2000) estimated that productivity increased an
average of 1.5% for every 10% decrease in the percent-age of persons dissatisfied with the air quality. They further estimated that performance of office tasks in-creased by 1.9% for every two fold increase in the ven-tilation rate at constant pollution load or for every two fold decrease in pollution load at a constant ventilation rate.
Wargocki and Djukanovic (2005) have conducted simulations of the potential revenue obtainable from investments in improved indoor air quality in an office building. Their life cycle cost analysis of several types of Heating Ventilation and Air Conditioning (HVAC) systems indicated that the benefits from improved door air quality are up to 60 times higher than the in-vestments required to achieve the improved air quality. They further report that simple payback times of in-vestments were generally less than two years.Frontczak and Wargocki (2011) stated that providing people with the possibility to control the indoor environment im-proves thermal and visual comfort and overall satisfac-tion with IEQ as well as satisfacsatisfac-tion with indoor air quality.
Culture
Haynes (2008) developed a validated theoretical frame-work for the evaluation of office productivity, which in-cludes components to represent both the physical and the behavioral environment. The study found that in-teraction was perceived to be the component that had the most positive effect on productivity while distrac-tion was perceived to have the most negative effect.
Haynes (2009) provided justification and rationaliza-tion to the appropriateness of a research strategy for measuring the impact of office environment on per-ceived productivity. It was stated that comfort, office layout, interaction and distraction were factors affect-ing productivity.
Oldham (1988) reported that the primary environ-mental behavior theory used to explain the reduced office-worker concentration involved the concept of overstimulation that could result in behavioral with-drawal and dissatisfaction in occupants who did not have well-developed stimulus screening personality at-tributes (i.e. hierarchical versus immediate attention). The findings suggested that the combination of parti-tions with low-density planning had the most positive effect; optimal combination of social density, number of enclosures and interpersonal distance achieved the most harmonizing balance; and, lower densities pro-vided more significant improvements than partitioning alone.
A similar study done around the same time distin-guished the effects of individual differences, task com-plexity, and privacy on satisfaction with an employee’s work environment (Block and Stokes 1989). The study also analyzed the effects of private versus non-private work settings on performance and correlated them with
individual differences and task complexity. The au-thor found that privacy in an office was directly related to employee performance and satisfaction, and people working on complex tasks get more distracted in non-private settings.
Sundstrom et al. (1994) studied the effects of office noise on environment satisfaction, job satisfaction and job performance. The study found that people talking, telephone rings and increasing noise negatively affected employees.
Evans and Johnson (2000) also discussed the effect of long-term exposure to low intensity office noise on per-formance and productivity, although in a different fash-ion. Evans studied the effects of low intensity noise on epinephrine, which is the most reliable neuroendocrine index of stress. The study found that long-term ex-posure to noise increased stress levels, decreased the motivation levels of a person and decreased their likeli-hood to make postural adjustments in their computer workstation.
2.2
Combined Effect of Two or More
Pa-rameters
Parametric studies have been conducted on the im-pact of design choices (e.g. insulation of the envelope, window area, building orientation, thermal inertia and ventilation) on the energy consumption of office build-ings. From the results of the parametric studies re-searchers tried to indicate what should be done in prac-tice to help architects to design energy efficient build-ings with a good thermal interior climate (Gratia and De Herde 2003).
In the design of integrated building concepts it will be very beneficial to identify the most important design parameters in order to more efficiently develop alter-native design proposals and/or reach optimized design solutions. This can be achieved by applying sensitivity analysis early in the design process (Heiselberg et al. 2009).
Loftness et al. (2007) earlier had suggested that tech-nical and mechatech-nical control of the interior was not sufficient to improve IEQ and may be related to the integrated sum of three primary factors (e.g. sustain-able design, impact of occupants and quality of inte-rior finishes). The building investment decision sup-port tool (BIDS) presented productivity improvements data from case studies in the following ranges: High-performance ventilation strategies increase productiv-ity from between 0.5% to 11%; Individual thermal con-trol may account for up to 3% productivity gains; Im-proved lighting design may increase user productivity in a range from 1% to 23%; while, access to the natural environment may increase productivity from 0.5% to 18%. They concluded that a healthy interior air qual-ity and environment is a function of sustainable design practices, individual occupant control and certification of consumer products and building materials.
Pati et al. (2010) proposed that organizational goals (e.g. health, productivity, learning and satisfaction) are related to environmental design, and concluded that aligning the design and maintenance of building and subsystems with the social and economic organiza-tional objectives improves performance measures. The primary finding was that the deliberate consideration of maintenance performance during the upfront design decision phase of a project assisted in meeting organi-zational objectives.
Pennell (2009) suggested that clients seek added value, intelligent buildings, green design and sustain-able materials in order to satisfy an integrated criteria set that includes comfort, security, productivity, flexi-bility, resilience, emissions and consumption. He con-cluded that facilities will benefit most from automation and networks.
Pugsley and Haynes (2002) described how organi-zations (esp. government offices) leverage intellectual capital through team work and group office designs, and how information and communications technology (ICT) allows flexible work environments. Researchers theorized that the optimal design integrates the phys-ical systems with the human systems of the organiza-tion. Shared facilities however resulted in suboptimal perceptions regarding resource supply as well as subop-timal perceptions regarding environmental conditions (e.g. privacy, screening, internal air quality, thermal and light control). Furthermore, users reported that noise levels were disruptive. These researchers con-cluded that a revised design should provide greater user control of thermal and light systems.
A study conducted in Norway provided the follow-ing definitions with regard to the adaptability of office spaces. Adaptability is defined in terms of: general-ity, flexibility and elasticity. Generality is when the building adapts to changing functional user or owner needs without changing its properties. Flexibility is when the building adapts to changing functional user or owner needs by changing its properties easily. Elas-ticity is when the building adapts to be extended or partitioned related to changing user or owner needs. Owner-occupied buildings are more adaptable, as com-pared to buildings constructed by a group who develop them for renting and management. The least adapt-able ones are those developed by a group who develop property for sale to investors. According to the author, when the property market is customer driven and the property owners and occupiers are informed then there is a demand for more adaptable office buildings (Arge 2005).
The literature survey on the above mentioned param-eters show that to this date a synchronized and holistic approach to the design of high-performance facility has not been established.
Following is the process of application of HPFS con-cept to the adaptive reuse of an existing midrise office building for single tenant occupancy. This study
con-firms that using the HPFS concept can produce signif-icant economic advantage to a client.
3
HPFS METHODOLOGY
HPFS is a synchronized and holistic approach to the design of facilities. The integrated design of archi-tectural systems may achieve qualitative as well as quantitative improvements, contributing future human performance and productivity dividends to a firm’s fi-nances. The objective of this study was to model and measure the HPFS framework and its effective return on architectural investment (ROAI). The methodology described in the HPFS flowchart defines a protocol for evaluating quantitative improvements and future pro-ductivity gains that may offset the first-cost financial advantage of conventional office design.
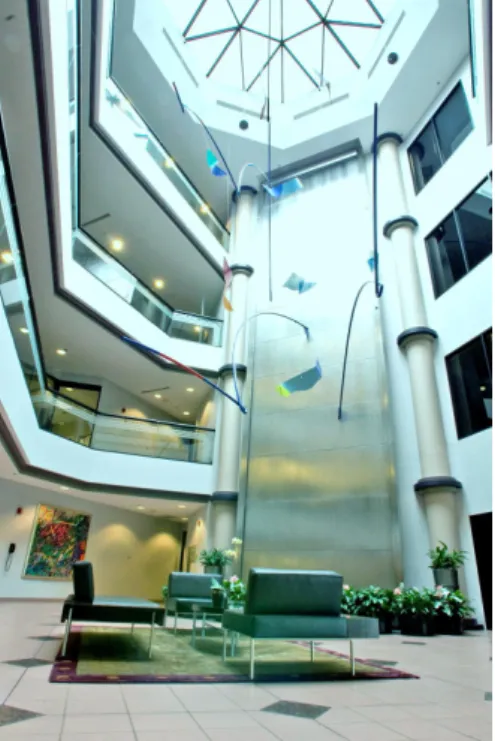
The real estate pro forma is familiar to firms as a tool for valuing capital assets and also long-term leases (Geltner and Miller 2001). Discounted cash flow analysis (DCF) is a technique that estimates cash flows into the future and rolls back all of the cash flows re-sulting in a net present value (NPV). Any asset with an NPV less than zero is assumed to be a poor invest-ment. Using a DCF tool, two dissimilar and complex cash flows may be compared side-by-side and evaluated on each asset’s relative NPV merit. For the purposes of this study, we developed a three-step process with an objective of optimizing a “suite” of four HPFS systems. The first step involved the establishment of a base-line investment level. The assumptions were as follows: A single tenant would occupy the entire multi-story building for a lease period of ten years. Figure 1 is
Figure 1. Four-story atrium lobby
a photograph from the four-story atrium lobby amenity of the “Executive Centre”, a building of structural steel, precast concrete panels, and reflective insulating glass that is mechanically conditioned with a rooftop variable-air-volume system. The original construction date was 1986.
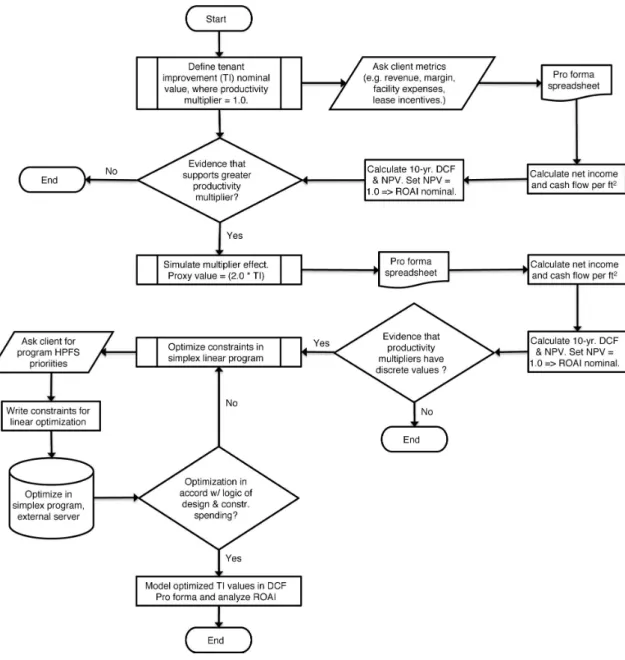
The company was modeled from business census data from the region local to the subject building, Cincin-nati, Ohio. The gross revenue per employee in a com-pany with 500 employees was assumed to be $ 200,000. The average salary of an employee in a company of this size and $ 100 million in gross revenues was assumed to be $ 77,000. Figure 2 is a flow chart, which de-scribes the HPFS process. A common multiplier firms use to cover the cost of revenue producing employees is 2.5. The authors rounded $ 193,000 (i.e., product of 77,000 and 2.5) to $ 200,000 gross revenues, in order to normalize the two assumptions.
A common profit assumption for companies of this size in the service sector (i.e., real estate operations) was assumed to be 15%, and that yielded a net income (i.e., profit) per employee of $ 30,000. All profitabil-ity values and expenses were ultimately converted to a dollar-per-square-foot number for the pro forma. The baseline tenant improvement investment (i.e., control condition) was assumed at $ 34/ft2. The productiv-ity multiplier for the baseline pro forma was set at a nominal 1.0. The remaining assumptions were as de-scribed in Table1. The resultant NPV for the control condition (i.e., no changes) was set to a nominal value (i.e., $ 493 = 1.0) in order to compare the experimental ROAI to a baseline control value.
The second step involved establishing a theoretical test for the productivity multiplier section. The im-plication here was that architecture was an asset that firms leveraged (e.g., through rent and building oper-ations investments) in order to produce profit. This model isolated the productivity improvement effects of greater investment. The second pro forma used the minima (i.e., most conservative) values from the range that Loftness et al. (2007) proposed. Loftness et al. (2007) had no proposed value for cultural aspects, and for this study the multiplier was set to 1.01 as an illus-tration of the method. The analysis proposed that a doubling of the minimal improvements budget from $ 34/f t2to $ 68/f t2yielded a theoretical ROAI effect of 1.9 (i.e., $ 65/f t2 of additional profit). This doubling was arbitrary; and, the purpose of the linear program-ming model proposed in step three was to solve for an optimized suite (i.e., set) of improvements.
The third step provided a systematic way to opti-mize what was a multivariate objective assumed to be a linear function subject to constraints. For this we em-ployed concepts from linear programming based on the simplex method - an iterative process that approaches an optimum solution (i.e., minimization of tenant im-provement costs for HPFS). Every system outside of the theoretical optimum may be subjected to several
Table 1. DCF of standard tenant improvements (i.e., $ 34) Item 2011 2012 2013 2014 2015 2016 2017 2018 2019 2020 2021 Income Net income $30,000 $31,200 $32,448 $33,746 $35,096 $36,500 $37,960 $39,478 $41,057 $42,699 per worker Net income $109 $113 $118 $122 $127 $132 $138 $143 $149 $155 perf t2 Productivity multiplier Thermal comfort 1.0 $0 $0 $0 $0 $0 $0 $0 $0 $0 $0 Lighting 1.0 $0 $0 $0 $0 $0 $0 $0 $0 $0 $0 Air quality 1.0 $0 $0 $0 $0 $0 $0 $0 $0 $0 $0 Cultural 1.0 $0 $0 $0 $0 $0 $0 $0 $0 $0 $0
Total net income $109 $113 $118 $122 $127 $132 $138 $143 $149 $155
perf t2 Operating expenses Rent perf t2 11.00 11.33 11.67 12.02 12.38 12.75 13.13 13.53 13.93 14.35 Churn perf t2 0.82 0.84 0.86 0.89 0.92 0.95 0.97 1.00 1.03 1.06 Utilities perf t2 8.00 8.24 8.49 8.74 9.00 9.27 9.55 9.84 10.13 10.44 Capital expenses Tenant improve- $34 ments perf t2 Return on leasable asset
Net cash flows -$34 $89 $93 $97 $101 $105 $109 $114 $119 $124 $129
perf t2
Net present value $493 perf t2
Notes: 1. Gross revenue per worker: $ 200000; 2. Cost of revenue less officing: $ 170000; 3. Revenue growth rate: 4%; 4. Employees: 500; 5. Leasable area: 138000f t2; 6. Net profit margin before officing: 15%; 7. Annual churn rate: 45%; 8. Annual churn costs: 0.82$/f t2; 9. Rent: 11$/f t2; 10. Utilities: 8$/f t2; 11. CPI expenses escalation: 3%; 12. NPV discount rate (ROA): 12%. forms of inefficiency. Our linear programming model
considers one such form of inefficiency common to all real estate, load factor. This is a multiplier that ac-counts for the share of the common areas and is usually expressed as a percentage (i.e., assumed to be 11% in this study). Another inefficiency accounted for in the model is the inexact matching of system costs to the theoretical investment levels. As an example, thermal comfort may yield a 2% increase in productivity at an optimized investment level (i.e., $ 4/f t2). The yield may vary somewhat at the actual investment level of $ 3.75, as an arbitrary cost described here for the sake of illustration.
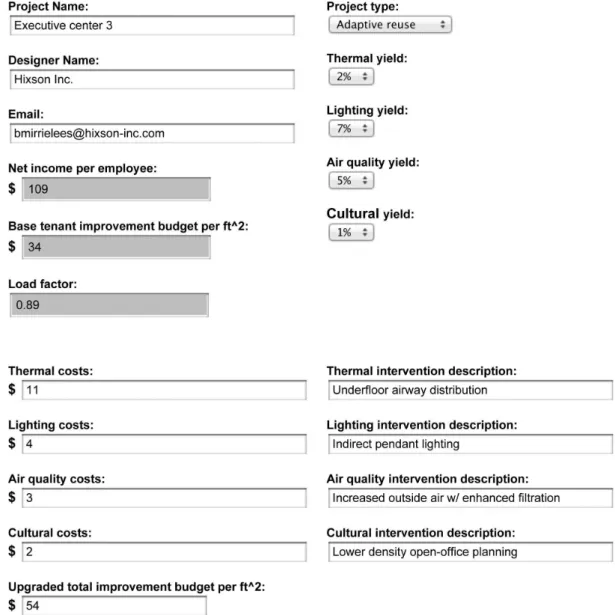
Figure 3 illustrates a web-based interface and form that allows a designer to input some project charac-teristics to test in the HPFS algorithm. Several of the form fields (i.e., gray-colored) depend on a calculated result from the proxy-optimized pro forma worksheet in Table2. The web-based form provides a tool for the preparation of an objective and constraints statement for use in a simplex method tool (Waner 2010). In our study, we relied on the easy-to-use “Finite mathematics utility: simplex method tool.” The optimal solution provided a value for the second year (i.e., 2012) net cash flow per square foot, and the sum of the variable values given (e.g., x, y, z andw) provided a first year (i.e., 2011) tenant improvement per square foot. Enter-ing these “optimized” values once more into the spread-sheet (i.e., Table3) illustrated a persuasive analysis for the client that a designer can use to demonstrate an as-set valuation (quantitative) approach that supports the owner’s qualitative goals.
The proxy value we used in Table2proposed a dou-bling of the tenant improvement budget ($ 68). The investment in HPFS at the proxy level implied a
pro-ductivity yield of $ 65/f t2 and a total value proposi-tion of almost $ 9.0 million. We defined the ROAI as the ratio of the total value proposition (i.e., $ 65/f t2
× 138,000f t2 = $ 8.97 million) to the upgrade costs difference between HPFS and the standard tenant im-provement budget (i.e., $ 34/f t2 × 138,000f t2 = $ 4.69 million). The proxy ROAI was calculated as 1.9 (i.e., 9.0/4.7). The investment in added value results in marginally higher first costs. Doubling a client’s tenant improvement budget would likely be a difficult propo-sition for an architect to sell. The architect and client may agree there is an intuitive case for an HPFS invest-ment. The authors sought to find an optimal mix, or “suite” of investments in productivity multiplying ten-ant improvements. The HPFS algorithm is a life-cycle costing methodology and is unique in addressing the productivity-multiplier effect.
4
OPTIMIZED RESULTS
4.1
The Optimization Model
The authors have demonstrated the DCF approach to valuing investments in architectural improvements first by establishing the control condition of a $ 34/f t2 ten-ant improvement with no consideration for the four HPFS investments in thermal, lighting, air quality and improved office planning (Table1). An initial trial run of the DCF, which doubled the tenant improvement ($ 68/f t2) and invested $ 34/f t2 in HPFS interven-tions, yielded productivity dividends (Table 2). The authors hypothesized that applying a linear program-ming model may optimize the HPFS investment pro-ductivity yields. A linear objective function was de-signed to find a minimum value of investment subject
Table 2. DCF of proxy HPFS tenant improvements (i.e., 2 ×$ 34 = $ 68) Item 2011 2012 2013 2014 2015 2016 2017 2018 2019 2020 2021 Income Net income $30,000 $31,200 $32,448 $33,746 $35,096 $36,500 $37,960 $39,478 $41,057 $42,699 per worker Net income $109 $113 $118 $122 $127 $132 $138 $143 $149 $155 perf t2 Productivity multiplier Thermal comfort 1.02 $2 $2 $2 $2 $3 $3 $3 $3 $3 $3 Lighting 1.07 $8 $8 $8 $9 $9 $9 $10 $10 $10 $11 Air quality 1.05 $5 $6 $6 $6 $6 $7 $7 $7 $7 $8 Cultural 1.01 $1 $1 $1 $1 $1 $1 $1 $1 $1 $2
Total net income $125 $130 $135 $141 $146 $152 $158 $164 $171 $178
perf t2 Operating expenses Rent perf t2 11.00 11.33 11.67 12.02 12.38 12.75 13.13 13.53 13.93 14.35 Churn perf t2 0.82 0.84 0.86 0.89 0.92 0.95 0.97 1.00 1.03 1.06 Utilities perf t2 8.00 8.24 8.49 8.74 9.00 9.27 9.55 9.84 10.13 10.44 Capital expenses Thermal interven- $17 tion costs Lighting interven- $8 tion costs Air quality $5 intervention costs Cultural interven- $4 tion costs Tenant improve- $68 ments perf t2
Return on leasable asset
Net cash flows -$68 $105 $110 $114 $119 $124 $129 $135 $140 $146 $152
perf t2
Net present value $558 perf t2
Notes: 1. Gross revenue per worker: $ 200000; 2. Cost of revenue less officing: $ 170000; 3. Revenue growth rate: 4%; 4. Employees: 500; 5. Leasable area: 138000f t2; 6. Net profit margin before officing: 15%; 7. Annual churn rate: 45%; 8. Annual churn costs: 0.82$/f t2; 9. Rent: 11$/f t2; 10. Utilities: 8$/f t2; 11. CPI expenses escalation: 3%; 12. NPV discount rate (ROA): 12%.
Table 3. DCF of experimental HPFS tenant improvements (i.e., linear program optimal = $ 50.20)
Item 2011 2012 2013 2014 2015 2016 2017 2018 2019 2020 2021 Income Net income $30,000 $31,200 $32,448 $33,746 $35,096 $36,500 $37,960 $39,478 $41,057 $42,699 per worker Net income $109 $113 $118 $122 $127 $132 $138 $143 $149 $155 perf t2 Productivity multiplier Thermal comfort 1.02 $2 $2 $2 $2 $3 $3 $3 $3 $3 $3 Lighting 1.07 $8 $8 $8 $9 $9 $9 $10 $10 $10 $11 Air quality 1.05 $5 $6 $6 $6 $6 $7 $7 $7 $ 7 $8 Cultural 1.01 $ 1 $1 $1 $1 $1 $1 $1 $1 $1 $2
Total net income $125 $130 $135 $141 $146 $152 $158 $164 $171 $178
perf t2 Operating expenses Rent perf t2 11.00 11.33 11.67 12.02 12.38 12.75 13.13 13.53 13.93 14.35 Churn perf t2 0.82 0.84 0.86 0.89 0.92 0.95 0.97 1.00 1.03 1.06 Utilities perf t2 8.00 8.24 8.49 8.74 9.00 9.27 9.55 9.84 10.13 10.44 Capital expenses Thermal interven- $10 tion costs Lighting interven- $4.2 tion costs Air quality $1 intervention costs Cultural interven- $1 tion costs Tenant improve- $50.2 ments perf t2
Return on leasable asset
Net cash flows -$50.2 $105 $110 $114 $119 $124 $129 $135 $140 $146 $152
perf t2
Net present value $574 perf t2
Notes: 1. Gross revenue per worker: $ 200000; 2. Cost of revenue less officing: $ 170000; 3. Revenue growth rate: 4%; 4. Employees: 500; 5. Leasable area: 138000f t2; 6. Net profit margin before officing: 15%; 7. Annual churn rate: 45%; 8. Annual churn costs: 0.82$/f t2; 9. Rent: 11$/f t2; 10. Utilities: 8$/f t2; 11. CPI expenses escalation: 3%; 12. NPV discount rate (ROA): 12%.
Figure 2. HPFS process flow chart to a set of linear constraints. The most common
pro-cess for solving linear programs is known as the Sim-plex Method, and the authors used a web-based tool available from Zweig media (Waner 2010). Once an optimal value of the objective statement was derived, then the investment mix of values were input as an ex-perimental run of the DCF that allowed us to project the improved productivity dividends (see Table3). The following subsection describes how we derived the ob-jective statement for the model.
4.2
The HPFS Objective Statement
In the optimized example the client was assumed to have a budget of up to $ 20/f t2to spend on HPFS over the standard tenant improvement allowance of $ 34/f t2 (i.e., variable “t”). The selected HPFS suite was as fol-lows: thermal intervention - under floor airway distri-bution system (i.e., variable “x”); lighting intervention - indirect pendant interior lighting (i.e., variable “y”);
air quality intervention - increased outside air with en-hanced filtration system (i.e., variable “z”); and, lower density open-office planning (i.e., variable “w”). The objective for the client would therefore be to minimize the expense of incremental construction costs, p, for the leased asset that yielded future productivity gains for employees.
The objective statement designed for the linear pro-gram with constraints was:
Minimize p=x+y+z+w+t s.t. 1.94x+ 6.79y+ 4.85z+ 0.97w≥54 x+y+z+w≤20 x≥10 y≥1 z≥1 w≥1 t≥34 (1)
Figure 3. HPFS project data entry form The multivariate constraints for the objective
state-ment were described as follows:
1. The first constraint was the sum of all productiv-ity yields applied to the net income expressed in units of $/f t2. Each productivity yield was lim-ited by the load factor (i.e., 11%). As an example, the thermal coefficient of 1.94x was calculated as the product of the thermal productivity yield
(0.02) the net income/f t2 ($ 109) and the load factor (0.89). The inference was that a 2% as-sumed gain in productivity due to an HPFS ther-mal intervention would yield a $ 1.94/f t2 pro-ductivity dividend. The same process was used for lighting (6.79), air quality (4.85) and cultural (0.97). The sum of the productivity yields was set to a threshold value of $ 54 (total budget) and implied an optimal combination calculated
as the sum of the standard tenant improvement costs ($ 34) and the budgeted incremental costs for the construction ($ 20).
2. The second constraint served to limit the total budget for the four interventions to the incremen-tal investment in HPFS ($ 20).
3. The third constraint was based on an assump-tion about the experience-based “logical” mix of tenant improvements. The value of the thermal interventions was assumed to make up at least one-half ($ 10) of the total budget.
4. The fourth, fifth and sixth constraints were the next three HPFS variables, which ensured a min-imum investment of at least $ 1/f t2.
5. The last constraint was to ensure that the stan-dard tenant improvement costs ($ 34) were main-tained independent of the optimization for the original purpose of finishes, patch and repair costs.
4.3
The Optimized Results
The model is robust and scalable, because the con-straints can be fine-tuned for each specific project. As an example, as budgets vary so too might the HPFS “mix” and the designer could simulate a change in the expense ratios for each intervention. The results for the current optimized investment were as follows:
p= 50.2, x= 10,y = 4.2,z = 1,w= 1, t= 34 Table 3 demonstrates the optimization effect of the investment (ROAI) in the discounted cash flow pro forma. The optimal value we used in Table 3 was a calculated total budget of $ 50.2/f t2. The investment in HPFS at the optimal level implied a productivity yield of $ 81/f t2 and a total value proposition of al-most $ 11.15 million. Table4provides a ratio analysis of the discounted cash flow comparisons. We calculated the ROAI as the ratio of the total value proposition to the upgrade costs difference between the optimal HPFS and the standard tenant improvement budget (i.e., $ 16.2/f t2 × 138,000f t2 = $ 2.24 million). The proxy ROAI was calculated as 5.0 (i.e., 11.15/2.24). The
Table 4. Ratio analysis of the discounted cash flow comparisons
Analysis Value
NPV1-NPV0 (Table 2: 2.0×$34 = $ 68) 65 Total value proposition1 $8,954,153
Tenant improvement (TI) upgrade costs difference $4,692,000 Assumed return on base TI (i.e., no upgrades) 1.0 Calculated return on upgrade investment (ROAI)2 1.9
NPV2-NPV0 (Table 3: Optimized = $50.2) $81 Total value proposition1 $11,147,368
Tenant improvement (TI) upgrade costs difference $2,235,600 Linear program optimization value ROAI 5.0 Notes: 1. Product of the NPV difference ($/f t2) and total
project area; 2. Ratio of the total value proposition to the upgrade costs difference.
optimization algorithm allowed for an ROAI increase of almost 163% and an improvement of approximately $ 2.19 million in the total value proposition.
5
CONCLUSIONS
This study examined a design technique described byMirrielees (2006), who proposed that facilities (of-fices) should be considered as a system and conceptual-ized this approach as HPFS. In the current study, this design technique was applied to the adaptive reuse of an existing 138,000-ft2 mid-rise, multi-tenant office fa-cility for single tenant occupancy. Business census data from the Cincinnati, Ohio region was used to model a company with 500 employees producing an assumed annual gross income of $ 200 thousand per employee.
A discounted cash flow analysis was used to evaluate three different design scenarios with all relevant values expressed as $ /f t2of leasable space. The first of these assumed that the building owner provided a minimal tenant improvement incentive set at $ 34/f t2. This established the baseline needed to compare alternative design approaches. A linear program model was then constructed to account for a suite of design interven-tions aimed at improving; 1) thermal comfort 2) light-ing 3) indoor air quality and 4) cultural aspects within the workplace. Using minimal productivity improve-ments from an earlier study by Loftness et al. (2007) for the first three factors and an assumed value for the cultural aspects factor, the linear model was used to analyze a second design scenario which assumed an ar-bitrary doubling of the tenant improvement incentive to $ 68/f t2with the additional $ 34/f t2 spread across the 4 factors known to affect productivity. In the third scenario, an optimized mixture of design improvements was selected using the HPFS technique. In this case the expenditures for the four design improvements were op-timized within a set of defined constraints.
Each of the three design scenarios was subjected to a 10 year, discounted cash flow analysis to deter-mine the NPV of the tenant improvement investments. The baseline case was found to have an NPV of $ 493/f t2, while the second scenario had an NPV of $ 558/f t2. The third scenario, which included the optimized HPFS design technique, had a tenant im-provement incentive of $ 50.2/f t2 and an NPV of $ 574/f t2. These values were then extended over the leasable floor area of the facility to determine the in-cremental cash flow realized from the additional tenant improvement investment. The analysis shows that a doubling of the tenant improvement investment with-out regard to HPFS produced a ROAI of 1.9 times the baseline. Application of HPFS in an optimized fash-ion to the adaptive reuse of this existing office facility produced an ROAI of 5.0 (i.e., each additional dollar invested in the design improvements provided a $ 5 re-turn). This study has shown that application of the
HPFS technique to the design of office space can pro-vide significant economic benefit to a client. While the current study was limited to the adaptive reuse of an existing mid-rise office facility, the authors believe that the technique presented here can be applied to the de-sign of virtually all office facilities.
REFERENCES
Arge, K. (2005). “Adaptable office buildings: Theory and practice.” Facilities, 23(3-4), 119–127.
Block, L. K. and Stokes, G. S. (1989). “Performance and satisfaction in private versus nonprivate work settings.” Environment and Behavior, 21(3), 277– 297.
Boubekri, M., Hull, R. B., and Boyer, L. L. (1991). “Impact of window size and sunlight penetration in office workers mood and satisfaction.” Environment and Behavior, 23(4), 474–493.
Evans, G. W. and Johnson, D. (2000). “Stress and open-office noise.” Journal of Applied Psychology, 85(5), 779–783.
Fang, L., Wyon, D. P., Clausen, G., and Fanger, P. O. (2004). “Impact of indoor air temperature and hu-midity in an office on perceived air quality, SBS symptoms and performance.”Indoor Air, 14(Supple-ment s7), 74–81.
Frontczak, M. and Wargocki, P. (2011). “Literature sur-vey on how different factors influence human comfort in indoor environments.”Building and Environment, 46(4), 922–937.
Geltner, D. and Miller, N. (2001).Commercial Real Es-tate Analysis and Investments. South-western Pub-lishing, Mason, Ohio, United States.
Gratia, E. and De Herde, A. (2003). “Design of low en-ergy office buildings.” Energy and Buildings, 35(5), 473–491.
Haynes, B. P. (2008). “An evaluation of the impact of the office environment on productivity.” Facilities, 26(5-6), 178–195.
Haynes, B. P. (2009). “Research design for the mea-surement of perceived office productivity.”Intelligent Buildings International, 1(3), 169–183.
Heiselberg, P., Brohus, H., Hesselholt, A., Rasmussen, H., Seinre, E., and Thomas, S. (2009). “Application of sensitivity analysis in design of sustainable build-ings.” Renewable Energy, 34(9), 2030–2036.
Juslén, H., Wouters, M., and Tenner, A. (2007). “The influence of controllable task-lighting on productiv-ity: A field study in a factory.” Applied Ergonomics, 38(1), 39–44.
Lan, L., Wargocki, P., and Lian, Z. (2011). “Quanti-tative measurement of productivity loss due to ther-mal discomfort.” Energy and Buildings, 43(5), 1057– 1062.
Lee, Y. S. and Guerin, D. A. (2010). “Indoor envi-ronmental quality differences between office types in LEED-certified buildings in the US.” Building and Environment, 45(5), 1104–1112.
Loftness, V., Hakkinen, B., Adan, O., and Nevalainen, A. (2007). “Elements that contribute to healthy building design.”Environmental Health Perspectives, 115(6), 965–970.
Mirrielees, B. F. (2006). “High performance facility synchronization.” Journal of Facilities Management, 4(3), 192–202.
Niemelä, R., Hannula, M., Rautio, S., Reijula, K., and Railio, J. (2002). “The effect of air temperature on labour productivity in call centres - A case study.”
Energy and Buildings, 34(8), 759–764.
Oldham, G. R. (1988). “Effects of changes in workspace partitions and spatial density on employee reactions: A quasi-experiment.”Journal of Applied Psychology, 73(2), 253–258.
Pati, D., Park, C.-S., and Augenbroe, G. (2010). “Fa-cility maintenance performance perspective to target strategic organizational objectives.” Journal of Per-formance of Constructed Facilities, 24(2), 180–187. Pawel, W., Wyon, D. P., and Fanger, P. O. (2000).
“Productivity is affected by the air quality in offices.”
Proceedings of Healthy Buildings, Espoo, Finland, 635–640.
Pennell, N. (2009). “If you ask me.” Engineering and Technology, 4(16), 14.
Pugsley, D. and Haynes, B. (2002). “An alternative use of space in government office accommodation.” Fa-cilities, 20(1-2), 34–40.
Seppanen, O., Fisk, W. J., and Lei, Q. H. (2006).
Room Temperature and Productivity in Office Work. Lawrence Berkeley National Laboratory, Berkeley, California, United States.
Sundstrom, E., Town, J. P., Rice, R. W., Osborn, D. P., and Brill, M. (1994). “Office noise, satisfac-tion, and performance.” Environment and Behavior, 26(2), 195–222.
Waner, S. (2010). Simplex Method Tool. Available at <http://www.zweigmedia.com/RealWorld/simp lex.html>.
Wargocki, P. and Djukanovic, R. (2005). “Simulations of the potential revenue from investment in improved indoor air quality in an office building.” ASHRAE Transactions, 111(2), 699–711.