Toward Green Cloud Computing
Feng-Seng Chu
Graduate Institute of Communication Engineering,
National Taiwan University, Taipei, Taiwan
[email protected]
Kwang-Cheng Chen
Graduate Institute of Communication Engineering,National Taiwan University, Taipei, Taiwan
[email protected]
Chen-Mou Cheng
Department of ElectricalEngineering, National Taiwan University,
Taipei, Taiwan
[email protected]
ABSTRACT
Cloud computing is emerging as a critical information com-munication technology to heavily impact our daily life in the future. We systematically analyze its energy consump-tion based on types of services and obtain the condiconsump-tions to facilitate green cloud computing to save overall energy consumption in the related information communication sys-tems. With a tremendously increasing number of mobile devices, green mobile communications would be the founda-tion of green cloud computing.
Categories and Subject Descriptors
A.1 [Introduction and Survey]: problem analysis and measure
General Terms
Theory
Keywords
Cloud computing, mobile computing, mobile Internet, en-ergy efficiency, green communications.
1.
INTRODUCTION
The depletion of fossil energy has become one of the major challenges for mankind to sustain the civilization. In addi-tion, overindulgent energy consumption causes over emission of green-house gas, which, according to expert consensus [6], is a root cause for the current global warming. Seeking to replace fossil energy appears to be an attractive idea, but it may take a long time for the alternatives to attain wide deployment and economic efficiency. It is, therefore, impera-tive for mankind to seekgreen technologies, i.e., technologies that can reduce energy consumption.
Among all industries, the information communication tech-nology (ICT) industry is arguably responsible for a large portion of the world-wide growth in energy consumption. This is partly attributed to the rapidly increasing number of
Permission to make digital or hard copies of all or part of this work for personal or classroom use is granted without fee provided that copies are not made or distributed for profit or commercial advantage and that copies bear this notice and the full citation on the first page. To copy otherwise, to republish, to post on servers or to redistribute to lists, requires prior specific permission and/or a fee.
ICUIMC’11, February 21-23, 2011, Seoul, korea. Copyright 2011 ACM 978-1-4503-0571-6 ...$10.00.
Internet and mobile ICT devices available across the globe. As Internet has penetrated into our daily lives, cloud com-puting has emerged as a new kind of “utility” that gets de-livered through wired or wireless networks [3]. Although it is widely claimed that cloud computing is “green” because of its better energy efficiency [10, 2, 5], we are going to exam-ine this thesis more carefully via an analytic approach in this paper. We will investigate whether the energy consumption is reduced by the introduction of cloud computing, as well as to determine under what circumstances cloud computing could be green. Hopefully our conclusion here will provide some insights into and help progress toward greener cloud computing.
Like most buzzwords, there are no universally agreed defi-nitions for cloud computing. There are several well-known pioneering papers on defining what cloud computing is [3, 8], whereas more discussions can be found elsewhere [10, 2, 5]. Based on these works, we summarize that cloud comput-ing is a networked computcomput-ing structure with the followcomput-ing features:
• consolidation of computing resources viavirtualization;
• maximization of resource utilization throughon-demand, real-timeprovisioning;
• delivery of computing, including applications, software, platforms, and infrastructures, asservices.
In its own jargon, “the cloud” in cloud computing loosely refers to the remote computing resources, usually under cen-tralized management like servers in data centers, that pro-vide services to users over internet. It is the paradigm of cloud computing that users move their computation that is traditionally carried out on personal terminals and local servers to the cloud.
In such a new paradigm, it is of crucial importance that the cloud have good energy efficiency. Srikantaiahet al. point out that a major cause of energy inefficiency in data centers is the idle power wasted when servers run at low utiliza-tion [10]. They study how to keep servers at high utilizautiliza-tion by workload consolidation. AbdelSalam et al. claim that the request arrival rate at servers varies with time [2]. They develop mechanisms to predict future arrival rates from his-tory and estimate the optimal number of servers for a class of arrival rates. Berl et al. review the literature of
achiev-Figure 1: Networking infrastructures with and with-out the cloud.
ing higher energy efficiency for data centers, grid comput-ing, and distributed computing in general [5]. They suggest solutions along four dimensions: energy-efficient hardware, energy-aware scheduling, power-minimization in server clus-ter, and power-minimization in wired and wireless networks. We stress that our work differs from all the above. We focus on the overall impact on energy consumption brought by cloud computing and find out when it is green. To the best of our knowledge, this is the first analytic work that tries to answer this question using a systematic approach.
2.
ANALYTICAL METHODOLOGY
Figure 1 shows the difference in networking infrastructure brought by cloud computing. The system-wide energy con-sumption is the sum of energy consumed byall ICT devices involved in the system, which we classify into three cate-gories according to their functionality.
• Personal terminals: all kinds of personal application devices such as desktop computers, laptop computers, handsets, etc.
• Networking nodes: communication and networking de-vices that facilitate connectivity from dede-vices to the cloud, such as routers, switches, hubs, access points, etc.
• Local servers: the equipment to provide services to personal terminals, such as application servers.
We consider energy consumption induced by computation and communication for personal terminals and local servers, but for networking nodes, we only consider the latter. Based on traffic patterns, we classify applications into three cate-gories as follows.
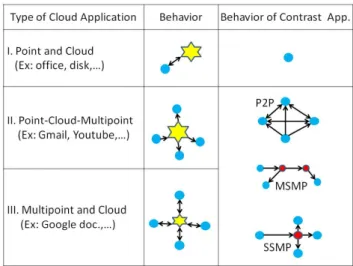
• Point and Cloud (Type I): applications that need only communication between user and the cloud. Examples include Dropbox, Remote Desktop, etc.
• Point-Cloud-Multipoint (Type II): applications in which traffic is initiated from one user to one or more other users through the cloud. Examples include Gmail, Skype, YouTube, etc.
• Multipoint and Cloud (Type III): applications that provide a platform for users to cooperate on a com-mon piece of work. A good example is Google Docs.
Figure 2: Categorization of cloud applications and their counterparts without the cloud.
We note that an application’s energy consumption should be classified according to its behavior rather than its exact name. For example, if a user uses Google Docs like in an email system and merely sends documents to one or more recipients, then instead of as a Type III application, it should be viewed as a Type II application in this case.
The three types of applications are summarized in Figure 2. In that figure, blue and red circles denote personal termi-nals and local servers, respectively, and yellow stars are data centers in the cloud. The black arrows represents commu-nication links, which also show the direction of information flows. The amount of energy consumed by each type of devices depend heavily on user behavior, which is different with and without the cloud. For example, if a group of users want to collaboratively prepare a set of documents without the cloud, they would have to work on their own personal terminals and exchange the documents through some net-working infrastructure. With cloud computing, they can simply collaborate by connecting to the cloud.
In Figure 2, we also list the corresponding contrast appli-cations that can run without the cloud. Obviously, Type I applications are to replace applications on personal termi-nals, so the contrast applications are those which run com-pletely on personal terminals without communicating with others, e.g., desktop office software. On the other hand, both Type II and Type III applications are to replace client-server or other type of applications that involve some communica-tion. We summarize the three types of contrast applications below.
• P2P (point-to-point): applications that communicate with each other directly, e.g., BitTorrent.
• MSMP (multi-server, multi-point): applications that communicate via multiple servers, e.g., email.
• SSMP (single-server, multi-point): applications that provide a central resource repository, e.g., file transfer.
Finally, we determine and compare the overall system-wide energy consumption with and without cloud computing as follows.
1. For each type of cloud applications and the correspond-ing contrast applications, we estimate the difference in energy consumption resulted from changes in compu-tation and communication on personal terminals and local servers, as well as in communication on network nodes.
2. We estimate the energy required to operate a cloud, in-cluding energy for communication inside and between data centers, energy for computation carried out in data centers, energy for cooling and such, etc. This en-ergy is a fixed enen-ergy cost for cloud computing across a wide range of applications.
3. By summing over all devices the energy differences plus the induced operating energy for cloud computing, we come to a conclusion whether the introduction of cloud computing can indeed reduce overall system-wide en-ergy consumption.
3.
ENERGY CONSUMPTION ANALYSIS
In this section, we compute the difference in system-wide energy consumption with and without cloud computing to obtain the conditions under which cloud computing is green.
3.1
System Model
Assuming there areLpcategories of personal terminals,Ln
categories of network nodes, andLs categories of servers.
The number of devices in thelp-th category of personal
ter-minals is denoted as N(lp); similarly, we have N(ln) and
N(ls) for network nodes and servers, respectively. We
de-note, within a periodD, the energy for transmitting one bit and the energy consumed by the communication circuitry of devices in thelp-th category asEtx(lp) andEcir(lp),
respec-tively; similarly, we have [Etx(ln), Ecir(ln)] and [Etx(ls), Ecir(ls)]
for network nodes and servers, respectively. We denote the numbers of bits transmitted for device m as Tm(lp),
Tm(ln), and Tm(ls) for personal terminals, network nodes,
and servers, respectively. Then, the overall difference in communication energy consumption can be expressed as:
∆E(comm) = ∆ ∑ α∈{p,n,s} Lα ∑ lα=1 N∑(lα) m=1 [Tm(lα)Etx(lα) +Ecir(lα)] . (1) Within the same periodD, the computation energy for each category of personal terminals and servers is denoted as
Ecomp(lp) andEcomp(ls), respectively. As the computation
energy for network nodes remains constant with various traf-fic loads, the overall difference in computation energy con-sumption can be expressed as:
∆E(comp) = ∆ ∑ α∈{p,s} Lα ∑ lα=1 N(lα)Ecomp(lα) . (2) 1 1.5 2 2.5 3 3.5 4 4.5 5 0 0.2 0.4 0.6 0.8 1 1.2 1.4 1.6
Traffic per Terminal a Day (GB)
E n er g y p er D a y ( T e ra J o u le /d ay ) [∆E(comm)+E(cloud)], γ = 5, θ = 0.1 [∆E(comm)+E(cloud)], γ = 10, θ = 0.1 [∆E(comm)+E(cloud)], γ = 10, θ = 0.05 -∆E(comp), α = 0.8 -∆E(comp), α = 0.7 E(cloud)
The Cloud stops to be green after the cross point
Figure 3: Energy consumption for Type I applica-tions.
Finally, if we denote the energy for operating the cloud as
E(cloud), then a necessary condition for green cloud com-puting is
∆E(comm) + ∆E(comp) +E(cloud)<0. (3)
3.2
Energy Analysis for Type I Applications
From Figure 2, we can see that the overhead of Type I ap-plications comes mainly from the new traffic they gener-ate. This will certainly increase the communication energy consumption on personal terminals and network nodes, and thus ∆E(comm) > 0. The computation energy consump-tion on personal terminals decreases, i.e., ∆E(comp) <0, since some computational tasks are offloaded to the cloud. Taking into accounts the cloud operating energyE(cloud), the condition that the overall energy consumption can be reduced can be expressed as:
∆E(comm) +E(cloud)<|∆E(comp)|. (4) To better understand the effect of the new traffic, we plot the induced communication energy with traffic due to Type I applications in Figure 3. The interested reader is referred to the appendices for the detailed derivation of ∆E(comm),
E(cloud), and ∆E(comp). In Figure 3, α represents then energy saved when personal terminals offload their compu-tation to the cloud. The parameters γ and θ denote the overhead of the communication network. γis the number of bits generated in the network per data bit. Such an overhead may be due to control signaling like handshaking. θ is the performance degradation ratio for wired and wireless access at personal terminal. For example, even though the theo-retical data rate of IEEE 802.11 can be as high as 11 Mbps, in practice it is often a few hundred of Kbps. Such a degra-dation increases the energy cost per bit transmitted, as the power consumption remains high during the entire period of time when the transmitting radio is in operation.
From Figure 3, we have the following observations.
1. Unlimited traffic would offset, suggesting that data compression and efficient management to reduce traffic is vital to green cloud computing.
2. Inefficiency of wired and wireless access significantly increases the energy cost per bit transmitted, suggest-ing that effective transmission scheme and updated
0.2 0.4 0.6 0.8 1 1.2 1.4 0 0.2 0.4 0.6 0.8 1 1.2 1.4 1.6 1.8 2
Traffic per Terminal a Day (GB)
E n e rg y p e r D a y ( T e ra J o u le /d a y ) [∆E(comm) +E(cloud)], γ = 10, θ = 0.05 [∆E(comm) +E(cloud)], γ = 10, θ = 0.1 [∆E(comm) +E(cloud)], γ = 5, θ = 0.1 0.2 0.4 0.6 0.8 1 1.2 1.4 -∆E(comp), α = 0.8, β = 0.5 -∆E(comp), α = 0.7, β = 0.5 -∆E(comp), α = 0.7, β = 0.4 0.2 0.4 0.6 0.8 1 1.2 1.4 E(cloud)
Compared with MSMP Compared with P2P Compared with SSMP
Figure 4: Energy consumption for Type II applica-tions.
communication infrastructure is vital to green cloud computing.
3. It is critical to develop smart traffic routing algorithms in wired and wireless networks in order to reduce traffic overhead that wastes transmission power.
3.3
Energy Analysis for Type II Applications
The main effect of Type II applications on networking and connectivity is to the changed routing of traffic from local servers to remote servers in the cloud. Therefore, the com-munication energy of personal terminals is expected to be invariant, while the communication energy of networking nodes are expected to increase. Furthermore, the compu-tation energy consumption on personal terminals and local servers also decreases, as the tasks are offloaded to the cloud. Thus, the increased communication energy consumption due to routing changes needs to be compensated by the net en-ergy saving of moving computation from personal terminals and local servers to the cloud after taking the cloud’s fixed operation energy consumption into accounts. The formula for this condition is the same as (4).
To delineate the effects of routing changes, Figure 4 com-pares communication energy consumption for Type II ap-plications. The interested reader is referred to the appen-dices for more detail of this simulation. Here we only stress the most important parameterβ, which denotes the power saving for each server. We observe the following.
1. The increased communication energy consumption due to traffic redirection from local to remote servers in the cloud would eventually offset any benefits of computa-tion offloading, no matter compared with MSMP, P2P, or SSMP.
2. The computation energy saving from personal termi-nals is larger than from local server because there are much more personal terminals than local servers. Based on these observations, we suggest to study energy-efficient routing [7], which is not necessarily shortest path routing, as well as distributing energy load evenly through-out the network [9], in order to achieve green cloud comput-ing in this dimension. Moreover, better power management on personal terminals that adapts energy consumption ac-cording to computation load is also critical.
Figure 5: Energy consumption for Type III applica-tions.
3.4
Energy Analysis for Type III Applications
Type III applications also change traffic routing from local to remote server in the cloud. The major difference between Type III and Type II applications is that the former provides a platform for users to collaborate on a common task such that instead of the whole data, every user only needs to access the portion that he or she needs to complete his or her part of the work. Therefore, the overall system-wide traffic actuallydecreases in Type III applications, i.e., both ∆E(comm)<0 and ∆E(comp)<0. Thus, the condition under which the cloud computing is green becomes:
E(cloud)<|∆E(comp)|+|∆E(comm)|. (5) Figure 5 shows the potential energy savings for Type III ap-plications, where we assumeα= 0.8,β= 0.5,θ= 0.1, and
γ= 5. We can observe that the saved computation and com-munication energy is in general larger than the energy cost to operate the cloud. Although the energy saving from P2P de-creases with traffic, the total energy saving from all contrast applications increases with traffic. Therefore, Type III ap-plications can indeed effectively reduce overall system-wide energy consumption.
3.5
Effect of Increasing Terminals
One major factor for increased ICT energy consumption is the exponentially growing number of terminals, a phe-nomenon known as the network effect. Such an increasing number of terminals would not only increase the commu-nication energy but also decrease the computation energy saving from existing terminals and servers. In Figure 6, we plot the trend of communication energy consumption in-creasing and computation energy consumption dein-creasing as the number of wireless terminals increases, taking into ac-counts the cloud operation energy consumption. As long as the per-terminal computation energy saving is smaller than communication energy consumption, the cloud computing can not support indefinitely many terminals in an energy-efficient manner.
Finally, we note that although the increased number of ter-minals brings new businesses and revenues, it can not be considered positive from an energy-consumption viewpoint. To conquer this problem, in addition to effective data com-pression and management, low-power circuit and algorithm design for both computation and communication are
criti-Figure 6: Trends of energy consumption as number of terminals grows.
cal [7, 4].
4.
CONCLUDING REMARKS
In this paper, we have systematically analyzed the energy consumption of cloud computing based on the types of ser-vices and obtained the conditions under which the over-all system-wide energy consumption is reduced. We point out that data management, compression and efficient net-work access and infrastructure are critical to facilitate green cloud computing. Furthermore, we suggest to study in-tended, non-broadcasting routing to control routing over-head, as well as low-power terminal design to mitigate the ever-increasing energy consumption by exponentially grow-ing number of mobile terminals. Based on our observations, we conclude that green mobile communications would be a foundation for green cloud computing.
5.
REFERENCES
[1] Energy logic:reducing data center energy consumption by creating savings that cascade across systems, 2009. [2] H. AbdelSalam, K. Maly, R. Mukkamala, M. Zubair,
and D. Kaminsky. Towards energy efficient change management in a cloud computing environment. Scalability of Networks and Services, 5637:161–166, 2009.
[3] M. Armbrustet al.Above the clouds: A berkeley view of cloud computing. Technical Report
UCB/EECS-2009-28, EECS Department, University of California, Berkeley, February 2009.
[4] L. Benini, A. Bogliolo, and G. Micheli. A survey of design techniques for system-level dynamic power management.IEEE Transactions on VLSI System, 10(3):299–316, June 2000.
[5] A. Berl, E. Gelenbe, M. Girolamo, G. Giuliani, H. Meer, M. Dang, and K. Pentikousis.
Energy-efficient cloud computing.The Computer Journal Advance Access, August 2009.
[6] L. Bernstein. Climate change 2007: Synthesis report. Report of the Intergovernmental Panel on Climate Change, 2007.
[7] G. Fettweis, K. Chen, and R. Tafazoli. Green radio: Energy efficiency in wireless networks.KICS/IEEE Journal of Comm. and Networks, 12(2), April 2010. [8] J. Geelan. Twenty-one experts define cloud
computing.Virtualization Journal, January 2009.
Table 1: Energy usage of a 5,000-sq-ft data center
Category Power drawn
Computing 588 kW
UPS and distribution losses 72 kW
Cooling for computing and UPS losses 429 kW
MV transformer/others 38 kW
Total 1127 kW
[9] W. Heinzelman, A. Chandrakasan, and
H. Balakrishnan. Energy efficient communication protocols for wireless micro sensor networks. In Systems Science, volume 2, January 2000.
[10] S. Srikantaiah, A. Kansal, and F. Zhao. Energy aware consolidation for cloud computing. InPower Aware Computing and Systems, December 2008.
APPENDIX
In the appendices, we give the detail of how we estimate communication, computation and cloud energy consumption in our simulations.
A.
COMMUNICATION ENERGY
In (1), the overall communication energy consumption is the sum of transmission energy and circuit operation energy from all types of devices. For personal terminals (α=p), we consider two types (Lp= 2): those with wired (lp= 1) and
wireless (lp= 2) connectivity. Etx(lp= 1) andEcir(lp= 1)
are estimated, based on Intel PRO/100 M Desktop Adapter, to be 8.5×10⁻⁹joule/bit and 24480 joule/day. Etx(lp= 2)
and Ecir(lp = 2) are estimated, based on Broadcom
Air-Force IEEE 802.11b/g radio, to be 1.1×10⁻⁸ joule/bit and 25920 joule/day. For local servers (α=s), we assume that they use the same communication interfaces as wired termi-nals; thusEtx(ls) =Etx(lp= 1) andEcir(ls) =Ecir(lp= 1).
For network nodes, the optical fiber attenuation is about 0.3 db/km, and the data rate of router can be up to 40 Gbps, e.g., for CISCO CRS-1 series. The estimatedEtx(ln) is thus
2.7×10⁻¹¹ joule/kilometer/bit.
B.
COMPUTATION ENERGY
For computation energy consumption in (2), we need to esti-mateEcomp(lp) andEcomp(ls). For the two types of personal
terminals, we generally assume the power of wired terminals (lp= 1) is 200 Watt, while the power of wireless terminals
(lp= 2) is 3 Watt. Furthermore, we assume that wired
ter-minals are on 8 hours a day, and wireless terter-minals, 24 hours a day. Thus, the estimatedEcomp(lp= 1) andEcomp(lp= 2)
are 5.76×10⁶ joule/day and 129600 joule/day. For local servers, we assume the power consumption is 800 Watt, and they are 24 hours a day; thus the estimated Ecomp(ls) is
7×10⁷ joule/day.
C.
CLOUD OPERATION ENERGY
To estimate the cloud operation energyE(cloud) in (3), we summarize the energy consumption of a 5,000 square-foot data center in Table 1 [1], which is about 9.73×10¹⁰joule/day. Using Google’s data center in Dallas that consists of three 68,680-square-foot buildings as an example, the estimated energy consumption of a data center is 4×10¹¹joule/day.