Development of a steam systems energy efficiency cost curve
in China
Development of a steam systems
energy efficiency cost curve
in Industrial Steam Systems
in China
Development of a steam systems
energy efficiency cost curve
Disclaimer
This document has been produced without formal United Nations editing. The designations employed and the presentation of the material in this document do not imply the expression of any opinion whatsoever on the part of the Secretariat of the United Nations Industrial Development Organization (UNIDO) concerning the legal status of any country, territory, city or area or of its authorities, or concerning the delimitation of its frontiers or boundaries, or its economic system or degree of development. Designations such as “developed”, “industrialized” and “develop-ing” are intended for statistical convenience and do not necessarily express a judgment about the stage reached by a particular country or area in the development process. Mention of firm names or commercial products does not constitute an endorsement by UNIDO.
Although great care has been taken to maintain the accuracy of information herein, neither UNIDO nor its Member States assume any responsibility for consequences which may arise from the use of the material.
iii ■
The preparation of this publication was prepared by the United Nations Industrial Development Organization (UNIDO) Energy and Climate Change Branch, as a deliverable to the project “Promoting energy efficiency in industrial heat systems and high energy-consuming (HEC) equipment”.
This report was written by Ali Hasanbeigi of Lawrence Berkeley National Laboratory (LBNL), as an independent consultant to UNIDO with contributions from Greg Harell (Energy Management Services) and Bettina Schreck (UNIDO). We would also like to thank Marco Matteini of UNIDO, and Lynn Price and Bo Shen of LBNL for their insightful comments on the earlier version of this report. We are grateful to Edward Clarence-Smith and Ma Jian of UNIDO’s Beijing office; Guan Jian, Dou Wenyu, and Wang Zhongwei of China Special Equipment Inspection and Research Center; Hongyou Lu and Aimee McKane of LBNL; and Jimmy Kumana of Kumana and Associates for their assistance and contribution to this project. Special thanks go to UNIDO Industrial Energy Efficiency Unit colleagues: Rana Ghoneim, Marco Matteini, James New, Khac Tiep Nguyen, Sanjaya Shrestha and Marina Plutakhina for their valuable inputs and feedback, and to Pradeep Monga for his guidance. Finally, we would like to thank Alaina Pirie for her assistance in editing this report.
This work could not have been completed without the contributions and guidance of the steam system experts listed below. Their knowledge of the subject matter, patience with the iterative process of developing a new research framework, and generosity in finding time in extremely busy schedules are gratefully acknowledged.
Steam system experts:
Greg Harrell, Energy Management Services, Lead expert and co-author. Riyaz Papar, Hudson Technologies.
Veerasamy Venkatesan, VGAEC Inc. Giorgio Bocci, Independent consultant.
v ■
Abstract . . . . vii
Introduction . . . . 1
Objective of the study . . . . 1
Introduction to steam systems . . . . 2
Overview of manufacturing industry in China . . . . 3
Overview of boiler and steam systems in China and Chinese industry . . . . 5
1 . Methodology . . . . 9
1 .1 Data collection . . . . 11
1 .1 .1 Base case system efficiency scenarios . . . . 11
1 .1 .2 Determining the impact of energy efficiency measures . . . . 13
1 .2 Data preparation and assumptions . . . . 15
1 .2 .1 Expert input consolidation . . . . 15
1 .2 .2 Steam systems energy use by industry subsector . . . . 15
1 .3 Construction of a steam systems energy efficiency cost curve . . . . 18
1 .3 .1 Introduction to the energy efficiency cost curve . . . . 18
1 .3 .2 Discount rate . . . . 20
1 .3 .3 Annual fuel saving potential calculation method . . . . 20
1 .3 .4 Cost of conserved energy (CCE) calculation method . . . . 23
2 . Results and discussions . . . . 27
2 .1 Industrial steam systems energy efficiency cost curve . . . . 27
2 .2 Sensitivity analysis . . . . 29
2 .3 Uncertainties and limitations . . . . 31
2 .4 Policy implications . . . . 32
3 . Conclusions . . . . 35
vii ■
China became the world’s largest emitter of energy-related CO2 in 2007 and the world’s largest energy consumer in 2009. China was responsible for nearly 21 per cent of global energy use and 26 per cent of energy-related CO2 emissions in 2011. The industrial sector dominates the coun-try’s total energy consumption, accounting for about 70 per cent of primary energy use and 72 per cent of the country’s CO2 emissions in 2012. For these reasons, the development path of China’s industrial sector will greatly affect the future energy demand and dynamics of not only China, but the entire world.
Steam is used extensively as a means of delivering energy to industrial processes. On average, industrial steam systems account for around 30 per cent of manufacturing industry energy use worldwide. There exists a significant potential for energy efficiency improvement in steam systems; however, this potential is largely unrealized. A major barrier to effective policymaking, and to more global acceptance of the energy efficiency potential of steam systems, is the lack of a transparent methodology for quantifying steam system energy efficiency potential based on sufficient data to document the magnitude and cost-effectiveness of these energy savings by country and by region.
The goal of this study is to develop and apply a steam system energy efficiency cost curve model-ling framework to quantify the energy saving potential and associated costs of implementation of an array of steam system optimization measures. The developed steam systems energy efficiency cost curve modelling framework will be used to evaluate the energy efficiency potential of coal-fired boiler and steam systems in China’s industrial sector. Nine energy efficiency techno-logies and measures for steam systems are analysed.
This study found that total cost-effective (i.e. the cost of saving a unit of energy is lower than purchasing a unit of energy) and technically feasible fuel savings potential in industrial coal-fired steam systems in China in 2012 was 1,687 PJ and 2,047 PJ, respectively. These account for 23 per cent and 28 per cent of the total fuel used in industrial coal-fired steam systems in China in that year, respectively. The CO2 emission reduction potential associated with the cost-effective and total technical potential is equal to 165.82 MtCO2 and 201.23 MtCO2, respectively. By compari-son, the calculated technical fuel saving potential for industrial coal-fired steam systems in China is approximately 9 per cent of the total coal plus coke used in Chinese manufacturing in 2012 and is greater than the total primary energy use of over 160 countries in the world in 2010. Several sensitivity analyses were conducted, their policy implications discussed, and uncertain-ties and limitations of this study are presented.
1 ■
Objective of the study
The objective of this study is to develop and apply a steam system energy efficiency cost curve modelling framework to quantify the energy saving potential and associated costs of the imple-mentation of an array of steam system optimization measures.
On average, industrial steam systems account for approximately 30 per cent of manufactur-ing industry energy use worldwide (Yang and Dixon, 2012). Despite the existence of signifi-cant potential for energy efficiency improvement in steam systems (IEA, 2007), this potential is largely unrealized. The lack of information about potential savings and their magnitude as well as the lack of suitable policy frameworks and supporting programmes are key reasons why this potential remains untapped. A major barrier to effective policymaking, and to global acceptance of the energy efficiency potential of steam systems, is the lack of a transparent methodology for quantifying steam system energy efficiency potential based on sufficient data to document the magnitude and cost-effectiveness of these energy savings by country and by region. It is far easier to quantify the incremental energy savings of substituting an energy-efficient boiler for a standard boiler than it is to quantify the energy savings of apply-ing energy efficiency practices to an existapply-ing steam system, which goes beyond the boiler itself and includes the steam distribution network, heat recovery systems, and even steam end users. The former is dependent on the appropriate matching of the replacement boiler, but reasonable assumptions can be made that an incremental benefit against current prac-tice will occur. The latter is based on the concept of changing current pracprac-tice by applying commercially available technologies in the most energy-efficient manner, and requires on-site evaluation to maximize system efficiency. Providing a modelling framework for quantify-ing steam system energy efficiency potential that moves beyond case studies of individual applications is needed.
The development of such a steam system energy efficiency cost curve modelling framework will support greater global acceptance of the energy efficiency potential of industrial steam systems. This framework is applied to China as a case study. The steam systems energy effi-ciency cost curve modelling framework is used to quantify the energy saving potential and associated cost by the implementation of certain steam system optimization measures. The purpose of this research is to provide guidance for national policymakers and is not a substi-tute for a detailed technical assessment of the steam systems energy efficiency opportuni-ties of a specific plant.
■ 2
■ Energy Efficiency Potentials in Industrial Steam Systems in China
Introduction to steam systems
Steam is used extensively as a means of delivering energy to industrial processes. Steam holds a significant amount of energy on a unit mass basis that can be extracted as mechanical work through a turbine or as heat for process use. In addition, steam can be used to control tempera-tures and pressures during chemical processes, strip contaminants from process fluids, dry paper products, and in other miscellaneous applications (IEA, 2007). Equipment that uses steam varies substantially among industries and is generally process- and site-specific (Energetics, 2012). Table 1 shows examples of steam end-use equipment and processes in energy-intensive industrial subsectors.
Table 1. Steam end-use equipment in energy-intensive industries (U.S. DOE/AMO, 2012)
Equipment Process application Industry subsector
Condenser Steam turbine operation Aluminum, chemicals, forest products, glass, metal casting, petroleum refining, steel Distillation
tower Distillation, fractionation Chemicals, petroleum refining
Dryer Drying Forest products
Evaporator Evaporation/concentration Chemicals, forest products, petroleum refining
Process heat
exchanger Alkylation, process air heating, process water heating, gas recovery/light ends distillation, isomerization, storage tank heating, visbreaking/coking
Aluminum, chemicals, forest products, glass, metal casting, petroleum refining, steel
Reboiler Fractionation Petroleum refining
Reformer Hydrogen generation Chemicals, petroleum refining
Separator Component separation Chemicals, forest products, petroleum refining
Steam
ejector Condenser operation, vacuum distillation Aluminum, chemicals, forest products, glass, metal casting, petroleum refining, steel Steam
injector Agitation/blending, heating Chemicals, forest products, petroleum refining Steam
turbine Power generation, compressor mechani-cal drive, hydrocracking, naphtha reforming, pump mechanical drive, feed pump mechanical drive
Aluminum, chemicals, forest products, glass, metal casting, petroleum refining, steel
Stripper Distillation (crude and vacuum units), catalytic cracking, asphalt processing, catalytic reforming, component removal, component separation, fractionation, hydrogen treatment lube oil processing
Chemicals, petroleum refining
Thermo-
3 ■
Steam systems are made up of a range of components. Figure I provides a schematic diagram of a typical steam system.
The use of steam in different industry subsectors varies widely. In the United States, the top five steam-consuming industrial subsectors are forest products, chemicals, petroleum refining, food and beverage, and iron and steel (Energetics, 2012). In China, the top five steam-consuming industrial subsectors in 2012 were the chemical industry, smelting and pressing of ferrous metals (iron and steel industry), petroleum refining, food and beverage, and the textile industry.1 Figure I . Steam system schematic diagram (U .S . DOE/AMO, 2012)
The efficiency of steam boilers varies by design and fuel type. A well designed boiler fired by coal is typically about 84 per cent efficient (IEA, 2007). If natural gas, fuel oil or biomass is used as a fuel in a similar boiler instead of coal, the efficiency of the boiler is often lower. However, it should be noted that the boiler is only one part of an industrial steam supply system; distribution losses throughout the system can be quite important. While there are no detailed statistics regarding global system efficiencies, a study conducted by Energetics in 2012 estimated that overall indus-trial steam systems efficiency in the United States is around 60 per cent (Energetics, 2012).
Overview of manufacturing industry in China
China has experienced unprecedentedly rapid economic growth over the last thirty years. The annual gross domestic product (GDP) grew at an average rate of 10 per cent from 1980 to 2010 (NBS, 1981-2013). China became the world’s largest emitter of energy-related CO2 in 2007 and the world’s largest energy consumer in 2009 (IEA, 2011). China was responsible for nearly 21 per cent of global energy use and 26 per cent of energy-related CO2 emissions in 2011 followed by the United States, which represented around 18 per cent of global energy use and 18 per cent of global energy-related CO2 emissions in the same year (IEA, 2013a,b).
1 Calculated based on NBS (2013) - see table 7 .
Distribution CONDENSATE PIPING STEAM SYSTEM HEADER End use Generation Recovery Condensate receiver tank and pump Process heater Steam trap Wireless sensors Pressure reducing valve or black pressure turbine Isolation valve Process heater Deaerator Fuel
Boiler exhaust gasesCombustion air Forced draft plan
Combustion air preheater Shell and tube heat exchanger Feed water pump Boiler Economizer
■ 4
■ Energy Efficiency Potentials in Industrial Steam Systems in China
Unlike most countries, China’s energy consumption pattern is unique because the industrial sec-tor dominates the country’s total energy consumption, accounting for approximately 70 per cent of primary energy use and 72 per cent of country’s CO2 emissions2 in 2012 (NBS, 2013). For this
reason, the development path of China’s industrial sector will greatly affect future energy demand and the dynamics of not only China, but the entire world.
China is the world’s second largest economy after the United States. In 2010, China’s manufac-turing value added was equal to 10,935 billion 2005 RMB,3 accounting for around 35 per cent of
China’s total gross domestic product (GDP) that year (NBS, 1996-2011).4 Total Chinese
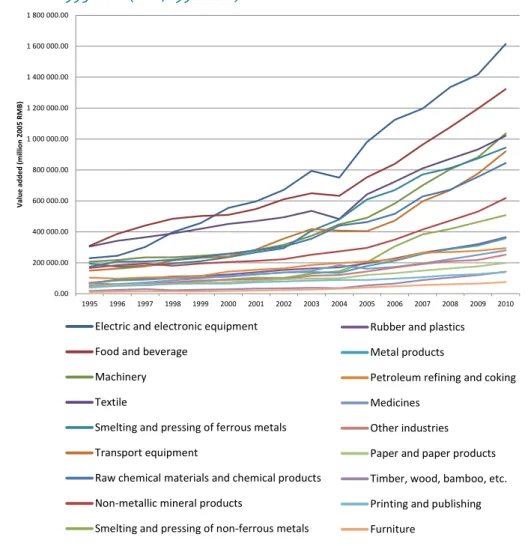
manufac-turing value added (in 2005 RMB) increased by 383 per cent over the period 1995-2010. This rate of increase is 2.8 times higher than the rate of increase in primary energy use, which increased by 137 per cent over the same period. Figure II shows that electric and electronic equipment manufacturing, food and beverage production, and the textile industry had the highest value added during the period 1995-2010. Between 1995 and 2010, there was no major shift between shares of value added from total manufacturing value added among the subsectors.
Figure II. Value added (million 2005 RMB) of different manufacturing subsectors in China, 1995-2010 (NBS, 1996-2011)
2 Carbon dioxide emissions were estimated based on reported energy data multiplied by IPCC default emission
factors (NBS, 1981-2011; IPCC, 1996).
3 Using an exchange rate of 6.8 RMB/US$ in 2010, this is equal to US$1,608 billion.
4 It should be noted that manufacturing does not include power generation, mining, and several other sectors that
are often included under “industry” sector in Chinese statistics.
0.00 200 000.00 400 000.00 600 000.00 800 000.00 1 000 000.00 1 200 000.00 1 400 000.00 1 600 000.00 1 800 000.00 1995 1996 1997 1998 1999 2000 2001 2002 2003 2004 2005 2006 2007 2008 2009 2010 Va lu e ad de d (mi lli on 2 00 5 R M B)
Electric and electronic equipment Food and beverage Machinery Textile
Smelting and pressing of ferrous metals Transport equipment
Raw chemical materials and chemical products Non-metallic mineral products Smelting and pressing of non-ferrous metals Rubber and plastics
Metal products Petroleum refining and Coking Medicines
Other industries Paper and paper products Timber, wood, bamboo, etc. Printing and publishing Furniture 0.00 200 000.00 400 000.00 600 000.00 800 000.00 1 000 000.00 1 200 000.00 1 400 000.00 1 600 000.00 1 800 000.00 1995 1996 1997 1998 1999 2000 2001 2002 2003 2004 2005 2006 2007 2008 2009 2010 Va lu e ad de d (mi lli on 2 00 5 R M B)
Electric and electronic equipment Food and beverage
Machinery Textile
Smelting and pressing of ferrous metals Transport equipment
Raw chemical materials and chemical products Non-metallic mineral products
Smelting and pressing of non-ferrous metals Rubber and plastics
Metal products
Petroleum refining and Coking Medicines
Other industries Paper and paper products Timber, wood, bamboo, etc. Printing and publishing Furniture 0.00 200 000.00 400 000.00 600 000.00 800 000.00 1 000 000.00 1 200 000.00 1 400 000.00 1 600 000.00 1 800 000.00 1995 1996 1997 1998 1999 2000 2001 2002 2003 2004 2005 2006 2007 2008 2009 2010 Va lu e ad de d (mi lli on 2 00 5 R M B)
Electric and electronic equipment Food and beverage
Machinery Textile
Smelting and pressing of ferrous metals Transport equipment
Raw chemical materials and chemical products Non-metallic mineral products
Smelting and pressing of non-ferrous metals Rubber and plastics
Metal products
Petroleum refining and coking Medicines
Other industries Paper and paper products Timber, wood, bamboo, etc. Printing and publishing Furniture
5 ■
The industry-dominated energy end-use structure in China is very different from the structure found in industrialized countries. For example, as illustrated in figure III, industry only accounted for 31 per cent of total energy in the United States in 2010.
Figure III. Primary energy use by sector in China (1980-2012) and the United States (2012) (NBS 1981-2013; U.S. DOE/EIA 2013b)
China United States
In 2010, the total primary energy use of Chinese manufacturing was 53,491 petajoules (PJ) which is a 36 per cent increase from the 2005 level (39,474 PJ) and a 137 per cent increase in primary energy use since 1995 (22,551 PJ). The increase in primary energy use during the period 1995-2010 varied among the manufacturing subsectors, but overall, the primary energy use of all manu-facturing subsectors in China increased during this period. Figure IV shows the trend of primary energy use of different manufacturing subsectors in China during 1995-2010.
Figure IV shows that the smelting and pressing of ferrous metals, manufacturing of raw chemical materials and chemical products, and non-metallic mineral products manufacturing subsectors were the top three primary energy-consuming manufacturing sectors in China during the period 1995-2010. Manufacturing of furniture, printing and publishing, and the processing of timber, manufacturing of wood and bamboo subsectors were the lowest energy-consuming sectors.
Overview of boiler and steam systems in China
and Chinese industry
In 2009, there were 595,200 boilers in use in China. Of these, there were 10,400 power plant boilers, 432,000 production and district heating boilers, 116,800 pressure water boilers, and 36,000 organic fluid heaters (Gao and Zhang, 2013). In 2010, these boilers used 2.24 billion tons of coal, or about 70 per cent of China’s total raw coal production of 3.24 billion (Dai and Xiong, 2013). 500 1,000 1,500 2,000 2,500 3,000 3,500 4,000 4,500 1980 1984 1988 1992 1996 2000 2004 2008 2012 M tc e
China
Commercial Residential Transport Industry 500 1,000 1,500 2,000 2,500 3,000 3,500 4,000 4,500 1980 1984 1988 1992 1996 2000 2004 2008 2012 M tc eChina
Commercial Residential Transport Industry 500 1,000 1,500 2,000 2,500 3,000 3,500 4,000 4,500 1980 1984 1988 1992 1996 2000 2004 2008 2012 M tc eChina
Commercial Residential Transport Industry 500 1,000 1,500 2,000 2,500 3,000 3,500 4,000 2012U.S.
Commercial Residential Transport Industry 500 1,000 1,500 2,000 2,500 3,000 3,500 4,000 4,500 1980 1984 1988 1992 1996 2000 2004 2008 2012 M tc eChina
Commercial Residential Transport Industry■ 6
■ Energy Efficiency Potentials in Industrial Steam Systems in China
Figure IV. Primary energy5 use of manufacturing subsectors in China, 1995-2010
(NBS, 1981-2013)
Boilers are widely used in Chinese industry. With China’s rapid industrialization and urbaniza-tion, boilers manufactured in China also grew rapidly. During the 11th Five Year Plan (FYP) period (2006-2010), the annual growth rate of boilers used in China was more than 14 per cent and the number of boilers in use reached 607,000 in 2010 (Dai and Xiong, 2013). In 2012, industrial steam systems accounted for around 25 per cent of the total fuel used in Chinese industry in that year.6
5 In primary energy use reported in NBS (1996-2011), electricity use is converted from final to primary energy using
average power generation efficiency in China in various years. The losses in the refining for the production of petroleum products and in coke making for production of coke are not included in the primary energy reported in NBS (1981-2011).
6 See table 7 for the calculation based on NBS (2013) and U.S. DOE/EIA (2013).
2 000 4 000 6 000 8 000 10 000 12 000 14 000 16 000 18 000 1995 1996 1997 1998 1999 2000 2001 2002 2003 2004 2005 2006 2007 2008 2009 2010 Pri ma ry E ne rg y U se (P J)
Smelting and pressing of ferrous metals
Raw chemical materials and chemical products Non-metallic mineral products Petroleum refining and coking Smelting and pressing of non-ferrous metals
Textile, apparel, chemical fibres, leather, fur
Food, beverage and tobacco Machinery
Electric and electronic equipment Paper and paper products Transport equipment Metal products Rubber and plastics Other industries Medicines
Timber, wood, bamboo, etc. Printing and publishing Furniture 2 000 4 000 6 000 8 000 10 000 12 000 14 000 16 000 18 000 1995 1996 1997 1998 1999 2000 2001 2002 2003 2004 2005 2006 2007 2008 2009 2010 Pri ma ry E ne rg y U se (P J)
Smelting and pressing of ferrous metals Raw chemical materials and chemical products Non-metallic mineral products
Petroleum refining and coking
Smelting and pressing of non-ferrous metals Textile, apparel, chemical fibres, leather, fur Food, beverage and tobacco
Machinery
Electric and electronic equipment Paper and paper products Transport equipment Metal products Rubber and plastics Other industries Medicines
Timber, wood, bamboo, etc. Printing and publishing Furniture
7 ■
In 2010, the average capacity of in-use boilers in China was about 3.4 tons of steam per hour (t/h). As such, the total capacity of China’s 607,000 boilers was 2,064,000 t/h in that year (Dai and Xiong, 2013). Based on coal use, boilers under 10 t/h accounted for around 50 per cent of total coal consumption in industrial boilers in China (Gao and Zhang, 2013). Coal-fired boilers account for around 80-85 per cent, oil- and gas-fired boilers account for around 15 per cent, and boilers that use other fuels (e.g. electricity, biomass, etc.) account for less than 5 per cent of the of total boiler capacity in China (Dai and Xiong, 2013). Unlike most developed countries, where coal-fired boilers outside of the power sector have been largely phased out, the majority of indus-trial boilers in China still burn coal. This is due to the cost advantages of coal relative to oil and natural gas, and the lack of large-scale domestic supplies of oil and natural gas in China. The coal-fired industrial boilers in China are mainly tiered burning boilers, which account for 95 per cent of coal-fired boilers. The number of circulating fluidized bed boilers with high effi-ciency, low pollution, and high coal fuel adaptability features is limited, representing 3-5 per cent of China’s boilers (Gao and Zhang, 2013).
During the 11th FYP period, about 15 per cent of coal-fired industrial boilers were retrofitted for energy efficiency improvement (Dai and Xiong, 2013). However, compared with developed coun-tries, the efficiency level of coal-fired industrial boilers in China is still low (Gao and Zhang, 2013). Therefore, in 2006, China’s National Development and Reform Commission (NDRC) put coal-fired boiler (furnaces) retrofits as one of the first items in the 11th FYP Ten Key Energy Saving Projects programme. Two additional projects, the “Regional Combined Heating and Power Project” and the “Waste Heat and Waste Pressure Utilization Project” were also directly related to steam system optimization (IIP, 2014).
Similar to many developing countries and even some developed countries, the focus on improve-ments for industrial steam systems in China has been mainly on the equipment (primarily boil-ers) rather than the entire steam system, which includes steam generation, distribution, end uses, and heat recovery systems. Although system optimization might be more difficult than changing a piece of equipment since it requires a more holistic knowledge and assessment of the system, it will often yield much greater energy saving compared to replacing a single compo-nent with a more efficient one. Besides, the presence of energy-efficient compocompo-nents (e.g. boil-ers), while important, provides no assurance that an industrial steam system will be energy-efficient. Misapplication of equipment to demand, mismanagement of the system, and operation below the optimal efficiency in the industrial steam systems are common (Williams et al., 2006). Therefore, there is a need for shifting the paradigm in China to focus attention on steam systems optimization and efficiency as a whole rather than focusing solely on boiler effi-ciency. The study presented in this report adopts such a holistic approach, focusing on steam system efficiency rather than on boilers alone.
9 ■
Methodology
1
This study focuses on coal-fired boilers and steam systems used in Chinese industry.7 The “steamsystem” boundary analysed in this study consists of the generation, distribution and recovery components of steam systems. The steam end uses and energy efficiency potential of the steam end uses are not included in this study. Furthermore, since electricity use accounts for only 1-2 per cent of the total energy use in the industrial steam systems, this study only focuses on fuel use and fuel savings in industrial steam systems and does not include electricity consump-tion or electricity efficiency measures and associated savings.
Since the focus of this study is on the fuel and thermal efficiency aspects of the steam system, cogeneration (or combined heat and power) and cogeneration components are not included for a number of reasons. First, cogeneration presents major complicating factors associated with system operation, performance evaluation and opportunity analysis. Second, many steam sys-tems do not incorporate cogeneration components. Third, the thermal issues discussed in this study remain intact (although altered in magnitude) even if the system contains cogeneration components. In other words, this study can be used as a guide for the thermal aspects of steam system evaluation noting that evaluations of the thermal aspects of cogeneration systems require a high degree of modelling and evaluation sophistication.
In addition, this study does not focus on fuel switching opportunities. It should also be noted that fuel switching (fuel selection) often happens because of economic-based decisions and most of the time, efficiency is not the target. For example, it is common for a fuel switch from natural gas to coal to increase system efficiency, but the major reduction in operating costs will arise from fuel unit cost.
Also, fuel type (coals, fuel oils, natural gas, biomass) has a significant influence on overall effi-ciency (fuel energy-to-load energy conversion). A coal-fired boiler burning high-quality coal with good combustion control and thermal energy recovery can operate with an efficiency of 90 per cent (in high heat value, HHV) while a biomass boiler with excellent combustion control and ther-mal energy recovery can only attain 70 per cent (in high heat value, HHV). Inclusion of the fuel type is outside the scope of this study because the dominant fuel in China is coal and the typical quality of coal in China is moderate.
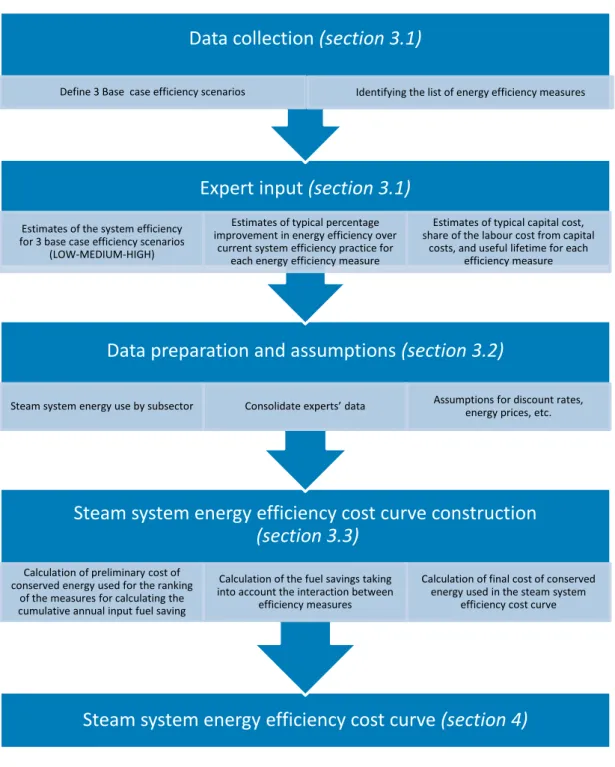
Figure V shows a schematic diagram of the methodology used for this study. First, a data collec-tion quescollec-tionnaire was developed to obtain expert input to supplement the existing data. Input
7 In Chinese statistics, the term “industry” refers to manufacturing as well as mining of coal and minerals, oil and gas
extraction, power generation, and production and distribution of water. These subsectors of industry (other than manu-facturing) are not included in the present study.
■ 10
■ Energy Efficiency Potentials in Industrial Steam Systems in China
was sought from seven steam system experts from the United States, Europe and China and responses were received from four of these experts. Information was sought from the experts on the energy efficiency of systems in a market with a defined set of characteristics (i.e. base case efficiency scenarios), the creation of a list of common energy efficiency measures for steam sys-tems, and the energy savings and implementation costs associated with these measures. A Delphi-type analysis method was used in which several cycles of input, analyses and reviews were performed to better define these inputs into the resulting steam system energy efficiency cost curve. Details concerning this expert input are provided in section 1.1.
Figure V. Schematic diagram of the methodology used for this study
Steam system energy efficiency cost curve (section 4)
Steam system energy efficiency cost curve construction
(section 3.3)
Calculation of preliminary cost ofconserved energy used for the ranking of the measures for calculating the cumulative annual input fuel saving
Calculation of the fuel savings taking into account the interaction between
efficiency measures
Calculation of final cost of conserved energy used in the steam system
efficiency cost curve
Data preparation and assumptions (section 3.2)
Steam system energy use by subsector Consolidate experts’ data Assumptions for discount rates, energy prices, etc.
Expert input (section 3.1)
Estimates of the system efficiency for 3 base case efficiency scenarios
(LOW-MEDIUM-HIGH)
Estimates of typical percentage improvement in energy efficiency over
current system efficiency practice for each energy efficiency measure
Estimates of typical capital cost, share of the labour cost from capital
costs, and useful lifetime for each efficiency measure
Data collection (section 3.1)
11 ■
1.1 Data collection
Data were collected from experts using a questionnaire that solicited their expert judgment related to industrial steam systems efficiency levels of three base case efficiency scenarios and the efficiency improvement measures that could be implemented in each scenario.
1.1.1 Base case system efficiency scenarios
Three base case efficiency scenarios (LOW-MEDIUM-HIGH) for industrial steam systems were established based on previous research and expert opinion. The first step in establishing a base case was to create a unique list of system energy efficiency practices representative of each of the three efficiency scenarios for steam systems. The initial lists were created by the authors and then circulated to the experts for further review and revision. Tables 2-4 provide the list of practices defined for each base case efficiency level.
The efficiency of the steam system was defined as:
Steam system efficiency = (Energy delivered by the steam system)(Fuel energy input to the system)
(Eq. 1)
The experts were asked to review the list of proposed energy efficiency practices for each of the three efficiency scenarios (LOW-MEDIUM-HIGH) and to either approve or make recommendations to improve the groupings provided. The experts were then asked to provide a low to high esti-mated range of the system energy efficiency (expressed as a percentage) they would expect to see when auditing a system in an industrial plant with the characteristics given for each effi-ciency scenario. A range of effieffi-ciency was requested, rather than a single value to better align with the variations that are likely to be found in industrial settings. There was a good degree of agreement among the experts concerning the range of efficiency that could be expected from these base case scenarios.
After defining the base cases, a “base case” value was assigned to the country of study, i.e. China, for the purpose of providing a reference point for the current industrial steam system per-formance in China, based on available information. While it is important to acknowledge that this approach blurs the real variations that may exist in system performance from one plant to another or from one industrial sector to another within China, it is consistent with the level of precision possible with the available data and with the purpose of the analysis. The purpose is the estima-tion of energy efficiency improvement potential in industrial steam systems and the associated cost of such improvement by the implementation of a list of measures and technologies identi-fied in this study.
Table 2. Characteristics of LOW efficiency base case scenarios for steam systems GENERATION
1 No combustion gas oxygen monitoring, air-fuel control is simple, and no periodic tuning events occur 2 In solid fuel and oilfired boilers (fuels that present combustion-side fouling), sootblowing is
accomplished on an irregular basis
3 No flue gas heat recovery equipment (feedwater economizer and/or combustion air preheater) is installed on the boiler resulting in elevated flue gas temperature
4 In coal-fired boilers, unburned carbon in ash (commonly known as loss on ignition (LOI)) is not monitored regularly and is managed poorly
■ 12
■ Energy Efficiency Potentials in Industrial Steam Systems in China
5 No heat recovery from boiler blowdown (and feedwater quality is poor to moderate) DISTRIBUTION
6 Steam leaks are seldom investigated and repaired
7 Significant amount of damaged, poor, or no insulation of steam piping, valves, fittings and vessels 8 Steam traps are fixed on a very irregular basis without maintenance programmes
RECOVERY
9 Poor or no condensate recovery 10 Flash-steam is not recovered
Note: In the LOW efficiency base case, it is assumed that more than 60 per cent of the items listed in the table are in poor condition as noted in table 2.
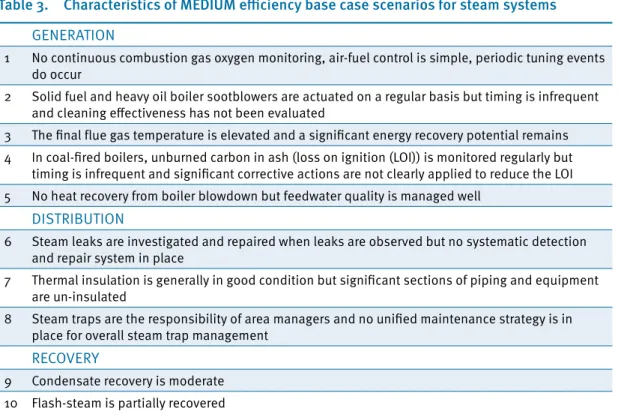
Table 3. Characteristics of MEDIUM efficiency base case scenarios for steam systems GENERATION
1 No continuous combustion gas oxygen monitoring, air-fuel control is simple, periodic tuning events do occur
2 Solid fuel and heavy oil boiler sootblowers are actuated on a regular basis but timing is infrequent and cleaning effectiveness has not been evaluated
3 The final flue gas temperature is elevated and a significant energy recovery potential remains 4 In coal-fired boilers, unburned carbon in ash (loss on ignition (LOI)) is monitored regularly but
timing is infrequent and significant corrective actions are not clearly applied to reduce the LOI 5 No heat recovery from boiler blowdown but feedwater quality is managed well
DISTRIBUTION
6 Steam leaks are investigated and repaired when leaks are observed but no systematic detection and repair system in place
7 Thermal insulation is generally in good condition but significant sections of piping and equipment are un-insulated
8 Steam traps are the responsibility of area managers and no unified maintenance strategy is in place for overall steam trap management
RECOVERY
9 Condensate recovery is moderate 10 Flash-steam is partially recovered
Table 4. Characteristics of HIGH efficiency base case scenarios for steam systems GENERATION
1 Continuous combustion gas oxygen monitoring and automatic-continuous air-fuel trim control is in place with appropriate oxygen and combustibles targets
2 Solid fuel and heavy liquid fuel boilers utilize sootblowing on a regular basis and flue gas tempera-ture impacts are evaluated to ensure effectiveness
3 Flue gas thermal energy is effectively recovered to the lowest practical values
4 In coal-fired boilers, unburned carbon in ash (loss on ignition (LOI)) is monitored regularly and frequently and corrective actions are applied to reduce LOI
5 Boiler water quality is maintained to appropriate standards and blowdown thermal energy is effectively recovered
13 ■
DISTRIBUTION
6 Steam leaks are regularly investigated and repaired with a systematic detection and repair system in place
7 Steam piping, valves, fittings, vessels and equipment are properly insulated 8 Steam traps are fixed on regular basis with a systematic maintenance programme
RECOVERY
9 High level of condensate recovery 10 High level of flash-steam is recovered
1.1.2 Determining the impact of energy efficiency measures
In order to determine the impact of the energy efficiency measures, a list of potential measures to improve steam system energy efficiency was developed and sent to the experts for review. Experts were asked to provide their opinion on the energy savings likely to result from the imple-mentation of each measure, taken as an independent action, expressed as a percentage improve-ment over each of the LOW-MED-HIGH base cases. The experts provided a percentage improveimprove-ment for each measure over the base case scenarios using a 0-100 per cent scale. For example, if an energy efficiency measure improves the efficiency by 10 per cent in a steam system operating with 60 per cent efficiency, the new system would have 66 per cent efficiency. The percentage efficiency improvement by the implementation of each measure over the LOW base case will be greater than that of the MEDIUM base case, which will in turn be greater than the value given for the HIGH base case. For example, since the LOW base case is defined as having no installed flue gas heat recovery equipment (item 3 in table 2), the percentage improvement from installation of flue gas thermal energy recovery technologies (i.e. economizer and/or air heater) would be expected to be greater than that of the HIGH base case, for which flue gas thermal energy is effec-tively recovered to the lowest practical values (item 3 in table 4). The experts were also asked to evaluate the list of measures. Based on the responses received, some adjustments were made to the list of measures, requiring a second round of review to validate the percentage efficiency improvement values. The final list of measures is comprised of nine energy efficiency measures and technologies (see table 6).
The experts were also asked to provide cost information for each measure when the measure is implemented over the LOW efficiency base case, disaggregated by steam system size range. As the system becomes more efficient, the energy saving potential of each efficiency measure decreases. In other words, the extent of the application of energy efficiency decreases (for exam-ple, shorter pipe length requires insulation); hence, the cost of implementation of each measure will decrease when they are implemented over the MED and HIGH base case efficiency. Therefore, experts were asked to provide an estimate of “how much the cost of each efficiency measure will decrease (as a percentage) if implemented over the MED and HIGH efficiency base cases com-pared to the costs that are given for implementation of measures over LOW efficiency base case”. These shares were applied to the given cost data before using them for the MED and HIGH efficiency base case.
The steam system size ranges were selected based on categories developed for the characteriza-tion of the United States industrial/commercial boiler populacharacteriza-tion, which is one of the most detailed studies available (Energy and Environmental Analysis, 2005). For the purpose of this study, the term “steam system size” refers to the aggregate boilers steam generation capacity (ton per hour (t/h)) for the system.
In addition to the energy efficiency improvement and cost, the experts were also asked to provide the useful lifetime of the measures. Finally, the experts were asked to indicate the share of labour
■ 14
■ Energy Efficiency Potentials in Industrial Steam Systems in China
cost from the typical installed cost provided by experts for each energy efficiency measure. This share was used to adjust the typical cost given by two of experts whose cost data were based on experiences in the United States This adjustment was necessary because there is a large gap between labour costs in the United States and China.
A manufacturing labour cost of US$36/h was assumed in the United States based on U.S. BLS (2012) and US$3/h in China based on Deloitte (2013). Because of limited available data, materi-als/equipment costs were not adjusted and were assumed to be equivalent across all countries studied. The materials/equipment costs can vary from country to country. These variations in cost would benefit from further study.
Initially, two additional energy efficiency measures were on the list of system optimization meas-ures. These two measures were (a) pressure reducing valve optimization in backpressure steam turbines and (b) condensing turbine optimization. These two measures were removed from the final list of the efficiency measures used in the analysis primarily for two reasons. First, a large number of industrial facilities in China operate without combined heat and power components. Second, the presence of steam turbines operating in a combined heat and power arrangement greatly complicates the analysis and the results. Unlike simple steam systems where only steam is produced, the outputs of cogeneration systems to which the two aforementioned turbine-related measures are applicable are both steam and electricity. The unit cost of fuel and electric-ity dramatically affect the analysis decisions. Hence, the cogeneration system optimization should be viewed and analysed taking both of the outputs into account and not only steam. This was beyond the scope of this analysis. In addition, there is a lack of information and data on the potential application of these two turbine-related measures in Chinese industry. It should be noted that many large Chinese industrial facilities have combined heat and power plants. It should also be noted that one of the best ways to improve the energy efficiency in industry and of a steam system is through a cogeneration or combined heat and power system (CHP) in which the system produces both steam and electricity (IEA, 2007; U.S. DOE/AMO, 2014). However, because of the complexities mentioned above, the addition of new cogeneration/CHP compo-nents was not included in this analysis. The adoption of these two measures and some other steam system energy efficiency measures and technologies that are not included in this analy-sis has the potential to increase the energy saving potential above what is calculated in this analysis.
For typical capital costs of each efficiency measure, the authors aimed to identify rough esti-mates given the scope of the analysis. There were five categories based on steam system size ranges for which an estimate of the implementation cost of the measure in United States dollars was sought. The actual installed cost of some efficiency measures can be highly variable and dependent on country-specific and plant-specific conditions, such as the number and type of steam end uses. The need to add or modify physical space to accommodate new equipment can also be a factor. Finally, in developing countries, the cost of imported equipment, especially energy- efficient equipment, can be higher due to scarcity, shipping and/or import fees.
This report uses the estimated full cost of the measures analysed rather than the incremental cost for energy-efficient measures. This was driven by the goal of the analysis, which is to assess the total potential for energy efficiency in existing industrial steam systems in the base year assuming a 100 per cent penetration rate. Therefore, energy savings are based on the assump-tion that all the measures are installed in the base year to determine how much energy saving potential exists in that year. In this case, the full cost of the measures should be applied since the existing systems are not all at the end of their lifetime. However, for other types of studies, such as energy efficiency cost curves used to develop future scenarios, the incremental cost (the dif-ference between the cost of an energy-efficient technology and conventional technology) can be
15 ■
used, since new stock can be installed at the end of the lifetime of the existing ones in the future years. Table 6 in section 1.2 below includes the consolidated expert input for energy efficiency improvement measures.
1.2 Data preparation and assumptions
1.2.1 Expert input consolidation
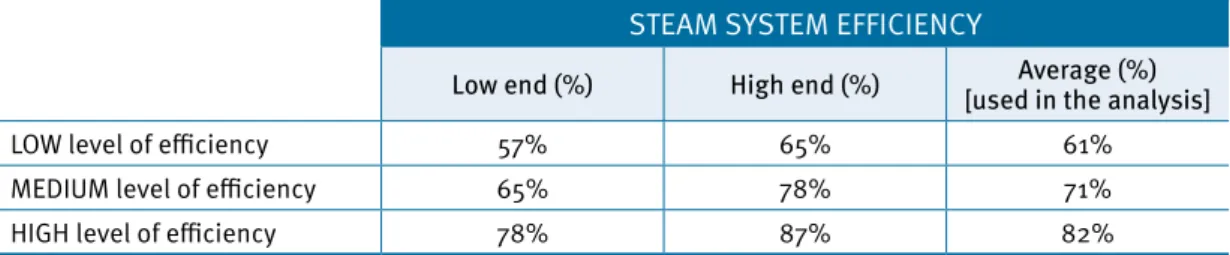
The experts were asked to assign system efficiency, expressed as a range, for the LOW-MED-HIGH efficiency base cases. Table 5 contains the consolidated results, including the base case values used in developing the energy efficiency cost curve model. There was a high degree of agreement among the experts regarding the range of steam system energy efficiency that would be expected to result from the list of characteristics assigned to the three base cases. As can be seen, the average values (average of low and high values) for the LOW-MED-HIGH efficiency base case were used.
Table 5. Consolidated steam system efficiency for LOW-MED-HIGH efficiency base case STEAM SYSTEM EFFICIENCY
Low end (%) High end (%) [used in the analysis]Average (%)
LOW level of efficiency 57% 65% 61%
MEDIUM level of efficiency 65% 78% 71%
HIGH level of efficiency 78% 87% 82%
After defining the base case efficiencies for steam systems, China was determined to currently fall into the LOW “base case” for the industrial steam system efficiency performance based on the information available and expert judgment. This despite the fact there are perhaps many plants in China with steam system efficiency equal to MED or even HIGH base case efficiency. Thus, the results of this study in nature encompass this generalization of the Chinese industry. Table 6 shows the consolidated experts input data for the typical percentage improvement in efficiency over each base case efficiency (LOW-MED-HIGH), the lifetime of measures, as well as an estimated typical implementation cost of the measure, differentiated by system size.
1.2.2 Steam systems energy use by industry subsector
The base year for this analysis is 2012 since this is the most recent year for which energy use data are available in China.
Calculating the fuel saving potential requires information on fuel use by industrial steam systems in China.8 In Chinese statistics, only the fuel use is reported for each industrial sector and it is not disaggregated by the end use (e.g. steam systems, process heating systems, etc.). Therefore, the fuel use of industrial steam systems in China was estimated using a subsector level calculation as follows. In the United States, the Manufacturing Energy Consumption Survey (MECS) published by the Energy Information Administration of the Department of Energy (U.S. DOE/EIA) publishes energy use in manufacturing subsectors by end use.
■ 16 ■ Ener gy Effic iency P ot enti als in Indu str ia l St eam Sy stem s in Chin a
Table 6. Energy efficiency measures, percentage efficiency improvement, lifetime, and cost-consolidated experts input
aThe installed cost data in the table are rounded to the nearest US$100.
bMeasures 1.1 to 1.3 are all for excess air management. It is assumed that measure 1.1 is applicable to the LOW efficiency base case, measure 1.2 to the MED efficiency base case, and measure 1.3 to the HIGH efficiency base case.
cFor measures 1.2 and 1.3, based on the above note, cost data are for when the measure is implemented over the MED and HIGH efficiency base case, respectively. No. Energy efficiency measure
Typical % improvement in energy efficiency over current system
efficiency practice Typical life of measure
(years)
Typical installed cost in China by system size when the measure is implemented over LOW efficiency base case
(US$) a The decrease in typical installed cost when implemented over MED base case (%) The decrease in typical installed cost when implemented over HIGH base case (%) % Improvement
over LOW eff.
base case
% Improvement
over MED eff.
base case
% Improvement
over HIGH eff.
base case <4 t/h 4 - 19 t/h 19 - 38 t/h 38 - 94 t/h > 94 t/h
1.1.b Excess air management: Tune existing positioning
control (or simple control)
5.0% 0.5 200 300 300 400 500 N/A N/A
1.2.b Excess air management: Upgrade from simple control
to standard oxygen trimb
1.5% 10 17,600 24,900 43,000 67,900 86,000 N/A N/A
1.3.b
Excess air management: Upgrade from standard oxygen trim to oxygen trim with CO tuningc
0.5% 10 26,300 26,300 44,400 67,900 86,000 N/A N/A
2 Flue gas thermal energy recovery (Economizer and/or air heater)
7.4% 4.4% 1.0% 16 72,500 145,000 290,000 870,000 1,160,000 20 40
3 Sootblower optimization 3.5% 1.1% 0.5% 12 1,800 13,700 32,500 54,600 76,700 40 40
4 Loss on ignition (LOI)
optimization 5.0% 3.0% 1.0% 10 72,500 72,500 181,300 290,000 507,500 50 50
5 Optimization of boiler blowdown and recovery of heat from boiler blowdown
2.8% 1.5% 0.4% 12 14,500 23,800 36,600 67,300 70,600 22 25
6 Optimization of insulation of steam piping, valves, fittings and vessels
5.0% 2.0% 0.5% 10 15,600 39,600 87,700 214,600 300,800 60 60
7 Implementation of an effective steam trap mainte-nance programme
2.2% 1.1% 0.4% 7 8,100 17,600 44,000 94,700 143,400 40 60
8 Optimization of condensate
recovery 4.1% 1.9% 0.4% 12 24,900 53,000 113,900 248,800 347,200 40 60
17 ■
The 2010, United States manufacturing energy use data from the U.S. DOE/EIA (2013a) was used to calculate the share of steam system fuel use in total fuel use in each manufacturing subsector listed in table 7. Then, the calculated shares were applied to the fuel use data in each industrial subsector in China in 2012 (NBS 2013) to estimate the fuel use by industrial steam systems in each industrial subsector in China in 2012. Table 7 shows that the total fuel used in Chinese industrial steam systems in 2012 was 8,850 petajoules (PJ). Since this study focuses on coal-fired steam systems, which account for 80-85 per cent of the industrial boiler capacity in China (Dai and Xiong, 2013), there is a need to further calculate the fuel used in the coal-fired steam systems. Assuming that coal-fired steam systems account for 82.5 per cent of total industrial boilers in China, the total fuel used in coal-fired industrial steam systems in China in 2012 is estimated to be 7,301 PJ.
Although it should be noted that the structure within industrial subsectors might vary between China and the United States, this calculation is done at the subsector level in order to make the best estimate possible given available data. Once China starts to report energy use by end use for the industrial sector, these values can be refined.
Table 7. Total fuel use and steam system fuel use in Chinese industry by subsector in 2012
No. Industry subsector in 2012 (TJ)Fuel use a
Estimated steam system fuel use as % of overall fuel use
in the sector in 2012 (%)b Calculated steam system fuel use in 2012 (TJ)
1 Food, beverage and tobacco 825,115 63% 522,960
2 Textile, apparel, chemical fibres, leather, fur 758,400 57% 429,283
3 Timber, wood, bamboo, etc. 94,215 15% 14,132
4 Furniture 15,926 7% 1,138
5 Paper and paper products 573,659 72% 411,519
6 Printing and publishing 42,318 20% 8,464
7 Petroleum refining and coking 3,486,947 32% 1,116,803
8 Raw chemical materials and chemical products 7,072,038 60% 4,209,379
9 Medicines 226,891 29% 66,733
10 Rubber and plastics 192,297 43% 82,670
11 Non-metallic mineral products 6,014,876 2% 128,224
12 Smelting and pressing of ferrous metals 13,765,300 11% 1,537,486
13 Smelting and pressing of non-ferrous metals 803,544 11% 89,750
14 Metal products 175,762 12% 21,585
15 Machinery 536,515 8% 42,356
16 Transport equipment 383,309 25% 97,216
17 Electric and electronic equipment 187,865 25% 46,966
18 Other industries 79,738 29% 23,452
Total 35,234,715 8,850,115
a Source: NBS (2013);
■ 18
■ Energy Efficiency Potentials in Industrial Steam Systems in China
As can be seen from table 7, the top five steam consumers in Chinese industry by subsector (and their share from total industrial steam systems fuel use) are: raw chemical materials and chemi-cal products (48 per cent), smelting and pressing of ferrous metals (17 per cent), petroleum refin-ing and cokrefin-ing (13 per cent), food, beverage and tobacco (6 per cent), and the textile, apparel, chemical fibres, leather, fur industry (5 per cent).
1.3 Construction of a steam systems energy efficiency cost curve
Figure VI shows a schematic of the calculation process for the construction of a steam system energy efficiency cost curve. The details of each step are explained in next subsections.Figure VI. Schematic diagram of the calculation process for construction of a steam systems energy efficiency cost curve
1.3.1 Introduction to the energy efficiency cost curve
The energy efficiency cost curve is an analytical tool that captures both the engineering and eco-nomic perspectives of energy conservation. The curve shows the energy conservation potential as a function of the marginal cost of conserved energy (CCE). The CCE can be calculated from equation 2.
CCE = (Annualized capital cost + Annual change in O&M costs)(Annual energy savings)
(Eq. 2)
The annualized capital cost can be calculated from equation 3. Annualized capital cost = Capital cost * d
1-(1+d)-n (Eq. 3)
d: discount rate, n: lifetime of the energy efficiency measure
After calculating the CCE for all energy efficiency measures, the measures are ranked in ascend-ing order of CCE. In an energy efficiency cost curve, a unit price of energy line is determined. All measures that fall below the energy price line are identified as “cost-effective”. That is, saving a
Calculation of the annual energy savings
Refinedcalculation of the annual energy savings
Calculation of the preliminaryCCE
Calculation of the final CCE Refined Refined For ranking Formula used in calculation Steam system efficiency cost curve X-axis
Y-axis
Measures treated in isolation Additive effect is taken into account
Formula used in calculation
19 ■
unit of energy through the adoption of the cost-effective measures is less expensive than buying a unit of energy. On the curves, the width of each measure (plotted on the x-axis) represents the annual energy saved by that measure. The height (plotted on the y-axis) shows the measure’s cost of conserved energy.
The energy efficiency cost curve provides the CCE, annualized cost of energy efficiency measures, annualized energy cost saving, annualized net cost saving, and annualized energy saving by each individual technology or a group of technologies. If dE is the energy saving potential by a technology, then the annualized cost of energy efficiency measure, the annualized energy cost saving, and the annualized net cost saving of that technology can be calculated from:
AC = dE * CCE (Eq. 4) AECS = dE * P (Eq. 5) ANC = AC - AECS = dE * (P-CCE) (Eq. 6) Where:
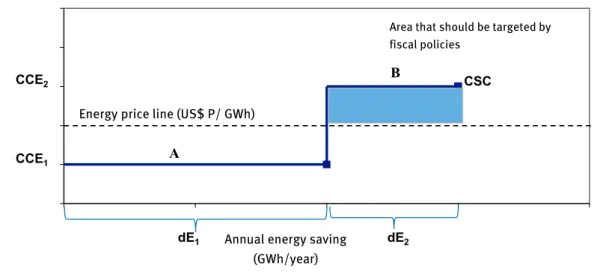
AC: Annualized cost of energy efficiency measure (US$), AECS: Annualized energy cost saving (US$), ANC: Annualized net cost saving (US$), P: Energy price, and dE: Energy saving in CSC. Figure VII shows a schematic of an energy efficiency cost curve that helps the visualization of this discussion.
Figure VII. Schematic view of an energy efficiency cost curve
For the cost-effective energy efficiency measures in the energy efficiency cost curve, the annual net cost saving is positive, but for the measures whose CCE is above the energy cost line, the annualized net cost saving is negative. That is, for cost-effective measures, net annual revenue results from implementing those measures from the net energy cost saving, whereas for non-cost effective measures the annualized cost of implementing the measures is higher than the annual-ized cost saving. Thus, the annual net cost saving for non-cost effective measures is negative. However, it should be emphasized that even in the case of non-cost effective measures, the significant cost saving occurs from energy saving which is equal to dE*P as mentioned above.
Co st o f c on serv ed en erg y ( U S$ /G W h)
Annual energy saving (GWh/year) Energy price line (US$ P/ GWh)
A B CSC dE1 CCE2 CCE1 dE2
Area that should be targeted by the fiscal policies
■ 20
■ Energy Efficiency Potentials in Industrial Steam Systems in China
Therefore, from an energy policy point of view, any fiscal policy for non-cost effective energy effi-ciency measures should target the annualized net cost saving of the measure which is the area between the energy efficiency cost curve and the energy price line. For measure A which is cost-effective, the annual net cost saving is positive, whereas for measure B which is non-cost effec-tive the annual net cost saving is negaeffec-tive. For measure B, the area between energy price line and curve should be targeted by fiscal policies.
1.3.2 Discount rate
The discount rate refers to the interest rate at which the future values associated with a project are discounted to the present value, taking into account the time value of money. Similarly, it is also used to annualize the cost into the future years for a lifetime of a project or technology. In this study, a real discount rate of 15 per cent was assumed for the analysis. However, since it is one of the key variables used in the cost of conserved energy calculation, a sensitivity analysis of the final results with varying discount rates is presented in section 2.2. It should be noted that the choice of the discount rate also depends on the purpose of the analysis and the approach (prescriptive versus descriptive) used. A prescriptive approach (also called social perspective) uses lower discount rates (4-10 per cent), especially for long-term issues such as climate change or public sector projects (Worrell et al. 2004). Low discount rates have the advantage of treating future generations equally to the current generation, but they also may cause relatively certain, near-term effects to be ignored in favour of more uncertain, long-term effects.
A descriptive approach (also called private-sector or industry perspective), uses relatively high discount rates between 10 and 30 per cent in order to reflect the existence of barriers to energy efficiency investments (Worrell et al. 2004). These barriers include perceived risk, lack of infor-mation, management concerns about production and other issues, capital constraints, opportu-nity cost, and preferences for short payback periods and high internal rates of return (Bernstein, et al. 2007 and Worrell, et al. 2000). As a result, the 15 per cent discount rate used for these analyses is slightly higher than the high end of discount rates used from a social perspective and close to the lower end of the discount rates used from a private-sector or industry perspective. The sensitivity analysis of the results with respect to the discount rate will show how the move-ment towards each of these two perspectives will influence the results. In addition, since the energy efficiency measures for the steam systems are cross-cutting technologies/measures, the selection of a discount rate is further influenced by the assumption of fewer barriers to the imple-mentation of these measures compared to process-specific, capital-intensive technologies in each industrial sector (i.e. the installation of an efficient grinding mill or a kiln system in the cement industry). Thus, the lower discount rate used for these cross-cutting measures is consist-ent with a private-sector or industry perspective.
1.3.3 Annual fuel saving potential calculation method
For the calculation of annual fuel savings achieved by the implementation of each energy effi-ciency measure in an industrial steam system, the following inputs were available:
(a) Base case efficiency for industrial steam systems in China (as previously described, we assigned LOW base case efficiency for industrial steam systems in China, based on the authors’ judgment and expert consultation).
(b) For each energy efficiency measure, the experts provided a typical percentage improvement in steam system energy efficiency over the base case efficiency.
(c) Fuel use in coal-fired industrial steam systems in China in 2012 (calculated as explained in section 1.2.2).
21 ■
From this information, the annual fuel saving from the implementation of each individual energy efficiency measure, where measures are treated individually and can be implemented in isola-tion regardless of the implementaisola-tion of other measures, can be calculated following the steps given below:
1. Annual input energy for coal-fired industrial steam systems in 2012 (TJ/yr) = Industrial coal-fired steam systems fuel use in China in 2012
2. Annual useful energy used in coal-fired industrial steam systems with base case effi-ciency (TJ/yr) = [Annual input energy for coal-fired industrial steam systems in 2012 (TJ/yr)] * [Base case efficiency of coal-fired industrial steam systems in China in 2012] 3. New system efficiency after the implementation of an energy efficiency measure = [Base
case efficiency of steam systems] * [1+ % system efficiency improvement by the imple-mentation of the efficiency measure]
4. Annual useful energy used in the coal-fired industrial steam systems with new efficiency (TJ/yr) = [Annual input energy for coal-fired industrial steam systems in 2012 (TJ/yr)] * [New system efficiency]
5. Annual useful energy saving = [Annual useful energy used in industrial steam systems with base case efficiency (TJ/yr)] - [Annual useful energy used in industrial steam systems with new system efficiency (TJ/yr)]
6. Annual input energy saving in coal-fired industrial steam systems in 2012 (TJ/yr) = [Annual useful energy saving (TJ/yr)] / [New system efficiency after the implementation of the energy efficiency measure]
In the procedure explained above, input energy use is the fuel that is supplied to the steam sys-tem (boiler) as input. In this study, this is equal to the total fuel used in coal-fired industrial steam systems in China in 2012 (7,301 PJ) calculated in section 1.2.2. The useful energy use, however, is the energy that is converted to the actual service through the system. The useful energy is the energy that is provided by steam at the end use. Therefore, the useful energy use is calculated by taking into account the steam system efficiency and multiplying that by the input energy use. Since the system efficiency is always lower than 100 per cent, the useful energy use is always less than the input energy use.
In practice, the implementation of one measure can influence the efficiency gain by the next measure implemented. When one measure is implemented the base case efficiency is improved. Therefore, the efficiency improvement by the second measure will be less than if the second measure was implemented first or was considered alone. Hence, the measures could not be treated as isolated actions. To overcome this problem, the aforementioned equations were refined so that the measures were treated in relation to each other (as a group). In other words, the efficiency improvement by the implementation of one measure depends on the efficiency improvement achieved by the previous measures implemented. The refined method used is shown below. A numerical example of this calculation is also presented in box 1.
■ 22
■ Energy Efficiency Potentials in Industrial Steam Systems in China
In this method, the cumulative annual energy saving is calculated by taking into account the additive effect of the measures rather than treating the measures completely in isolation from each other. For instance, when calculating the cumulative annual energy saving achieved by the implementation of measure 3 and all the previous measures (measures 1 and 2), the sum of the percentage efficiency improvement by the implementation of measures 1, 2, and 3 is used in the above calculation.
1. Annual input energy for coal-fired industrial steam systems in 2012 (TJ/yr) = Industrial coal-fired steam systems fuel use in China in 2012
2. Annual useful energy used in coal-fired industrial steam systems with Base case effi-ciency (TJ/yr) = [Annual input energy for coal-fired industrial steam systems in 2012 (TJ/yr)] * [Base case efficiency of coal-fired industrial steam systems in China in 2012] 3. Cumulative new system efficiency after the implementation of an energy efficiency
measure = [Base case efficiency of steam systems] * [1+ Sum of the % efficiency improve-ment by the impleimprove-mentation of the measure and all the previous measures impleimprove-mented] 4. Annual useful energy used in the coal-fired industrial steam systems with new efficiency
(TJ/yr) = [Annual input energy for coal-fired industrial steam systems in 2012 (TJ/yr)] * [Cumulative new system efficiency]
5. Cumulative annual useful energy saving = [Annual useful energy used in industrial steam systems with base case efficiency (TJ/yr)] - [Annual useful energy used in indus-trial steam systems with new efficiency (TJ/yr)]
6. Cumulative annual input energy saving in coal-fired industrial steam systems in 2012 (TJ/yr) = [Cumulative annual useful energy saving (TJ/yr)] / [Cumulative new system efficiency after the implementation of the efficiency measure]
Box 1. Example of the calculation of energy saving and final cost of conserved energy (CCE)
The cumulative annual input energy saving from the implementation of energy efficiency measure #1 (Excess air management: Tune existing positioning control) and #2 (Sootblower optimization) on the curve, where measures are treated in relation with each other, can be calculated as follows:
1. Annual input energy for coal-fired industrial steam systems in 2012 (PJ/yr) = 7,301 2. Annual useful energy used in industrial steam systems with base case efficiency
(PJ/yr) = 7,301 * 0.61 = 4,454
3. Cumulative new system efficiency after the implementation of measure #1 and #2 = 0.61* [1+ 0.085] = 0.662
4. Annual useful energy used in the industrial steam systems with new efficiency (PJ/yr) = 7,301 * 0.662 = 4,832
5. Cumulative annual useful energy saving with measure #1 and #2 (PJ/yr) = 4,454 – 4,832 = 379
6. Cumulative annual input energy saving with measure #1 and #2 in 2012 (PJ/yr) = 379/ 0.662 = 574