Hermes: Clustering Users in Large-Scale E-mail Services
Thomas Karagiannis, Christos Gkantsidis, Dushyanth Narayanan, Antony Rowstron
Microsoft Research Cambridge, UK
{thomkar, chrisgk, dnarayan, antr}@microsoft.com
Abstract
Hermes is an optimization engine for large-scale enterprise e-mail services. Such services could be hosted by a virtual-ized e-mail service provider, or by dedicated enterprise data centers. In both cases we observe that the pattern of e-mails between employees of an enterprise forms an implicit social graph. Hermes tracks this implicit social graph, periodi-cally identifies clusters of strongly connected users within the graph, and co-locates such users on the same server. Co-locating the users reduces storage requirements: senders and recipients who reside on the same server can share a sin-gle copy of an e-mail. Co-location also reduces inter-server bandwidth usage.
We evaluate Hermes using a trace of all e-mails within a major corporation over a five month period. The e-mail service supports over 120,000 users on 68 servers. Our eval-uation shows that using Hermes results in storage savings of 37% and bandwidth savings of 50% compared to current ap-proaches. The overheads are low: a single commodity server can run the optimization for the entire system.
Categories and Subject Descriptors
D.4.2 [Storage Management]:General Terms
Management, Measurement, Performance
1.
INTRODUCTION
Enterprise-scale e-mail systems are large distributed ser-vices. To support organizations with 50,000+ users, mul-tiple servers are required with 100’s of terabytes of com-bined backing storage, often distributed across multiple data centers. In general, two metrics control the storage provi-sioning of these systems: per-user storage quotas, and the expected rate of per-user I/O operations (IOP). As many users have smaller mailboxes than the allocated quota, and over-provisioning of storage is expensive, many enterprises
Permission to make digital or hard copies of all or part of this work for personal or classroom use is granted without fee provided that copies are not made or distributed for profit or commercial advantage and that copies bear this notice and the full citation on the first page. To copy otherwise, to republish, to post on servers or to redistribute to lists, requires prior specific permission and/or a fee.
SoCC’10,June 10–11, 2010, Indianapolis, Indiana, USA. Copyright 2010 ACM 978-1-4503-0036-0/10/06 ...$10.00.
rely on statistical multiplexing of user mailboxes and under-provision storage. For example, a sample large corporation has a per-user quota of 10 GB but only provisions 4.3 GB per user, less than half the quota [10]. The statistical mul-tiplexing, and hence the “overcommit ratio” is even larger for hosted e-mail services which multiplex many enterprise customers onto a single physical infrastructure.
In most deployments, user mailboxes are assigned to servers greedily, by choosing the server with the lowest storage uti-lization. If a server’s storage utilization exceeds a threshold, mailboxes are migrated to balance the storage load. Peri-odically, as all the servers become storage capacity bound, a new server is added [10]. Hence, a key challenge for such e-mail services is to improve the ratio between the provided quota and the actual storage dimensioned per mailbox. This is a challenge both for enterprise e-mail services running on dedicated hardware, as well as for virtualized hosted e-mail services shared by multiple enterprises.
We propose Hermes, a system that optimizes the storage requirements of large-scale enterprise e-mail services. Her-mes exploits the properties of the underlying social graph, capturing the patterns of user communications within an enterprise, with the aim of identifying clusters of strongly connected users. The assumption is that users in the same cluster receive many of the same e-mails. Thus, co-locating these clustered users on the same storage server allows the servers to coalesce e-mail storage, using techniques similar to Single Instance Storage [3]. A single copy of an e-mail is stored at most once per server, even if multiple mailboxes stored on the server received copies of that e-mail. This provides benefit even for e-mails with a single recipient, as usually the sender also stores a copy of the e-mail in the “Sent Items” folder of their mailbox. Enabling storage coa-lescing by clustering the users, reduces the storage required to support the same user quota requirements. As a sec-ondary benefit, it reduces the inter-server bandwidth used to deliver e-mails between users.
The storage and bandwidth savings achieved by Hermes are based on intra-domain clustering of users, i.e., users within a single administrative domain. Virtualized (“cloud”) e-mail services such as Hosted Exchange can simultaneously host many such domains on the same physical resources. However, there are likely to be policy and administrative barriers to maintaining social graphs across domains. Our analysis in this paper also shows that inter-domain clus-tering is likely to provide limited additional benefits com-pared to intra-domain clustering. Thus we believe that
inter-domain clustering will be the preferred approach for hosted e-mail as well as stand-alone server deployments.
There has been significant effort in studying the proper-ties of social networking applications and their associated social graphs [4, 5, 6, 18, 21, 23]. Social networks can be expressed as a graph, where the vertices represent users and the edges represent relationships between the users. The edges can encode simple relationships between users, or can be weighted or annotated to capture more complex relation-ships. A key property of these graphs is that some edges have large weights compared to the average edge weight, capturing the fact that user relationships are clustered. This is known as the “strong-ties” relationships between users [24]. In many applications, the social graph is explicit and di-rectly used to provide functionality (e.g., Facebook or LinkedIn web sites). Applications like e-mail, on the other hand, de-fine an implicit social graph; the core functionality is not dependent on maintaining or using a social graph. For ex-ample, in the case of e-mail, two users are related if one sends e-mail to the other, with the amount of e-mail capturing the strength of the relationship [12, 15, 16].
Hermes creates and maintains a social graph encoding the relationship between users in terms of e-mail message ex-changes. This requires information about every e-mail sent or received by a user of the e-mail service; this information is available from standard logging services built into today’s e-mail servers. Hermes then uses a graph partitioning al-gorithm to determine groups of user mailboxes that should be co-located. This partitioning process takes into account the cost of migrating users, and at the end of the process, a list of user accounts and the server they should be migrated to is generated based on a cost-benefit analysis. E-mail sys-tems provide tools to enable user mailbox migration between servers without the user observing service downtime, which are used to migrate the identified users.
This paper shows that we can use social graphs to op-timize the performance of large-scale distributed systems. We demonstrate this for enterprise-scale e-mail systems, by using the implicit social graph generated by e-mail commu-nication to enable clustered users to be co-located on the same server. We validate the approach using a five-month trace gathered from a large-scale corporate e-mail system. The trace covers 337 million e-mails sent and received by over 120,000 users. Our results demonstrate that Hermes achieves 37% savings in storage, and 50% savings in inter-server bandwidth. They also show that the e-mail social graph is stable for many weeks, and hence repartitioning needs to be done infrequently. An initial partitioning based on the first week’s data reduced the storage requirement of the original system by 37%. A second repartitioning at the end of the five-month trace period gave a further reduction of only 3%. Hermes has low overheads, and the repartition-ing algorithm can run on a srepartition-ingle commodity server.
Section 2 describes the five-month enterprise e-mail work-load trace which we use to motivate and evaluate the design of Hermes, and quantifies the potential benefits of coalescing e-mails across users. Section 3 describes the design of Her-mes, the construction and maintenance of the social graph, and the clustering algorithms used. Section 4 evaluates the performance of Hermes based on the five-month e-mail trace. It also measures the potential benefit of inter-domain clus-tering, as well as the ability of Hermes to scale to very large
social graphs. Section 5 describes related work, and finally, Section 6 concludes.
2.
MOTIVATION
The main motivation for this work is to reduce the capac-ity requirements of enterprise e-mail by using the implicit social graph defined by e-mail patterns. Hence it is impor-tant to understand the patterns of e-mail communication within a typical large enterprise. Here we describe the en-terprise e-mail trace that motivates the design and drives the evaluation of Hermes.
2.1
Enterprise e-mail workload
To evaluate Hermes, we traced all e-mails for all employ-ees for a large international corporation for 5 months (June-October 2007). During this period, we observed 337 mil-lion e-mails for 127,871 unique users whose mailboxes are hosted in the e-mail system. The users are mapped onto 68 Exchange e-mail storage servers distributed across 4 conti-nents: 32 in North America, 19 in Europe, 16 in Asia, and 1 in South America. The base storage quota per user is 2 GB. The trace covers all e-mails sent and received by employees of the corporation, and from this Hermes can infer the pat-tern of communication between employees. The user mail-boxes in this case are hosted by dedicated Exchange servers in multiple data centers worldwide. In the future, we can expect more enterprises to use cloud-based e-mail services rather than dedicated servers, to host their e-mail, for ex-ample, using Hosted Exchange. This should not change the pattern of e-mail communication between employees, and hence should not change the benefits of Hermes, which ex-ploits the intra-domain e-mail graph.
An entry is logged by each e-mail server for every e-mail sent or received by a user on the server. Thus, care needs to be taken so that multiple entries across servers are removed. The entry contains the e-mail addresses of the sender and all recipients, a timestamp and the e-mail size in bytes (in-cluding all attachments). Each e-mail has a unique message identifier generated by the server originating the message, which consists of a hash followed by the server name. It should be noted that some incoming e-mails will be dropped at the SMTP gateway server, for example, because they are junk or spam e-mails or because the mailbox for the recip-ient is no longer valid. E-mails sent to internal mailing list aliases are included in the trace, and are expanded to include all the list members.
From our traces we can infer the current user-to-server mapping. When a user sends an e-mail, the server generates the message identifier which includes the server name. For some users a small fraction of their e-mails were sourced by different servers, normally because certain e-mail access services use dedicated servers to handle sending e-mails. A few others appear to have been migrated. Hence, for the evaluation, we infer each user’s mailbox server as the one most frequently observed for the user in the trace period. We also discovered a number of servers that are used by small numbers of users. We identified 68 core servers that are part of the corporate e-mail service, with roughly 1880 users per server (other servers seen in the trace include test servers, servers for printers, servers external to the enterprise, etc.). We consider only the 68 core servers and the 127,871 users hosted on them. All other e-mail addresses observed are labeled asexternal.
Number of e-mails 337 M
Users 127,871
External addresses 17.3 M
Mean # users per e-mail 4.66
Mean #e-mails sent per user per day 9
Mean #e-mails received per user per day 71.2 Mean #e-mails per second (95thperc.) 25.6 (62)
Table 1: Properties of the collected e-mail trace.
Figure 1: E-mail storage required over time.
Table 1 summarizes the basic properties of the trace. Ob-serve that on the average 4.6 internal users are referenced in each e-mail header, either as the sender or a recipient. This implies that, in the worst case, where each user resides on a different e-mail server, each e-mail will be stored 4.6 times on the average.
2.2
Potential Benefits
We now perform a simple analysis to better understand the potential for resource savings based on user communi-cation patterns. We first examine the storage requirements. We consider the worst case scenario of no coalescing e-mails, where one copy of each e-mail is stored by the sender’s and each recipient’s mailbox, and the best case of perfect coalesc-ing, where only one copy of each e-mail exists system-wide. Figure 1 shows the storage requirements over time for these two cases.
At the end of the five month period, the storage required to store all the e-mails in the best case is approximately 25% of that in the worst case (24TB versus 96 TB). The potential savings achieved per day is approximately 0.5 TB/day. Fig-ure 2 presents a similar analysis for bandwidth requirements, based on the e-mail size (i.e., ignoring other Exchange re-lated overheads). The figure shows the Cumulative Distri-bution Function (CDF) of the current bandwidth usage esti-mated in 5-minute intervals taking into account the existing layout of user mailboxes to servers, versus an idealized sce-nario where each e-mail requires just one transfer (all recip-ients are co-located in the same server). The 95thpercentile in the idealized case is roughly 27% of the current bandwith usage. Thus, this elementary analysis highlights that co-locating and coalescing e-mails might offer significant stor-age and bandwidth benefits for the enterprise e-mail service.
Figure 2: CDF of bandwidth usage.
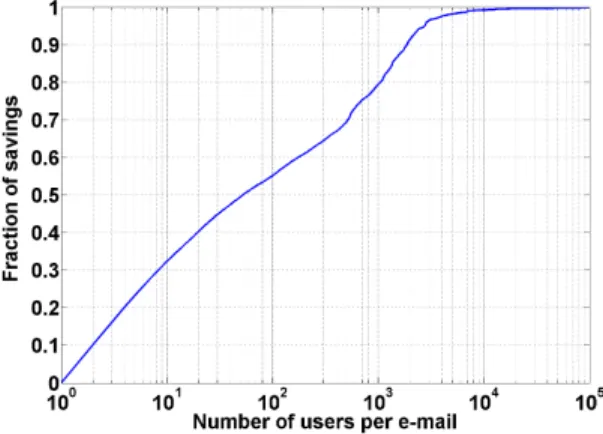
Figure 3: CDF of storage savings versus number of users per e-mail.
The worst case scenario represents many e-mail systems currently deployed, as they observe little benefit from co-alescing e-mails due to policies used for mapping users to servers. However, the best case corresponds to placing all the users on single server, which is not feasible. The po-tential savings presented in Figures 1 and 2 depend mainly on two factors: i) the number of users per e-mail, which relates to the e-mail social graph, and ii) the e-mail size. For example, for e-mails sent to very large numbers of users, e.g., mails sent to all employees, the grouping of users across servers will not perform better than random placement, as there will be one copy stored on every server in both cases. Thus, to verify that intelligent placement of users’ mailboxes may indeed provide opportunities for savings, we now ex-amine how each of these factors contributes to the observed savings.
Figure 3 shows the relationship of storage savings to the number of users per e-mail, as a cumulative distribution. The y-axis shows the fraction of the total storage savings that is represented by e-mails with less than some number of users per e-mail; thex-axis shows the number of users per e-mail in log scale. Figure 3 highlights that roughly 90% of the savings are from e-mails with fewer than 1,800 users per e-mail, which is roughly the average number of users per server in the traced system. Company-wide e-mails and other e-mails with larger user lists account for a very small
Figure 4: CDF of fraction of storage space savings achievable as a function of e-mail size.
fraction of the savings. This indicates that clustering users intelligently could achieve capacity savings.
With regards to the second factor, the e-mail size, we in-vestigate whether most of the savings could be achieved by sharing just a small number of large e-mails. If so, this im-plies that clustering might offer only minor gains. Figure 4 shows the fraction of the total storage savings in a fashion similar to Figure 3, but versus the e-mail size. The overall distribution appears uniform (in log-scale), with the benefits spread evenly across a range of 10–10,000 KBytes per e-mail. Thus, the benefit is not a result of sharing a small number of large emails. Similar observations hold for the bandwidth savings case.
To summarize, this simple trace-based analysis highlights that indeed significant storage and bandwidth savings might be achieved by co-locating and coalescing user data. Fur-ther, savings appear to be induced by user communication patterns and not by any idiosyncrasies specific to our e-mail trace, such as a large number of company-wide e-mails.
3.
HERMES DESIGN
Hermes is designed to work both with legacy e-mail sys-tems such as Exchange, as well as virtualized or cloud e-mail hosting services. In general, the requirements to use Hermes are that e-mail traffic can be tracked on a user and per-server basis; that users can be migrated from one per-server to another; and that identical e-mails in different user mail-boxes but on the same physical server can be coalesced.
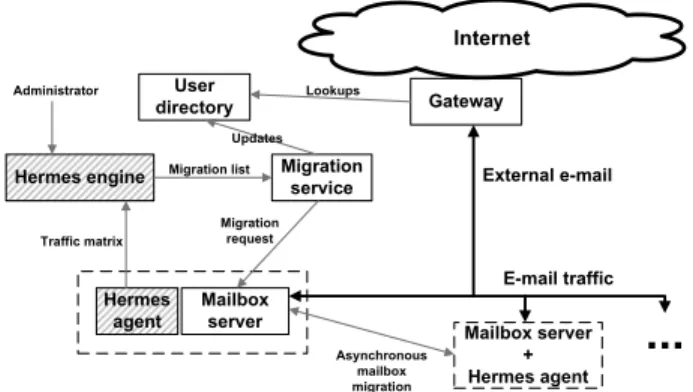
Figure 5 presents the general system model for Hermes, showing the interactions between the different components of the e-mail system. Hermes has two components: the Her-mes agent, which collects information per e-mail server, and the centralized Hermes engine. The Hermes engine aggre-gates the information collected at each server to form a single social graph covering all users of the e-mail system. Period-ically, it runs a clustering algorithm on the social graph and computes a list of users to migrate in order to increase the co-location of strongly connected users.
We now describe in detail how we infer the social graph, and in particular what information is captured in it. We then describe how the Hermes agents collect and process the
Hermes engine Mailbox server Hermes agent Migration service Internet Mailbox server + Hermes agent
...
User directory External e-mail E-mail traffic Traffic matrix Migration list Migration request Asynchronous mailbox migration Updates Gateway Lookups AdministratorFigure 5: System model for e-mail service. Hermes components are shown as hashed boxes.
Figure 6: CDF of internal users per e-mail (x-axis is in log-scale).
local information. Finally, we describe the Hermes engine and provide an overview of the clustering algorithm used.
3.1
Inferring the social graph
Hermes constructs the social graph by capturing the sender-recipient relationships, similar to previous work [12, 16, 15]. We also examined the benefit of capturing the recipient-recipient relationship but found this added little value, and, instead, increased overheads and running time by increasing the size of the social graph.
The social graph produced by Hermes has a vertex for each user whose mailbox is stored in the enterprise e-mail system. E-mail addresses for entities outside the enterprise are not included in the graph. Each edge is annotated with two weights: message counterandsize counter. For each e-mail of sizesbytes that is sent from a sender to one or more recipients, a weight of 1/(number of recipients) is added to the message counter on each edge connecting the sender to recipients. The value s/(number of recipients) is added to the size counter on each edge connecting the sender to re-cipients. This captures the strength of the sender-recipient relationships in terms of both messages and bytes sent. The division by the number of recipients was intentionally in or-der to reduce the weight of “broadcast” emails (see Figure 6 for the distribution of the number of internal users per e-mail).
3.2
Hermes agent
The Hermes engine needs to build and maintain the social graph over time. Information about e-mail traffic is fed to the engine by a set of Hermes agents. Each agent is associ-ated with a mailbox server, and tracks the e-mails being sent and received by each user on that server. Here we describe the design of a Hermes agent for Exchange deployments.
Exchange servers support remote logging, and could be configured to backhaul logs containing an entry for each in-coming and outgoing e-mail from a server directly to the Hermes engine. While feasible, this increases the bandwidth overhead of running Hermes, especially as every server that receives the same e-mail (as well as the source server) will generate a log entry for the e-mail.
We therefore use Hermes agents that are co-located on each e-mail store (Exchange server). Each server stores a local log of all incoming and outgoing e-mails, as previously described when introducing the trace. The Hermes agent processes the log entries and locally updates the appropri-ate message counter and size counter edge weights. This has to be done carefully, as a log entry for the same e-mail is generated on the server hosting the sender and all the servers hosting recipient users of each e-mail. Therefore, it is important to avoid double counting. To do this, for any social graph edge induced by an e-mail, the agent consid-ers whether the two usconsid-ers involved are hosted on the local server. If both users are on the local server, the agent adds the full edge weight between the two; if only one is on the local server it adds half the edge weight since the server host-ing the other user will add the other half. Agents do not add any weight between users neither of whom are hosted on the local server.
These edge weights are aggregated per user-pair in mem-ory, and transmitted to the Hermes engine whenever a re-clustering of users is scheduled. When aggregated across all Hermes agents, the Hermes engine can simply add all weights for the same user pairs. This ensures that the edge weights are correctly aggregated. As we will show in Sec-tion 4.4, the bandwidth overheads of transmitting the user-pair information is low.
Another important aspect is that while the re-clustering may be performed frequently, the social graph used may capture information for a longer time window. Therefore, we would like to generate social graphs by aggregating over time. For consistency, the agent must ensure that e-mail log entries locally contribute exactly once to the edges sent to the Hermes engine. This is done by maintaining a small persistent file that marks the timestamp up to which the log entries have been processed.
Another complexity is the migration of mailboxes. Over a period of a week multiple servers may be responsible for the mailbox at different times. This means that multiple servers need to report edge weights for that mailbox. The aggregation of these is trivial at the Hermes engine, but each Hermes agent needs to record the set of users that were hosted on its associated server at any given time. To achieve this, the file also timestamps user migrations, allowing the agent to determine whether a user was hosted on the local server at the time of any particular log entry, and hence whether to add incoming edge weights for that user.
3.3
Hermes engine
The Hermes engine aggregates the user-pair data from the agents to form the social graph of all users in the system. Periodically, it runs a graph partitioning algorithm on this graph to find clusters of strongly-connected users. Using the discovered clusters it then processes this to generate an up-dated user-server mapping, and determines the set of users to migrate. This information is then passed to the migration service which schedules the migrations asynchronously.
The Hermes engine uses pMETIS [13, 14] to partition the social graph. pMETIS is a multi-level partitioning algorithm used in many application domains such as VLSI design, re-ordering sparse matrices, and linear programming. It gen-erates good quality clustering with small computational re-sources for a wide range of applications. pMETIS works hierarchically by first transforming the graph to a series of smaller graphs (known ascoarsening), then partitioning the smaller graphs, and finally uncoarsening the partitions [14]. During this process the algorithm tries to minimize the sum of edge weights going across partitions while balancing the number of vertices per partition.
We also evaluate the performance of using another multi-level partitioning algorithm, kMETIS [13]. In kMETIS [13], the coarsening of the graph is performed directly into k
parts, instead of following a recursive procedure. It pro-vides very similar (although slightly worse) results. We also experimented with using both message count-weighted and byte-weighted edges in the partitioning.
The output of the algorithm is a set of partitions, which correspond to the Hermes user clusters. Hermes then maps clusters to servers such that the number of users to be mi-grated is minimized. Determining the mapping of mailboxes to servers is a NP-complete problem, and we use a scratch-remap repartitioner [7] in order to minimize the data re-distribution costs. Hermes further provides a cost-benefit analysis, describing the overhead of migrating users versus the potential benefits from these migrations. We discuss this in detail in Section 4.2.3.
3.4
Scaling Hermes
The graph partitioning algorithms used in Hermes are cen-tralized. We believe that it is feasible to support a large deployment of 1M+ users using this approach. However, in some applications, the social graph may be too large to fit in memory. We are not aware of any efficient distributed graph partitioning algorithms. Therefore, to achieve scala-bility, we adopt an approach where we preprocess the social graph. The preprocessing coarsens the graph to a level that centralized computation is feasible by Hermes. The coarsen-ing process is similar to the one used by pMETIS and can be distributed. The coarsening is achieved by merging strongly connected nodes in the graph (i.e., nodes connected with large edge weights), and subsequently treating these merged nodes as a single node. Thus, each coarsening round reduces the size of the social graph by around a factor of two. The results produced by Hermes from the coarsened graph are an approximation of the results from the unmodified graph: in particular, merged nodes will be required to be co-located on the same store. We evaluate the loss of efficiency when coarsening the graph with this heuristic in Section 4.
4.
EVALUATION
In this section, we evaluate Hermes using the 5-month e-mail trace described in Section 2.1. The primary metrics of interest is the storage capacity and bandwidth, and how these are impacted by Hermes. We evaluate Hermes across several dimensions and configuration parameters. In par-ticular, we examine Hermes sensitivity toi)the history and policy used to create the social graph, andii)the size of each partition which reflects the number of mailboxes hosted per server. We also discuss how to scale Hermes to hosted and Internet-based e-mail provided services. Finally, we mea-sure the overhead that Hermes induces: the bandwidth cost of mailbox migration and the overheads of creating and ag-gregating the social graph.
4.1
Evaluation model and assumptions
Our evaluation model is driven by the nature of the e-mail trace we are using. The trace includes every e-mail incoming and outgoing sent during the trace period, but does not have information about the size or contents of the user mailboxes during this period. This has several implications; first, for all metrics, we only report the storage, bandwidth, etc. that is used by the e-mails in the trace. We believe that the savings achieved over the five-month trace are representative of those that would be achievable on a continuously running system. Secondly, we assume that each e-mail is stored in the sender’s mailbox as well as that of each recipient. In the organization that was traced, we know that by default a copy of all e-mails is included in a user’s mailbox “Sent Items” folder.
We also assume that identical e-mails in mailboxes on the same server will be coalesced on disk; and in particular, when mailboxes are migrated, a mailbox-delta between the source and destination server is computed and only e-mails that do not exist in the destination server are copied. We shall also assume that the metadata necessary to associate user mailboxes with coalesced emails is small, and we shall ignore that overhead in the storage costs. When calculating network bandwidth, we assume that only one copy of each e-mail is sent to any server hosting one or more recipients of that e-mail.
The e-mail trace is captured at the transport layer and does not capture any user mailbox activity. In particular, this means that we do not observe when users delete e-mails. We therefore have to assume that e-mails are not deleted within the 5-month period. While this is not necessarily very realistic, there are often corporate policies that govern how long e-mails need to be kept and sometimes, for archival and legal reasons, all e-mails are held for a specific period of time. Hence, even when users delete e-mails from their views, permanent deletion on the server is often done ac-cording to system-wide policy, e.g., delete all e-mails older than 6 months.
We use the number and size of e-mails migrated as the metric to measure migration costs. In a live system, either the number of users or the per-user mailbox size could be used. However, since the trace does not have information about the user mailbox sizes, we use the aforementioned metrics.
Finally, our main focus will be storage savings since this is the critical resource for e-mail services. Unless otherwise
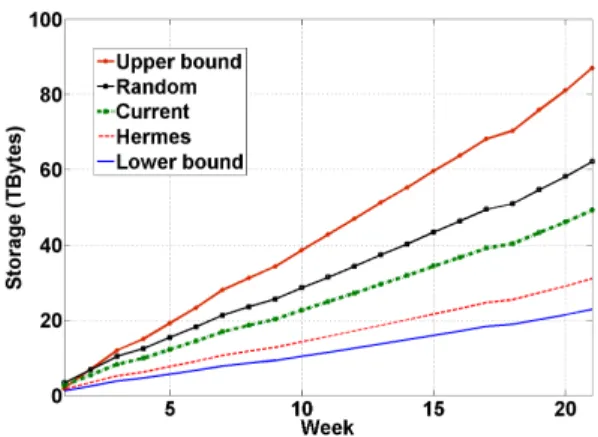
Figure 7: Capacity over time with different strate-gies.
specified, results for bandwidth are qualitatively and quan-titatively similar.
4.2
Hermes performance
We first examine to what extent Hermes might provide storage and bandwidth benefits. We compare the resource usage of Hermes with four alternatives:
1. Thelower boundshows the storage used where all mail-boxes are hosted in the same server, which enables perfect coalescing of e-mails. The lower bound is not achievable in practice, since a single server cannot host the entire system.
2. The upper bound where no coalescing is done: each e-mail is stored as many times as the internal users of the e-mail. This is equivalent to hosting each user mailbox on its own server.
3. Arandomplacement of mailboxes on servers.
4. Thecurrentplacement of mailboxes on servers, which is inferred from the trace (Section 2.1). New user mailboxes are typically added to new (underutilized) servers using a greedy approach. Since new users are often related to each other, e.g., the members of a newly created group, the current greedy approach can lead to some inadvertent clustering and hence better performance than a random placement.
All methodologies (apart from the lower and upper bounds) use 68 servers to allow comparison with the current assign-ment. The Hermes configuration uses pMETIS and all avail-able history till the previous week to optimize the graph for the current week. The latter is a best-case scenario for Her-mes. However, as we later discuss in this section, different history policies have a minimal effect on the performance observed.
Figure 7 presents the results over time for the trace. The first observation is that Hermes’ storage is only 51% com-pared to the storage required by a random mailbox place-ment and 65% when compared to the storage used by the current mapping. Further, Hermes storage is approximately 1.3 times the lower bound. Recall that the lower bound re-quires all e-mails to be stored in a single coalescing store, whereas Hermes balances the users approximately uniformly over the 68 servers.
The random mapping performs worse than the current mapping. The difference highlights the effect of
uninten-tional clustering, e.g., when an entire team is given mail-boxes on the same server. The random mapping curve re-flects the average of a run of 100 different random mappings. The 95th confidence intervals where less than 0.01%
differ-ent from the mean. Interestingly, the storage use for all five strategies is very stable over time, i.e., the amount of extra storage added every week is almost constant. Thus, the ag-gregated e-mail storage demand of a very large organization is stable over the time period of weeks/months.
With regards to bandwidth savings, the results are quali-tatively similar to Figure 7. However, savings are larger for bandwidth, with Hermes requiring 60% and 47% less band-width compared to the random and the current mappings respectively.
4.2.1
Effect of clustering policies and algorithms
In the previous section, we have presented the results with an optimal Hermes configuration, i.e., where all history up to that point in time was used to partition the social graph. We now evaluate different partitioning practices and how these affect the potential savings.
Partitioning may depend both on the actual algorithm employed, and also on the history used to construct the so-cial graph and the edge weights. Similarly, partitioning may occur more or less frequently depending on the desired pol-icy. We define two general classes of policies. First,static
policies construct and partition the social graph once. Such policies may be sufficient for graphs that do not evolve signif-icantly over time, relationships and nodes are to an extend static, and thus re-partitioning will not offer significant ben-efits. On the contrary,dynamic policies specify a rate of re-evaluating the graph partitions, and ideally, the rate should be related to how fast the graph changes over time.
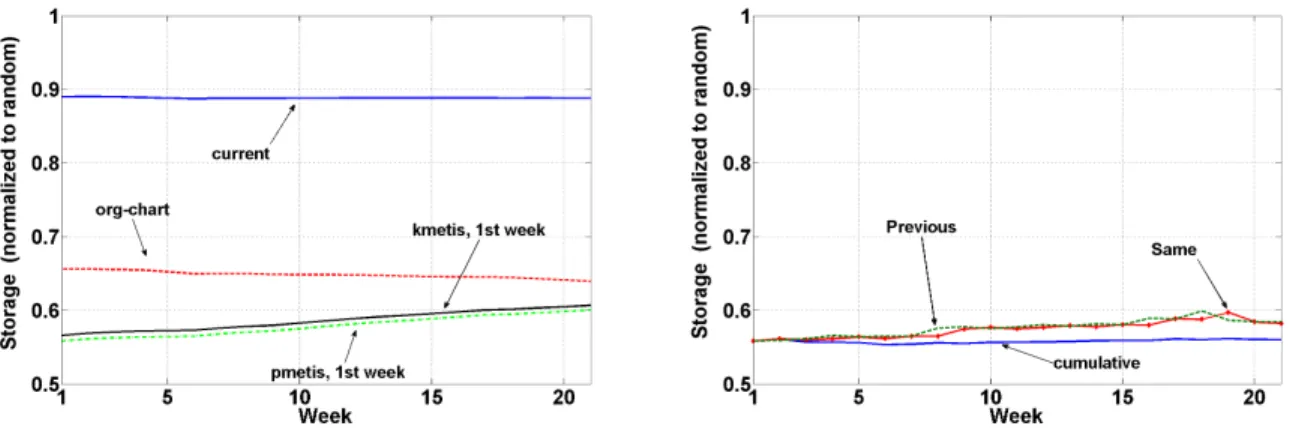
Static policies. In Figure 8, we examine the following static policies. i)Constructing the social graph and parti-tioning after the first week only, thus using this mapping for the rest of our trace (1st week in Figure 8, left). ii)
“Current”, which reflects the existing, inferred mapping of mailboxes to servers. iii)A partitioning based on the organi-zational structure of the examined corporation (“org-chart” in Figure 8, left). This is a different type of policy, which is application-specific and exploits additional information re-garding the social graph by crawling the organization tree of the enterprise. Edges between users reflect shortest-path distances by following the paths as defined by the organi-zational tree. Such information might be provided by the directory service of the Exchange service and be mapped to a graph by Hermes.
We further examine all partitions using both kMETIS and pMETIS. In all cases examined, the difference between the kMETIS and pMETIS algorithms is negligible (less than 1%), with pMETIS being marginally better. Thus, for visu-alization purposes, Figure 8 shows the kMETIS algorithm only for the first week clustering policy.
Figure 8 (left) presents the evaluation for the static poli-cies for the storage requirements, normalized to a random partitioning. While the current placement of mailboxes to servers is better than random, it however offers an improve-ment of only 10% compared to random placeimprove-ment. This reflects the greedy placement of mailboxes that does not ex-ploit any application-specific information. Instead, both the “org-chart” based clustering and the partitionings based on the first week of the trace provide benefits of 35% to 45%.
The performance of the partitioning using first-week infor-mation only degrades slowly but steadily over time. As new users join, and users’ roles and relationships change within the organization, these are not reflected in the mailbox map-ping. Thus, while the difference is small on the time scale of weeks, eventually the system will need to adapt to these changes; otherwise the benefits of partitioning may be di-luted over time. Performance appears to degrade roughly 4% during the period of five months.
While the org-chart based clustering appears to improve over time, this is a side-effect of our data collection method-ology. We have crawled the organizational structure a few days after the e-mail trace was collected, and as a side ef-fect the org tree reflects true “report-to” relationships for all users at the end of the collected trace. The number of users changing position is typically small compared to the total population. However, these moves do appear to have some effect on user communication patterns. Intuitively, the org-chart partitioning offers benefits because most com-munication patterns within a corporation are induced to a large-extend by its organizational structure. In general, this example shows that incorporating application-specific knowledge to construct the social graph can offer significant benefits.
Dynamic policies. Figure 8 (right) examines the stor-age case for a set of dynamic policies which account for the weaknesses of static policies, ergo adapting the social graph over time. We evaluate the following policies. i)Using the previous week to construct the social graph and applying the partitioning at the current week (“previous” in Figure 8, right). ii) Having an oracle where data from the current week are used to both create the social graph and evaluate the savings (“current” in Figure 8, right). iii) Construct-ing the social graph havConstruct-ing all history till the previous week (“cumulative” in Figure 8).
The differences between the dynamic policies are in gen-eral small, and benefits are in the order of 45%. Using short history or an oracle predicting the data for the current week appears to produce similar results. This is true even after examining history ranging up to a month. Clustering using a short history appears to be affected by transient phenom-ena in user communication patterns (e.g., users being on holidays) as implied by the noisier trends in the correspond-ing lines. The best performance is achieved if cumulative history is used (i.e., all data available until the specific mo-ment in time). This is to be expected, since such long history takes into account both short-term variation and longer term trends in user communication patterns. Finally, differences between static and dynamic policies are overall small (less than 6%). However, as expected, dynamic policies offer a more stable performance as time progresses.
Due to space limitations, we present the static policies only for the bandwidth savings (Figure 9). In general, re-sults are similar but savings appear a bit more pronounced for the bandwidth case, up to 60% compared to random par-titioning during the first weeks of the trace. Similarly, how-ever, benefits with static policies appear to degrade faster with time when compared to storage savings.
Summarizing, our evaluation implies that different parti-tioning algorithms result in similar performance. We further observe small differences across social-graph based policies. Comparable performance across dynamic and static policies
Figure 8: Effect of different static (left) and dynamic (right) clustering policies, normalized to a random partitioning on storage requirements.
Figure 9: Effect of different static clustering policies, normalized to a random partitioning for bandwidth usage.
hints towards a graph whose relationships change slowly over time, which is to be anticipated for an enterprise e-mail sys-tem. However, even marginally, dynamic policies perform better as they adapt to changing communication patterns.
4.2.2
Partition sizes and mailboxes per server
A critical parameter for enterprise e-mail services is the cluster size which reflects the number of user mailboxes hosted per server. To identify the optimal operation point, we evaluate the whole spectrum ranging from the one ex-treme of hosting one mailbox per server, to hosting all mail-boxes on one server. Our evaluation compares different poli-cies normalized to a random partitioning as in the previous section. The evaluation was performed during the last week of the trace in order to examine both the best-case (with the cumulative policy), and the worst-case (with the first-week policy) in terms of benefits, and whether the policy used affects the shape of the produced curves.
Figure 10 depicts our findings for the cumulative and first-week policies. The two extremes (one user per server, and all users hosted in one server) are equivalent to random par-titioning. The shape of the curves appears qualitatively sim-ilar across policies, which implies that different policies do
Figure 10: Effect of cluster sizes (i.e., mailboxes hosted per server) on the benefits compared to a random partitioning. (x-axis in log-scale.)
not impact the acquired benefits depending on the partition size. The optimal operation point providing the most bene-fits compared to random mailbox placement is in the order of a few thousand mailboxes per server. This is close to current operational points and to the average number of mailboxes per server for the existing partitioning of the examined en-terprise. However, note that thex-axis is in log-scale, with the optimal region covering roughly an order of magnitude.
4.2.3
Re-partitioning rate and migrations
While Hermes might provide an optimal partitioning from a graph perspective, this produced partitioning might not be practical from an application perspective. For example, the overhead of moving a large fraction of users to new servers might be significant, and thus not desirable operationally. This is an issue, as Hermes will not run just once to optimize the Exchange service. Instead, as new users are introduced to the service and relationships across users evolve over time, partitions will need to be updated affecting as few items as possible.
Once the new re-mapping of users-to-servers is decided, Hermes then evaluates the user mailboxes to be migrated and the associated cost. Migration costs relate to the rate
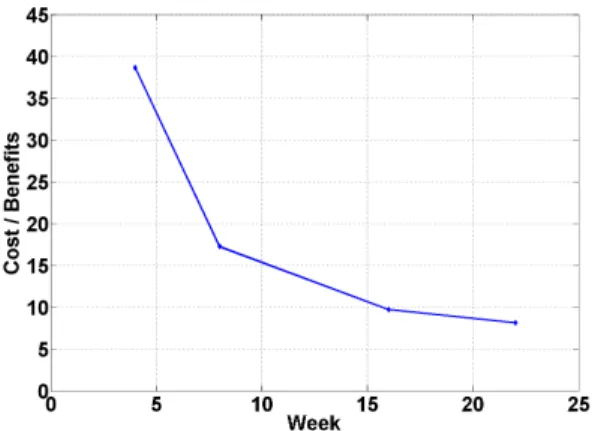
Figure 11: Cost-benefit analysis for migrations.
by which the graph under consideration evolves. Ideally, the re-partitioning rate should reflect this graph evolution rate. The rate further impacts both the re-partitioning benefits and the associated cost of migrations to achieve the opti-mal placement. For example, it is possible that when an operational point is close to the optimal, the cost of migra-tions to gain the extra benefits outweighs the actual benefits; thus, re-partitioning is not beneficial at the specific point in time. The re-partitioning rate also relates to the cost of the resources themselves. For the Exchange service, the band-width cost might be significantly less than the storage one, and the overhead of migration and the expected benefits should be a function of these costs.
Hermes empirically identifies the re-partitioning rate by providing a cost-benefit analysis to the Exchange service. Concretely, after re-partitioning, Hermes estimates both the migration costs and expected benefits. The application is then responsible of translating both the cost and the benefits to actual resource usage and prices. The service may then decide whether the migrations specified by Hermes should take place, and the migration plan. The latter may dictate a migration rate over time.
Figure 11 provides this cost-benefit analysis for the trace under consideration. The figure highlights the ratio of costs-to-benefits that would be achieved by migrating all users to the new mapping. For example, assuming no migrations before week 16 (excluding the initial migration during the first-week), the cost of bandwidth to migrate all mailboxes to the new mapping is ten times the storage benefits. If the Ex-change service values storage tenfold compared to network bandwidth, then the service should perform the migrations. For the initial step, i.e., when moving from the current mapping to the optimal after the first week, the storage benefits are larger but in the same order as the network cost. Note however that this initial ratio grossly underestimates storage benefits, as it ignores the future storage benefits that would be achieved if the system migrated to the indicated Hermes mapping.
4.3
Scaling Hermes to the cloud
Having shown the effectiveness of optimizing an enter-prise mail system using the social graph generated by e-mail communications, we now consider the relevance of our approach to cloud hosted e-mail systems, like Hosted Ex-change. Additionally, we discuss whether the same approach
Figure 12: CDF of e-mails per external address.
might be applicable to generic Internet-based e-mail ser-vices, like Hotmail and GMail.
Hosted e-mail services, such as Hosted Exchange, are be-coming increasingly popular for organizations that wish to avoid the cost, management, and complexity overhead of managing and provisioning their own e-mail servers. A hosted e-mail provider runs an e-mail service and charges a per-user or per-organization fee to manage the mailboxes. A key characteristic of hosted e-mail services is that the mem-bers of an organization that outsources its e-mail maintain an e-mail address associated with the domain of the orga-nization, e.g., [email protected]. A hosting provider thus knows which organization each e-mail address is associated with for billing purposes.
The largest corporate e-mail services are required to sup-port approximately a million users. Hosted e-mail services are designed to scale up by at least another order of mag-nitude. For these services, the provision of storage capacity dominates the costs. Thus, hosting providers rely heavily on statistical multiplexing across users, and tend to have much higher ratios of quota to dimensioned storage, as high as 400:1. Exploiting the coalescing of e-mails is therefore important in these environments.
For these hosted services, where all mailboxes belonging to a single organization are known, we believe that Hermes could provide significant benefit. Hermes can be used on a per-organization basis to cluster users within the same or-ganization. The e-mail trace used to evaluate Hermes in the previous sections would be the same, irrespective of whether it is being stored on dedicated servers within the enterprise network, or being externally hosted. Indeed, due to the scale of the hosted services, the mapping of users to storage servers is currently likely to be closer to random for hosted services. In such a case, Figure 7 clearly shows that the reduction in storage would be even greater with Hermes.
Unlike traditional enterprise, hosted e-mail service would support multiple organizations within the same data center. Thus, an interesting question here is whether user cluster-ing should be performed across all organizations, or whether intra-organization clustering will suffice to provide the most significant savings. Note however, that inter-organization clustering, i.e., coalescing user mailboxes of different organi-zations in the same server, might not always be feasible due to legal and administrative issues.
Figure 13: Benefits from intra-organization parti-tioning.
In order to quantify the potentials of both scenarios, we examined e-mails destined to or originating from external users of our examined organization in the trace. This pro-vides an approximation of the previous scenarios, when as-suming that all external recipients in the same domain (e.g., gmail.com) belong to the same organization. If sufficient gains were to exist for cross-organization clustering, then we should observe a large number of e-mails with internal users and the same external addresses. Figure 12 highlights that this is not the case, by examining the number of e-mails ob-served per external address. Indeed, for roughly 99% of the external addresses in our trace, we observe only 150 e-mails per address over five months; relationships between users belonging to different organizations appear to be “weak”.
We further examined the number of distinct external do-mains per e-mail. Multiple dodo-mains per e-mail would denote potential for cross-organization savings. Again, this does not appear to be the case. Of all e-mails observed, 55% have no users from an external domain. of the remaining e-mails, 98% have users from one just distinct external domain, and 99.5% have users from two or fewer external domains.
Next, we examined whether per-organization clustering only can offer benefits, by considering only intra-organizational clustering similar to the analysis of Figure 1. Therefore, an e-mail sent to a set of four recipients in the same domain will result in just one copy of the e-mail being stored for the recipients. Similarly, if an e-mail is sent to four recip-ients in different domains then four copies will be stored. Figure 13 shows the potential maximum benefit by examin-ing the worst- and best-case scenarios, and the partitionexamin-ing based on domain. The figure shows that intra-domain par-titioning provides 3/4 of the potential benefits.
Thus, the previous discussion implies that intra–organi-zation social graph based clustering offers the vast majority of the savings. On the contrary, opportunities to coalesce mailboxes across organizations appear limited, while the as-sociated overheads might be significant (e.g., larger social graphs, enforcing cross-organization policies).
4.3.1
Internet e-mail provider services
Many individuals use general Internet e-mail services, like Hotmail or GMail. These users are assigned an email ad-dress that uses the domain name of the service, for example [email protected], and there is no organizational information.
Figure 14: Performance with coarsening heuristic.
These e-mail services each host 100+ million users. As dis-cussed in Section 3, for such graphs that are too large to fit in memory, we perform a coarsening heuristic to reduce the graph to a size so that it can be partitioned by a single ma-chine. Here, we evaluate whether this approximation incurs any associated drop in performance.
To examine the coarsening heuristic, we use our e-mail social graph and apply various levels of coarsening. In the best case, each coarsening level reduces the graph by half. Thus, for example, applying a 6-level coarsening to a graph of 150 Million nodes can reduce the graph up to 2.4 million nodes. After coarsening, we then run Hermes with varying cluster sizes. Note that during each coarsening phase, nodes (i.e., user mailboxes) that are merged will be co-located on the same server by design.
Figure 14 shows that applying a number of coarsening levels does not significantly impact performance; benefits appear constant with the coarsening level. Compared to running Hermes on an un-coarsened graph, we observe a performance degradation of roughly 1%.
Besides the computational complexity for large graphs of Internet-based e-mail providers, the communication pat-terns of their user base is an important factor that may affect Hermes’ performance. In general, Hermes should perform well in graphs with small well-connected clusters that are inter-connected through “weak” links [24]. Such properties have commonly been observed in social applications. The expected savings of using Hermes in general Internet-based e-mail providers is an open question.
4.4
Overheads
Hermes induces bandwidth overheads by transmitting the social graph information from the Hermes agents to the Her-mes engine. This corresponds to an overhead of 48 bytes per graph edge transmitted: a 128-bit hash for each user, and 64 bits each for the weight in messages and bytes respectively. In total, we transfer 321 MB, or 4.34 MB per Hermes agent. The Hermes engine has a memory and CPU overhead for running METIS. We run the Hermes engine on a PC with an Xeon 2.66 GHz processor and 8 GB of RAM. METIS re-quires 15 seconds of CPU time and 250 MB to store the social graph of the trace used, which features roughly 128 thousand nodes and 9-15 million edges, depending on the history used. These overheads are low and show that run-ning these algorithms is very feasible.
The largest graph that we managed to run on the PC described above was a random graph of 4 million nodes (270 million edges). For this graph, METIS requires 10 minutes of CPU time and, by design, all the available memory to store the graph.
5.
RELATED WORK
To our knowledge this is the first work to use a social graph to optimize resource usage in a distributed system. Most previous research on social graphs has concentrated on graph properties such as degree distributions or clustering coefficients [6, 21], or their particular structure [18]. Ad-ditionally, other studies try to understand sharing patterns and popularity of objects and applications [4, 23] or infor-mation propagation through social links [5, 19]. Previous work on e-mail based social graphs studied their structure and their evolution over time [9, 15, 16]; probability of e-mail reply [12]; the strength of communication edges [24]; and the performance of greedy forwarding algorithms through the e-mail social graph [1].
Some previous research has used social graphs to improve application behavior. Ostra [22] tries to infer trust relation-ships from the social graph and use them to limit user’s ex-posure to unwanted communications or content. Ostra was validated by applying communications patterns from a 200-user e-mail trace to a social graph based on YouTube. The Peerspective project [20] proposes exploiting social links to improve the quality of search results, both in finding results and in ranking their relevance.
Links or similarities between objects have been used in a wide variety of file systems to improve performance. While these links could be viewed as inducing a graph (though not a social one), generally these approaches do not optimize the graph as a whole, but use heuristics based on local, usually 1-hop, link information. For example, Connections [25] detects similarities between files based on the context in which they are accessed, and uses this to improve file search results. SEER [17] uses directory structure and temporal locality to group files for prefetching and caching on mobile devices.
The benefits of Hermes rely on support for coalescing mul-tiple copies of the same e-mails on a single server. Coalesc-ing e-mails is a simple application of the broader approach of coalescing objects, since e-mails contain unique IDs and also encode within themselves the list of users that need to share them. The more general problem of coalescing dupli-cate objects has been addressed by many file and storage systems [3, 8, 26, 28].
The problem of partitioning graphs into k balanced sets has many applications in may settings, including capacity planning, clustering, optimization, VLSI design, routing, and others. The problem is known to be NP-complete. See [2, 27] and references therein for a description of the problem, and of various approximation techniques that have been proposed in the past. We have used heuristics based on multilevel graph partitioning [11, 14] as they were compu-tationally more efficient for our application than heuristics based on spectral partitioning.
6.
CONCLUSION
We have demonstrated that we can optimize a large-scale enterprise e-mail system using the social graph of user e-mail communications. By exploiting clusters of highly connected
users, Hermes can achieve a 37% reduction in the storage requirements for a large corporate e-mail system. We also showed that Hermes can track changes in the e-mail social graph over time and balance the cost of migrating users against the benefits.
There has been considerable work over the last few years on studying and understanding the properties of social net-working applications and their associated implicit or explicit social graphs. Once these underlying properties are iden-tified, using them in systems design and optimization be-comes feasible. Hermes is clearly designed to support e-mail systems, where communication patterns between users nat-urally emerge. We believe that other applications might benefit from social-graph based optimization or re-design, for example, instant messaging. Within enterprises, it is even perhaps feasible to aggregate the social networks that result from different applications, such as, e-mail communi-cations, instant messaging, management structure, or divi-sional structure. Such an aggregated graph could capture diverse aspects of corporate interaction and user relation-ships, allowing further optimization across different services used by the enterprise.
Acknowledgments
The authors would like to thank Georgia Huggins and Dave LeClair for the e-mail trace data used in this paper to moti-vate and evaluate Hermes. We would also like to thank Chris Mitchell for helping us understand better the architecture of the Exchange server.
7.
REFERENCES
[1] Adamic, L., and Adar, E.How to search a social network.Social Networks 27, 3 (2005), 187–203. [2] Arora, S., Rao, S., and Vazirani, U.Geometry,
flows, and graph-partitioning algorithms.CACM 51, 10 (2008), 96–105.
[3] Bolosky, W. J., Corbin, S., Goebel, D., and Douceur, J. R.Single instance storage in WindowsR
2000. InWSS’00: Proceedings of the 4th conference on USENIX Windows Systems Symposium (Berkeley, CA, USA, 2000), USENIX Association, pp. 2–2. [4] Cha, M., Kwak, H., Rodriguez, P., Ahn, Y., and
Moon, S.I Tube, You Tube, Everybody Tubes: Analyzing the World’s Largest User Generated Content Video System. InIMC ’07: Proc. of the 7th ACM SIGCOMM conference on Internet measurement
(2007).
[5] Cha, M., Mislove, A., and Gummadi, K. P.A Measurement-driven Analysis of Information
Propagation in the Flickr Social Network. InProc. of the 18 Intl. World Wide Web Conference (WWW)
(2009).
[6] Chun, H., Kwak, H., Eom, Y., Ahn, Y., Moon, S., and Jeong, H.Comparison of online social relations in volume vs interaction: a case study of cyworld. In
IMC ’08: Proc. of the 8th ACM SIGCOMM conference on Internet measurement (2008), pp. 57–70.
[7] Dongarra, J., Foster, I., Fox, G., Gropp, W., Kennedy, K., Torczon, L., and White, A., Eds.
Sourcebook of parallel computing. Morgan Kaufmann Publishers Inc., San Francisco, CA, USA, 2003.
[8] Douceur, J. R., Adya, A., Bolosky, W. J., Simon, D., and Theimer, M.Reclaiming space from duplicate files in a serverless distributed file system. In
In Proceedings of 22nd International Conference on Distributed Computing Systems (ICDCS)(2002). [9] Eckmann, J.-P., Moses, E., and Sergi, D.Entropy
of dialogues creates coherent structures in e-mail traffic. InProc. Natl. Acad. Sci. 101:14333-14337
(2004).
[10] Exchange Development Team. Private communications.
[11] Hendrickson, B., and Leland, R. W.A multi-level algorithm for partitioning graphs. Tech. rep., Sandia National Laboratories, 1993.
[12] Karagiannis, T., and Vojnovic, M.Behavioral Profiles for Advanced Email Features. InProc. of the 18 Intl. World Wide Web Conference (WWW)(2009). [13] Karypis, G.Metis - family of multilevel partitioning
algorithms.
http://glaros.dtc.umn.edu/gkhome/views/metis/, 2009.
[14] Karypis, G., and Kumar, V.A fast and high quality multilevel scheme for partitioning irregular graphs.J. of Scientific Computing 20, 1 (1998), 359–392. [15] Kossinets, G., Kleinberg, J., and Watts, D.The
structure of information pathways in a social communication network. InACM SIGKDD (New York, NY, USA, 2008), ACM, pp. 435–443.
[16] Kossinets, G., and Watts, D.Empirical analysis of an evolving social network. InScience, 311:88−90
(2006).
[17] Kuenning, G. H.The design of the SEER predictive caching system. InProceedings of the Workshop on Mobile Computing Systems and Applications (1994), pp. 37–43.
[18] Kumar, R., Novak, J., and Tomkins, A.Structure and evolution of online social networks. InKDD ’06: Proc. of the 12th ACM SIGKDD international conference on Knowledge discovery and data mining
(2006), pp. 611–617.
[19] Leskovec, J., Adamic, L., and Huberman, B. A. The dynamics of viral marketing. InProceedings of the
7th ACM conference on Electronic commerce (EC)
(2006), pp. 228–237.
[20] Mislove, A., Gummadi, K. P., and Druschel, P. Exploiting Social Networks for Internet Search. In
Proc. of the 5th ACM Workshop on Hot Topics in Networks (HotNets) (2006).
[21] Mislove, A., Marcon, M., Gummadi, K. P., Druschel, P., and Bhattacharjee, B.
Measurement and Analysis of Online Social Networks. InProc of the 5th ACM/USENIX Internet
Measurement Conference (IMC’07) (2007). [22] Mislove, A., Post, A., Gummadi, K. P., and
Druschel, P.Ostra: Leverging trust to thwart unwanted communication. InProc. of the 5th Symposium on Networked Systems Design and Implementation (NSDI’08) (2008).
[23] Nazir, A., Raza, S., and Chuah, C.Unveiling facebook: a measurement study of social network based applications. InIMC ’08: Proc. of the 8th ACM SIGCOMM conference on Internet measurement
(2008), pp. 43–56.
[24] Shi, X., Adamic, L., and Strauss, M.Network of Strong Ties.Pysica A 378, 1 (2007), 33–47.
[25] Soules, C. A. N., and Ganger, G. R.Connections: using context to enhance file search.SIGOPS Oper. Syst. Rev. 39, 5 (2005), 119–132.
[26] Tolia, N., Kozuch, M., Satyanarayanan, M., Karp, B., Perrig, A., and Bressoud, T. Opportunistic use of content addressable storage for distributed file systems. InProceedings of the 2003 USENIX Annual Technical Conference (San Antonio, TX, June 2003), pp. 127–140.
[27] Vazirani, V.Approximation algorithms. Springer, 2001.
[28] Zhu, B., Li, K., and Patterson, H.Avoiding the disk bottleneck in the data domain deduplication file system. InFAST’08: Proceedings of the 6th USENIX Conference on File and Storage Technologies
(Berkeley, CA, USA, 2008), USENIX Association, pp. 1–14.