Peer Sharing Behaviour in the eDonkey Network, and
Implications for the Design of Server-less File Sharing
Systems
S. B. Handurukande
∗, A.-M. Kermarrec
†, F. Le Fessant
‡, L. Massouli ´e
§and S. Patarin
¶ABSTRACT
In this paper we present an empirical study of a work-load gathered by crawling the eDonkey network — a dominant peer-to-peer file sharing system — for over 50 days.
We first confirm the presence of some known features, in particular the prevalence of free-riding and the Zipf-like distribution of file popularity. We also analyze the evolution of document popularity.
We then provide an in-depth analysis of several
clus-tering properties of such workloads. We measure the
geographicalclustering of peers offering a given file. We find that most files are offered mostly by peers of a sin-gle country, although popular files don’t have such a
clearhome country.
We then analyze the overlap between contents offered by different peers. We find that peer contents are highly clustered according to several metrics of interest.
We propose to leverage this property by allowing peers to search for content without server support, by
query-ing suitably identifiedsemantic neighbours. We find via
trace-driven simulations that this approach is generally effective, and is even more effective for rare files. If we further allow peers to query both their semantic neigh-bours, and in turn their neighbours’ neighneigh-bours, we at-tain hit rates as high as over 55% for neighbour lists of size 20.
Categories and Subject Descriptors
C.2 [Computer-Communication Networks]:
Dis-tributed Systems
∗DPL, EPFL, Switzerland
†IRISA/INRIA, Rennes, France
‡INRIA-Futurs and LIX, Palaiseau, France
§Microsoft Research, Cambridge, UK
¶University of Bologna, Italy
Permission to make digital or hard copies of all or part of this work for personal or classroom use is granted without fee provided that copies are not made or distributed for profit or commercial advantage and that copies bear this notice and the full citation on the first page. To copy otherwise, to republish, to post on servers or to redistribute to lists, requires prior specific permission and/or a fee.
EuroSys’06,April 18–21, 2006, Leuven, Belgium. Copyright 2006 ACM 1-59593-322-0/06/0004 ...$5.00.
General Terms
Algorithms,Measurement,Experimentation
Keywords
Peer-to-peer,file sharing,trace, simulation
1. INTRODUCTION
File sharing peer-to-peer systems such as Gnutella [9], Kazaa [15] and eDonkey [6] have significantly gained im-portance in the last few years to the extent that they now dominate Internet traffic [22, 24], way ahead of Web traffic. It has thus become of primary importance to un-derstand workload properties of these systems, in order to optimize their performance. Previous measurement studies of peer-to-peer networks have mainly focused on
free-riding[1], peer connectivity and availability [2, 26], and peer distribution and locality within the network [26, 12, 5].
Recent studies of Kazaa [12] show that system perfor-mance can be greatly enhanced by taking into account geographic proximity between peers. On the other hand, several papers [28, 30, 32, 20, 19, 4] suggest that non-geographic relationships between peers could be lever-aged as well. Specifically, peers with common interests may benefit from being peered together. The underly-ing notion of proximity is no longer geographical, but
rather an interest-based, orsemanticproximity metric.
The reason why performance gains should be expected is intuitively clear: peers with common interests are likely to request the same documents. They are thus more likely to succeed when searching documents by querying one another, rather than by querying arbitrary peers. Such gains in search performance may be ex-pected in general, and would be more significant if they applied to searches for rare documents [28].
The potential of this type of approach depends criti-cally on the extent to which peers in file sharing systems are clustered, either in the usual geographical sense, or according to interest-based metrics. However, previous studies have not treated these questions.
The main objectives of the present work are to mea-sure the extent of such clustering in current peer-to-peer systems, and to propose and evaluate techniques to leverage the presence of such clustering.
To this end, we collected measures of the eDonkey peer-to-peer network from December 9, 2003 to Febru-ary 2, 2004 by crawling part of this network. We made
2.5 million connections to peers and browsed their cache contents.
The total volume of shared data thus discovered (with multiple counting) was over 350 terabytes. Previous studies of peer-to-peer workloads have typically relied on traces gathered by observing network traffic from a single location, usually a university or an ISP. In contrast, our trace is collected by actively probing the cache contents of peers distributed over several coun-tries, mostly in Europe, where eDonkey is the dominant
peer-to-peer network1.
We first report results on peer contributions, mea-sured in bytes and files shared, and on file popularity. These are generally consistent with the corresponding results for the Kazaa workload in [12].
We then analyze geographical and semantic cluster-ing properties. We measure the latter by means of a suitable correlation metric between peer cache contents, which predicts the frequency with which peers that have shared common documents in the past may share others in the future.
Finally, we evaluate the effectiveness of submitting file search queries to semantic neighbours via trace-driven simulations. We consider several methods for identi-fying semantic neighbours, and generally observe high success rates. We also evaluate the extent to which these positive results are explained by the presence of gener-ous peers, by performing experiments on suitably mod-ified traces. We find that semantic clustering is not an artefact of the presence of generous peers, and can thus be leveraged without overloading such peers.
The rest of this paper is structured as follows. In Sec-tion 2, we present the eDonkey network and the tech-niques we used to gather the measurements. In Sec-tion 3 we report results on the distribuSec-tions of peer contribution and file popularity. We present measures of semantic and geographic clustering in Section 4. Sec-tion 5 describes the results on the effectiveness of using semantic peers for document search. In Section 6, we review related work on peer-to-peer systems measure-ments before concluding in Section 7.
2.
TRACE COLLECTION
Before describing our experimental settings for data collection, let us recall some background on eDonkey.
2.1
The eDonkey network
The eDonkey network [6] (also well known for one of
its open-source clients,Emule) was, in October 2005, the
most popular peer-to-peer file sharing networks with 2.9 millions daily users [27]. EDonkey provides advanced features, such as search based on file meta-data, concur-rent downloads of a file from diffeconcur-rent sources, partial sharing of downloads and corruption detection.
The architecture of the network is hybrid: the first
tier is composed of servers, in charge of indexing files
and the second tier consists inclientsdownloading and
uploading files. We describe below the interactions be-tween clients and servers, and bebe-tween clients them-selves.
1A fully anonymized version of our trace is available for
research purposes.
Client-server interactions
The client-server connection serves two main purposes:
(i)searching for new files to download, and(ii)finding
new sources of files while they are being downloaded. At startup, each client initiates a TCP connection to at least one server. The client then publishes the list of files it is willing to share (its cache contents). A list of available servers is maintained by the servers — it is the only data communicated between servers — and propagated to the clients after connection.
Clients send queries to discover new files to download. Queries can be complex: searches by keywords in fields (e.g. MP3 tags), range queries on size, bit rates and availability, and any combination of them with logical
operators (and, or, not). Each file has a unique identifier
(see below) which is used by clients to query for sources where they can download it. Queries for sources are retried every twenty minutes in an attempt to discover new sources. Clients also use UDP messages to prop-agate their queries to other servers since no broadcast functionality is available between servers.
Some old servers support the query-users functional-ity, i.e. searching users by nickname. As will be seen, we use this feature, which is unfortunately no longer implemented in the new versions of the servers.
Client-client interactions
Once a source has been discovered, the client establishes a TCP connection to it. If the source sits behind a firewall, the client may ask the source server to force the source to initiate the connection to the client. The client asks the source whether the requested file is available, and which blocks of the file are available. Finally, the client asks for a download session, to fetch all the blocks of interest.
Files are divided in 9.5 MB blocks, and a MD4 check-sum [23] is computed for each block. Checkcheck-sums can be propagated between clients on demand. The file identi-fier itself is generated as a MD4 checksum of all the par-tial checksums of the file. Files are shared (available for download) as soon as at least one block has been down-loaded and its checksum verified by the corresponding client.
Finally, clients can also browse other clients, i.e. ask another client for the list of files it is currently shar-ing. This feature, which we use in our crawler, is not available on all clients, as it can be disabled by the user.
0 10 20 30 40 50 60 70 350 360 370 380 390 0 0.2 0.4 0.6 0.8 1 1.2 1.4 1.6 1.8 Clients (Thousands) Files (Millions) Days clients files
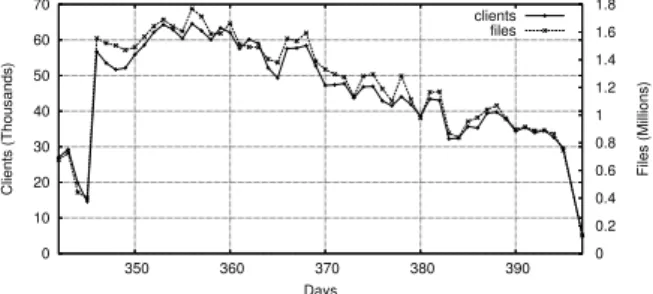
Figure 1: Evolution of the number of
clients and shared files per day over the period (extrapolated trace).
0 0.1 0.2 0.3 0.4 0.5 0.6 0.7 0.8 350 360 370 380 390 0 2 4 6 8 10 12
New files (Millions) Total files (Millions)
Days new files
total files
Figure 2: Evolution of the number of files discovered during the trace (full trace).
2.2
The eDonkey crawler
To gather a trace of eDonkey clients, we modified an
open-source eDonkey client,MLdonkey[7].
Our crawler is initialized with a list of current eDon-key servers. It concurrently connects to all servers, re-trieving new lists of servers, and starts asking for clients that are connected to these servers. For each query, a server either does not reply (if the query-users feature is not implemented) or returns a list of users, whose nicknames match the query.
Current eDonkey servers can handle more than 200,000 connected users (provided they have the necessary band-width). As server replies are limited to 200 users per query, our crawler repeatedly submits queries to servers
to build its list of users2.
The resulting list of users is then filtered to keep only reachable clients (i.e. not firewalled clients). Another module of the crawler then connects repeatedly to these clients every day. Once a client is connected, the list and description of all files in its cache content are retrieved. We should stress that large scale measurements such as those reported in this paper can no longer be done with this crawler architecture, based on the nickname functionality. Indeed, users are increasingly reluctant to make available the list of contents they share and now tend to disable this functionality.
2.3
General trace characteristics
We now discuss some preliminary observations from the trace that was collected from December 9, 2003 to February 2, 2004.
Figure 1 depicts the number of clients and files suc-cessfully scanned daily, over the measurement period. It shows a decrease of the number of clients traced daily (from 65,000 at the beginning to 35,000 at the end). This is an artifact of the measurement process (in par-ticular, tighter bandwidth constraints on the crawler), as the number of clients on eDonkey has been increasing during the measurement period.
Figure 2 shows the total number of files and the num-ber of new files per day over time. Even after one month, our crawler discovered 100,000 new files per day. By re-lating the number of new files discovered to the numbers of browsed clients reported in Figure 1, one finds that
2It tries 263different queries, starting with -”aaa”- and
ending with -”zzz”-. Not all users are retrieved in this manner, due to the fact that many users share the same names.
Full trace
Duration (days) 56
Number of uniquely identified clients 1,158,976
Number of free-riders 975,116 (84 %)
Number of successful snapshots 2,520,090
Number of distinct files 11,014,603
Space used by distinct files 318 TB
Filtered trace
Number of distinct clients 320,190
Number of free-riders 226,570 (70 %)
Extrapolated trace
Duration (days) 42
Number of distinct clients 53,476
Number of free-riders 39,445 (74 %)
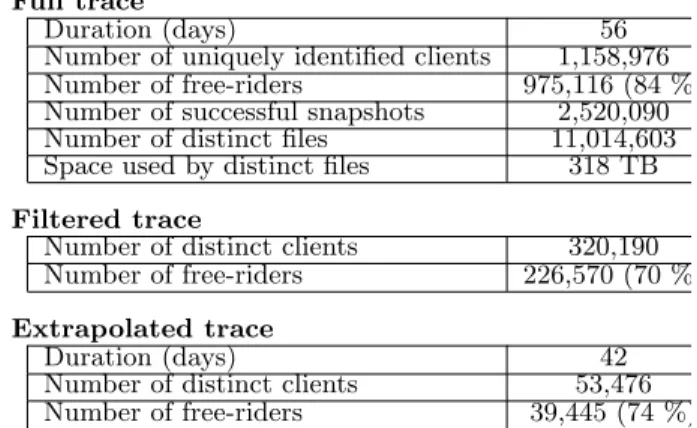
Table 1: General characteristics of the trace. For unknown reason, the proportion of free-riders is lower in the filtered trace, which has no impact on our analysis since we only focus on common files between peers.
0 200000 400000 600000 800000 1e+06 1.2e+06 1.4e+06 1.6e+06 340 350 360 370 380 390 400 0 1000 2000 3000 4000 5000 6000 7000 8000 9000 10000 11000 Number of Files
Number of Non-Empty Caches
Days Files per day Non-Empty Caches per day
Figure 3: After extrapolation, the analy-sis is done from day 348 to day 389, where at least 1,000,000 files and 7,000 interest-ing clients are available.
on average clients share 5 new files per day. The drop at the beginning was caused by a network failure partially interrupting the crawler work for two days.
The general characteristics of the trace are presented in Table 1. We identified over one million distinct peers (29% in France, 28% in Germany, 16% in Spain and only 5% in the US), and 11 million of distinct files. Clients sometimes change either their IP address (DHCP) or unique identifier by reinstalling the software for exam-ple. To avoid taking such clients several times into ac-count in the analysis, we removed all clients sharing either the same IP address or the same unique identifier (and kept the free riders). We call the resulting trace of
320,190 clients thefiltered trace, and all static analysis
results are computed on this trace.
For dynamic analysis, we further filtered this trace to
keep only 53,476 clients in the extrapolated trace, that
were connected at least 5 times over the period, with at least 10 days between the first and the last connec-tion. Out of those 53,000 peers, 38,000 were free-riders.
We then extrapolated peer caches in the following pes-simistic way: for every day where a peer could not be connected to, we assumed that its cache contained the intersection of the files at the previous and at the sub-sequent connection. This is a pessimistic approach for inferring clustering properties of peer cache contents, as this underestimates the actual content.
Figure 3 presents the total number of files crawled per day, after filtering and extrapolation. Based on these results, we decided to perform the dynamic analysis on days 348 to 389 (Dec. 15 - Jan. 25) where at least one million files per day were available, in at least 7,000 non-empty peer caches per day.
The distribution of clients per country is depicted on Figure 4, and shows that a large majority of eDonkey users are in Europe.
0 20000 40000 60000 80000 100000 FR DE ES US IT IL GB TW PL AT NL Others
Number of clients per country 29% 28% 16% 5% 3% 2% 2% 1% 1% 1% 1% 6%
Figure 4: Distribution of clients per coun-try (full trace).
3. PEER CONTRIBUTION AND FILE
POP-ULARITY
In this section, we report on the general peer contribu-tion and file replicacontribu-tion statistics in both static and dy-namic settings. The corresponding results confirm some well-known features of peer to peer workloads: free rid-ers still dominate, and file popularity tends to increase suddenly and decrease gradually. We capture the latter
property by tracking both file rank, and filespreadover
time.
We measure the popularity of a file by the number of replicas (or sources) per file in the system. Most previ-ous studies measured file popularity by the number of requests, which we do not observe. Our measure of pop-ularity reflects the more classical measure, after removal of requests by free-riders.
Figure 5 depicts the distribution of file replication per file rank for all files crawled in a day, for 5 given days. We observe properties similar to those of the Kazaa workloads [12] and the 3 days-Edonkey workload [8]: this distribution, after an initial small flat region, fol-lows a linear trend on a log-log plot. This pattern is thus consistent over time in the e-Donkey network, and consistent over file sharing systems.
Figure 6 depicts the cumulative distribution of file sizes for distinct levels of popularity. We observe that
1 10 100 1000
1 10 100 1000 10000 100000 1e+06 1e+07
Number of Sources per File
File Rank Day 346 (1045906 files) Day 356 (1209811 files) Day 366 (1061890 files) Day 376 (821275 files) Day 386 (679572 files)
Figure 5: Distribution of file replication for 5 days of the extrapolated trace.
0 0.2 0.4 0.6 0.8 1 0.01 0.1 1 10 100 1000 10000 100000 1e+06 1e+07 Proportion of files (CDF) File size (KB) popularity >= 1 >= 5 >= 10
Figure 6: Cumulative distribution of file sizes (filtered trace).
most files are small: 40% of the files are less than 1MB, 50% are between 1 and 10 MB, the typical range for MP3 files. Only 10% of the files are larger than 10MB. However, among files with popularity larger than 5 (re-spectively, larger than 10), about 45 % (re(re-spectively, 55%) of the files are larger than 600MB (these are typ-ically DIVX movies), less than 20 % are between 1MB and 10MB, the typical range for MP3 files, and less than 20 % have sizes between 10 and 600MB, the typ-ical range for complete MP3 albums, small videos and programs. This clearly shows the specialization of the eDonkey network for downloading large files.
Figure 7 presents the number of files and the amount of data shared per client, with and without free-riders. We observe that free-riding (approximatively 80% of the clients) is very common in eDonkey. Most of the remain-ing clients share a few files, 80% of the non free-riders share less than 100 files, but these are large files, since less than 10% of non free-riders share less than 1GB. This feature is common to most peer-to-peer file sharing systems, but this phenomenon is even more pronounced in the eDonkey network, again reflecting its specializa-tion towards large files.
Figure 8 displays the percentage of replication (frac-tion of clients holding a copy of the file) over time for
0 0.2 0.4 0.6 0.8 1 1 10 100 1000 10000 100000 0.01 0.1 1 10 100 1000 Proportion of clients (CDF) Shared Files Shared Space (GB) Files (full) Files (free-riders excluded) Space (full) Space (free-riders excluded)
Figure 7: Files and disk space shared per client (filtered trace).
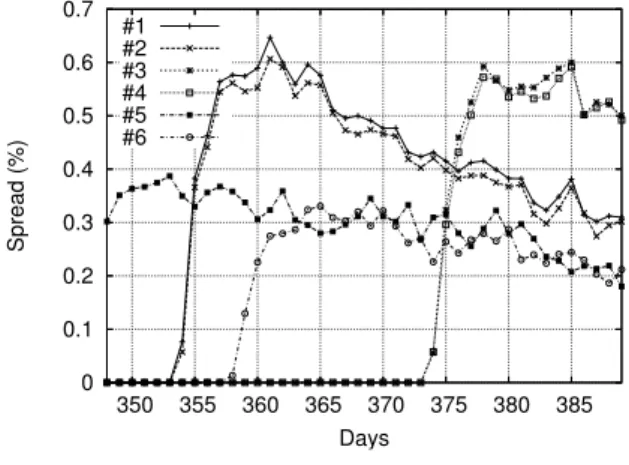
0 0.1 0.2 0.3 0.4 0.5 0.6 0.7 350 355 360 365 370 375 380 385 Spread (%) Days #1 #2 #3 #4 #5 #6
Figure 8: File spread (fraction of users sharing the file) for the 6 most popular files over time (filtered trace).
the 6 most popular files over the measurement period. For 5 of these 6 files, we observe a sudden increase in popularity over a few days, followed by a slow decrease. The maximum number of clients holding a copy of a given file is 372 out of the 53476 clients (day 361). The corresponding fraction of users holding the file is under 0.7%. This suggests that, in systems such as Gnutella where search is based on flooding, a large number of queries are needed to find the target file: for randomly
selected target peers, an average of 1/.007≈143 peers
must be contacted, for the most popular files.
Figures 9 and 10 show the rank of the 5 most popular files of day 348, at the beginning of the trace, and day 367, corresponding to the middle of the trace. Note that these files may differ from the ones evaluated in Figure 8. These figures show that the ranks of popular files tend to remain stable over time, even though the degree of popularity measured by the number of replicas may decrease. We observe on Figure 10 the early life of popular files, whereas Figure 9 illustrates a later phase in the life of popular files with gradual drop in ranking.
10 20 30 40 50 60 70 350 355 360 365 370 375 380 385 Rank Days #1 #2 #3 #4 #5
Figure 9: Evolution of the file ranks, for the top 5 of day 348 (filtered trace).
10 20 30 40 50 60 70 350 355 360 365 370 375 380 385 Rank Days #1 #2 #3 #4 #5
Figure 10: Evolution of the file ranks, for the top 5 of day 367 (filtered trace).
4. CLUSTERING PATTERNS
In this section, we analyze the clustering character-istics of the workload along two directions. We first consider the geographical dispersion of users sharing a file, both at the country and Autonomous System (AS) level.
We then focus on the degree of overlap between peer cache contents. We capture the latter by a suitable cor-relation measure, and also report on the dynamics of such overlap. We use an original trace randomization technique to assess which part of the observed cluster-ing in cache contents is attributable to the presence of generous peers or popular files, and which part is at-tributable to the presence of genuine specific peer inter-ests.
4.1
Geographical clustering patterns
For each file, we define its home country and home autonomous system (AS) as the one to which most of the file sources belong. Figure 11 and Figure 12 show the cumulative distribution function of the fraction of sources that belong to the home country and AS respec-tively. The different curves on the graphs show how the
distribution varies as a function of the average
0 0.2 0.4 0.6 0.8 1 0 20 40 60 80 100 Proportion of files (CDF)
Proportion of sources in main country 1 5 10 20 50 100
Figure 11: Distribution of files
accord-ing to the number of sources in the main country (filtered trace).
0 0.2 0.4 0.6 0.8 1 0 20 40 60 80 100 Proportion of files (CDF)
Proportion of sources in main autonomous system 1 5 10 20 50 100
Figure 12: Distribution of files according to the number of sources in the main au-tonomous system (filtered trace).
file is defined as the number of distinct sources of this file, divided by the number of days during which the file was seen in the trace. For example on Figure 11, we observe that 50% of files with an average popularity greater than or equal to 20 have all their sources in the same country, while this is the case for only 10% of the files with a popularity greater than or equal to 50. In both figures, there is a clear distinction between popu-lar and non popupopu-lar files. The geographical clustering tends to be more pronounced for non popular files.
Table 2 shows that a large proportion of the clients of the trace (54%) are connected to one of five autonomous systems. This leaves a clear opportunity to leverage this tendency at AS level.
The results displayed above reveal that clients belong-ing to the same area are more likely to share some inter-est. Recently some propositions to exploit this property at the network level have been made. PeerCache [21] is a cache installed by network operators in order to limit the impact of peer-to-peer traffic on their bandwidth. A cache is shared between clients belonging to the same AS for example and limits the impact of peer-to-peer traffic on the bandwidth. To avoid the issue of network
AS Global National Name
3320 21 % 75 % Deutsche Telekom AG
3215 15 % 51 % France Telecom Transpac
3352 8 % 50 % Telefonica Data Espana
12322 7 % 24 % Proxad ISP France
1668 3 % 60 % AOL-primehost USA
Table 2: The 5 first autonomous systems in-volved in the eDonkey network, according to the number of hosted clients, among all Edon-key clients (Global) or among clients in the same country (National).
operators storing potential illegal contents, caches may contain index rather than content.
4.2
Semantic clustering patterns
4.2.1
Clustering correlation
0 20 40 60 80 100 1 10 100 1000 10000Probability for Another Common File (%)
Number of Files in Common
All shared files of day 348 (extrapolated trace) Audio files, popularity in [1..10] (full trace) Audio files, popularity in [30..40] (full trace)
Figure 13: Probability to find additional files on neighbours, given number of files already found, based on data from day 348. Note the higher probabilities for rare audio files.
Figure 13 displays the clustering correlation between every pair of peers. The correlation is measured as the probability that any two clients having at least a given number of files in common share another one. This is a meaningful index, as it reflects the probability that a peer who has been able to answer a certain number of queries from another peer in the past will be able to answer another query from the same querier in the future.
The shape of the curve is similar for all extrapolated days, so we only plot the curve for day 348. We observe that this curve increases steeply with the number of files in common. If some clients have a small number of files in common, the probability that they will share another one is very high. For audio files, we observe in particular that unpopular files are more subject to clustering.
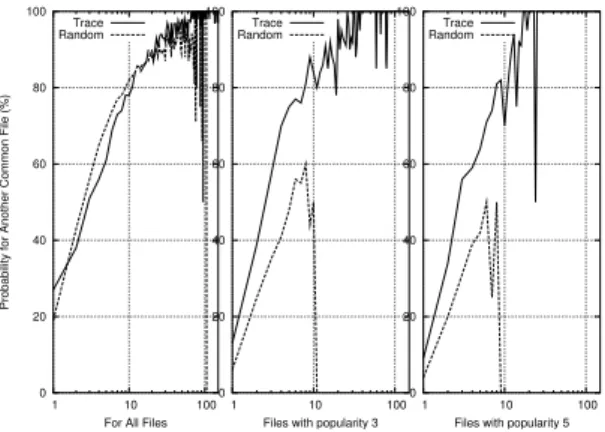
Figure 14 shows the difference between clustering ob-served on the real trace and on the randomized trace, derived from the real one. The precise technique used for randomizing the trace is described in the appendix.
0 20 40 60 80 100 1 10 100
Probability for Another Common File (%)
For All Files Trace Random 0 20 40 60 80 100 1 10 100
Files with popularity 3 Trace Random 0 20 40 60 80 100 1 10 100
Files with popularity 5 Trace Random
Figure 14: Comparison of clustering cor-relation between the trace and a random-ized distribution (filtered trace).
In short, it amounts to do random file swappings be-tween peer caches, in a way that preserves peer gen-erosity and file popularity, while destroying any other structure in the trace. It thus removes any locality of interest initially present in the trace. The decrease in clustering after randomization results thus from the re-moval of such locality of interest.
In the left graph, we observe that there is almost no difference in clustering between the two traces. This is mainly due to the presence of popular files, which are present on the same clients with a high probability.
Therefore, the effect ofgenuineinterest-based clustering
is almost entirely masked by the presence of popular files. In order to suppress this effect, we conducted the same experiments on two low levels of popularity, 3 and 5 respectively, displayed on the middle and right graphs. We observe a significant difference in the measure of the clustering metric, indicating that clustering of interest for these files is indeed present.
4.2.2 Dynamic measurements
0 1 2 3 4 5 6 7 8 9 10 345 350 355 360 365 370 375 380 385 390Common Files Mean
Days
10 Common Files, 577 Pairs 9 Common Files, 743 Pairs 8 Common Files, 1158 Pairs 7 Common Files, 1645 Pairs 6 Common Files, 2734 Pairs 5 Common Files, 5713 Pairs 4 Common Files, 11525 Pairs 3 Common Files, 24248 Pairs 2 Common Files, 81394 Pairs 1 Common Files, 345898 Pairs
Figure 15: Evolution of overlap between pairs of clients over time. Each curve cor-responds to a set of pairs of clients having a given overlap on the first day (extrapo-lated trace).
Figures 15, 16 and 17 present the evolution of the
overlap in cache contents between pairs of clients ini-tially sharing between respectively 1 and 10 files, 20 and 57 files and over 157 files. For the sake of readabil-ity, we chose to represent only a few typical values for the initial cache content overlap in the last two graphs. In Figure 15, we observe that the overlap tends to decrease over the 45 days period in a very homoge-neous fashion for all curves. For such pairs of clients with initial overlap between 1 and 10, this smooth de-cay in overlap is explained by the fact that at latter times the overlap consists essentially of those initially common files that are still shared by both clients. In other words, these clients no longer share interests.
In contrast, in Figure 16, we observe long plateaux;
see for example the pairs having 51 files in common, this level of clustering remains stable for 20 days. Even if there is a decrease in overlap, we still observe some stable period (see pairs sharing 57 files for example) after 15 days. We thus observe that, when the overlap between caches is higher, it remains at a high level for a longer period of time. This observation is confirmed by the results of Figure 17 for even larger initial overlaps.
These observations suggest that high overlap is sus-tained over durations as long as 45 days.
As mentioned in Section 2, the trace is highly dynamic (about 5 cache replacements per client per day), and this indicates that the files in the intersection of two peers’ caches change over time. Therefore these results suggest that interest-based proximity between peers is maintained over time.
0 10 20 30 40 50 60 345 350 355 360 365 370 375 380 385 390
Common Files Mean
Days
57 Common Files, 3 Pairs 51 Common Files, 6 Pairs 45 Common Files, 6 Pairs 40 Common Files, 4 Pairs 35 Common Files, 17 Pairs 30 Common Files, 18 Pairs 25 Common Files, 22 Pairs 20 Common Files, 56 Pairs
Figure 16: Evolution of overlap between pairs of clients over time (extrapolated trace).
5. EXPLOITING SEMANTIC
PROXIM-ITY
In this section we evaluate the effectiveness of search mechanisms relying on semantic neighbours, such as those recently proposed in [28, 30, 13], by means of trace-driven simulations. We first describe the simu-lation methodology and the basic search mechanisms, and then give the resulting evaluations.
We identify to what extent the good results observed stem from the presence of generous peers and popu-lar files, or from genuine interest-based (semantic) peer
0 50 100 150 200 250 300 350 345 350 355 360 365 370 375
Common Files Mean
Days
327 Common Files, 6 Pairs 172 Common Files, 3 Pairs 161 Common Files, 1 Pairs 159 Common Files, 3 Pairs
Figure 17: Evolution of overlap between pairs of clients over time (extrapolated trace).
clustering. We also address load-balancing issues aris-ing from the use of semantic neighbours for answeraris-ing queries.
5.1
Simulation Methodology
The simulations in this section are based on the fil-tered, static trace. For each peer, we use its cache con-tent in the trace as the pocon-tential set of files it will request during the simulation.
This is clearly an approximation of the actual requests made by peers during the trace collection, as this ig-nores requests made by free-riders, and may assume a peer requested a document which in fact was initally contributed to the system by that peer. However, we be-lieve the approximation to be accurate, especially since the statistical characteristics of requests, as described in [12] and of shared contents, as described in the pre-vious sections and in [8] are very similar.
The precise request generation mechanism we use is
as follows. We successively pick at random a peerpand
a filef in its set of files to be requested. Filef is then
removed from the list of requests to be made by peer
p. If no other peer sharesfyet, we then assume thatp
is the original contributor off to the system, and add
f to the cache of files shared by p. However, if f is
already shared by other peers in the system, we then
simulate a request for filefby peerp. In particular, we
letpquery its semantic neighbours forf, and measure
whether such queries have been successful or not. If
this is a failure, we assume thatpwould then resort to
a fall-back mechanism for obtainingf(either via server
access, or via flooding as in Gnutella). In any case, we
addf to the cache of peerp. We iterate this procedure,
again selecting a peer and a candidate file request.
5.2 Semantic neighbours selection
mecha-nisms
We tried several algorithms for managing the seman-tic neighbour lists. We focused parseman-ticularly on the LRU (Least Recently Used) strategy, very popular in the con-text of cache memory management, and already sug-gested in the present context in [30].
According to LRU, each peer sets the length of its
list of semantic neighbours. Whenever it retrieves a file from an uploader, the uploading peer is placed at the head of the list of semantic neighbours, thus potentially evicting the last member of the list when the uploader has been found using a fallback search mechanism. The only design parameter here is the list length.
We have also considered the so-called History-based
strategy proposed in [30] for maintaining the lists of se-mantic peers. This is also known in the context of cache management as the frequency-based policy. It amounts to maintaining counters of the number of successful up-loads obtained from peers, and keeping only those with the highest counts in the list.
Finally, we used as a benchmark randomly selected lists of peers.
5.3
Experimental results
The objective of these experiments is to measure the efficiency of semantic neighbours in answering queries. We also aim to understand which factors account for this efficiency. We identify three such factors: the pres-ence of generous peers; the prespres-ence of popular files; the presence of underlying semantic relationships between peers. Finally, we look at the distribution of the load generated by semantic neighbour-based queries.
5.3.1 Baseline scenario
Figure 18 shows the hit rate, depending on the num-ber of semantic neighbours contacted using the LRU and History algorithms for maintaining semantic neigh-bour lists. When searching for a given file, if the file can be fetched using only the semantic neighbours it is considered as a hit. As seen in the graph we observe a significant hit ratio: for example by using 20 semantic neighbours one can achieve hit rates of 41% and 47% with LRU and History respectively. One could think that these high ratios are due to the presence of highly popular files. However, if this were the case the hit rates for randomly selected queried nodes would be as high, which is obviously not the case.
0% 10% 20% 30% 40% 50% 60% 70% 80% 90% 100% 0 20 40 60 80 100 120 140 160 180 200 Number of Semantic Neighbors
Hits
(%)
LRU History Random
Figure 18: Performance of semantic
neighbour-based search: LRU, History
and random algorithms.
5.3.2
Impact of peer generosity and file
We now investigate whether such high hit rates stem from the presence of generous peers, that would become semantic neighbours of many peers, and be able to an-swer many queries, even though there is no underlying specific common interest between those peers. It is a well known fact that in peer-to-peer networks a large fraction of files is offered by few peers. The trace used in the present simulation is no exception: here, the top 15% peers offer 75% of the files.
To evaluate the impact of such generous peers on ef-fectiveness of semantic neighbours search, we re-ran the experiments after removal of the 5, 10 and 15% most generous uploaders from the non free-riders. Figure 19 shows the results of this simulation, using LRU. For the purpose of comparison the hit rate with all uploaders is also included. The hit rate is significantly reduced, by 10% for short neighbour lists to 20% for lists of size 200. However, even with 15% of the most generous upload-ers removed, the remaining hit rate is significant (e.g., above 30% with 20 semantic neighbours). This again reflects the presence of underlying semantic clustering between peers. 0% 10% 20% 30% 40% 50% 60% 70% 80% 90% 100% 0 20 40 60 80 100 120 140 160 180 200
Number of Semantic Neighbours
Hits ( %)
With All Uploaders Without Top 5% Without Top 10% Without Top 15%
Figure 19: Performance of semantic
neighbour-based search: LRU, without
the 5-15% most generous uploaders.
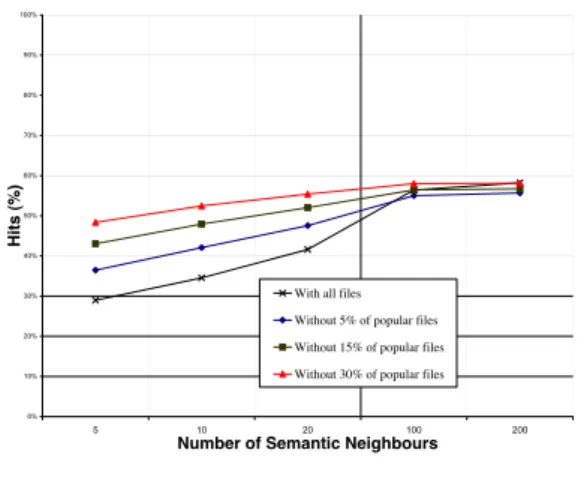
We now return to the influence of file popularity on the effectiveness of semantic neighbour search. Figure 20 shows the results of the simulations after removal of 5, 15 and 30% of the most popular files. It should be noted that the number of simulated requests decreases significantly as we remove the requests to the most pop-ular files: for 5%, 15% and 30% of the most poppop-ular files removed, the number of remaining requests is 67%, 48% and 33% respectively. We observe first that the hit ra-tio is significantly increased when we remove the most popular files. Secondly, this increase is larger for shorter semantic neighbour lists. For example, for lists of length 5, the hit ratio using LRU on all files is a bit less than 30% and increases to almost 50% after removal of 30% of the most popular files.
From these observations, we conclude that the clus-tering degree between peers is even more significant for rare files: this confirms the results obtained in Section 4. This result is very interesting as rare files are usually the most difficult ones to locate in a peer to peer file sharing
Number of Semantic Neighbours 5 10 20
LRU (%) 28 34 41
LRU without top 5% uploaders (%) 21 26 33
LRU without 5% popular files (%) 36 42 47
LRU without both 1 and 2 (%) 25 30 34
LRU without top 15% uploaders (%) 19 24 31
LRU without 15% popular files (%) 43 47 52
LRU without both 3 and 4 (%) 28 30 31
Table 3: Combined influence of generous upload-ers and popular files on the hit ratio.
system [18]. Therefore, implementing semantic links is more relevant for these files and may yield significant gains in search performance. In this context, a chal-lenging issue is to identify such rare files so that the semantic neighbour lists are not contaminated by links to peers serving requests to popular files. We note that thepopularityalgorithm, proposed in [30] to manage se-mantic lists, solves this issue in the context of flooding-based systems, by implicitly infering the popularity of requested files.
Table 3 summarizes the influence of the generous up-loaders and the popular files: it compares the hit ratio without the 5% & 15% most generous uploaders and 5% & 15% of popular files against the hit ratio with all the files (the 2nd row). For example, 3rd and 4th row show hit ratio without generous uploaders and popular files with semantic neighbours of 5, 10, 20 (LRU). The 5th row, for example, shows the removal both 5% of generous uploaders and 5% of popular files.
These results show that popular files and generous uploaders have opposite effects on the hit ratio.
0% 10% 20% 30% 40% 50% 60% 70% 80% 90% 100% 5 10 20 100 200
Number of Semantic Neighbours
Hits
(%)
With all files Without 5% of popular files Without 15% of popular files Without 30% of popular files
Figure 20: Performance of semantic
neighbour-based search: LRU, without
the 5-15% most popular files.
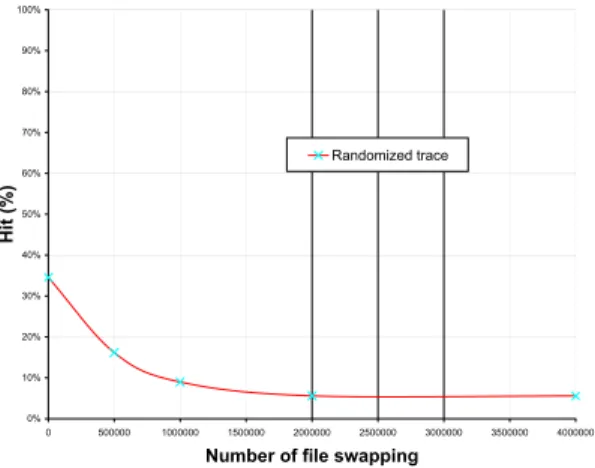
To complement the study of which part of the hit ratio is attributable to the underlying semantic clustering of peers, and which part results from the combined file popularity and peer generosity, we proceed as follows.
We re-run the simulation on a “randomized” version of the original (full) trace, obtained from the algorithm described in the Appendix. This random file swapping algorithm destroys semantic clustering, while generous uploaders and popular files retain their status in the
0% 10% 20% 30% 40% 50% 60% 70% 80% 90% 100% 0 500000 1000000 1500000 2000000 2500000 3000000 3500000 4000000
Number of file swapping
Hit
(%)
Randomized trace
Figure 21: Performance of semantic
neighbour-based search: LRU and
ran-domized trace
randomized trace. Figure 21 illustrates how the hit rate obtained from querying 10 semantic neighbours chosen according to LRU decreases as the number of swappings increases, i.e. as we further randomize the trace. Note that the hit rate of the full trace (non randomized) is shown when the number of swapping is zero (x=0), and equals 35%. The hit rate decreases down to 5%, which is the part of the hit rate that can be explained by generous uploaders and popular files. The difference of 30% between the two values can be accounted for only by genuine semantic proximity between peers.
5.3.3 Distribution of query load
1 10 100 1000 10000 100000 0 2000 4000 6000 8000 10000 12000 14000 16000 18000 13433 1347 710
Messages per client
Client by rank
All uploaders (720k reqs, mean 187 msgs/client) Without 5% top uploaders (387k reqs, mean 105 msgs/client) Without 10% top uploaders (289k reqs,mean 81 msgs/client) Without 15% top uploaders (226k reqs, mean 66 msgs/client)
Figure 22: Distribution of load among
peers using LRU, without the 5-15% most generous uploaders.
Figure 22 depicts the distribution of load, expressed in number of requests, after removal of 5 to 15% of the most generous uploaders. In this experiment we used LRU lists of size 5.
Although the total number of requests decreases from 720k to 387k, 289k and 226k when 5%, 10% and 15% re-spectively of the top uploaders are removed, we observe that the load is more evenly distributed, as expected. For instance, after removal of 10% of the top uploaders,
while the average number of requests per peer is reduced from 187 to 81, the heaviest peer load is reduced from 13,433 to 710, a more dramatic reduction. This gives ev-idence that, even if generous peers chose not to answer queries above a certain level, enough queries can be an-swered, and the search performance would not collapse. Note that the free-riders are not present in semantic lists as they do not provide any contents.
5.3.4
Transitivity of the semantic relationship
0% 10% 20% 30% 40% 50% 60% 70% 80% 90% 100% 0 20 40 60 80 100 120 140 160 180 200
Number of Semantic Neighbours
Hits
(
%
)
With 2nd hop neighbours With 1 hop neighbours With 2nd hop neighbours; without top 5% uploaders
With 2nd hop neighbours; without top 15% uploaders
Figure 23: Performance of semantic
neighbour-based search: LRU, two-hop
search, with and without most generous uploaders.
Finally, we test the transitivity of the semantic re-lationship between peers. In other words, we
investi-gate whether the semantic neighbours of my
seman-tic neighbours are my semanseman-tic neighbours, and there-fore can help when searching for files. That is, a peer first queries its semantic neighbours, and upon failure, queries in turn its two hop-distant semantic neighbours. This can be viewed as forming a semantic overlay on top of the peer-to-peer overlay, and searching files at the se-mantic neighbours that are two hops away. Figure 23 displays the resulting hit ratio as a function of the size of individual semantic neighbour lists. It appears clearly that semantic relationships between peers that are two hops away exist, as two hop-remote peers can answer a significant fraction of queries.
We conducted the same experiments after removing from 5 to 30% of the most replicated files and observed similar trends as for 1 hop semantic search. The hit ratio for the two hop semantic search is increased from 32% when semantic lists are composed of 5 semantic neighbours and all files are taken into account to 40%, 45% and over 50% when respectively 5%, 15% and 30% of the most popular files are ignored. As the number of semantic neighbours increases, the discrepancy de-creases.
This again confirms that rare files are more subject to clustering.
6. RELATED WORK
There are mainly four different ways to collect infor-mation on peer-to-peer file-sharing systems: (1) spying a group of users [12], (2) getting the logs of a real server [11], (3) using an instrumented client [8] and (4) using an instrumented server. The first approach gives lim-ited results, first because network sniffing cannot collect encrypted information, and second because the results are biased, as the group of users is often homogeneous and geographically limited – students in a university for example. The second approach is mainly limited by what servers can collect – they have no direct access to inter-clients communications, and must trust them if such information is collected – and by what admin-istrators accept to release – no file names, completely anonymous data, etc... In the third approach, the infor-mation is mainly limited by what clients accept to com-municate to other clients. In particular, in our case, we took advantage of a feature which has now disappeared on most file-sharing clients, making the collection of a similar trace almost impossible now. Finally, the fourth approach seems promising, and we are currently inves-tigating such an approach on the Fasttrack network.
A number of studies have recently been conducted to analyze the behavior of peers and the characteristics of existing file sharing system networks. Saroiu et al. [25] studied the peer characteristics of both the Nap-ster and Gnutella networks. They concluded that there are significant disparities between peers in terms of ca-pacities and behavior. More recently, Gummadi et al. [12] conducted a 200 day analysis of the Kazaa net-work at the University of Washington. This analysis extracted a number of general patterns of sharing prop-erties, and was used as a basis to model peer-to-peer systems. The Kazaa and Gnutella networks were also evaluated in the context of content delivery networks [24], in which authors analyzed the caching potential of such networks. Another measurement-based evaluation of the Fasttrack protocol (Kazaa) [16] focuses on the po-tential of caching mechanisms in peer-to-peer systems. The results of a seven day crawl of the Overnet peer-to-peer file sharing system [2], focusing on peer-to-peer availability, demonstrate that there is a significant turnover and a non negligible impact of IP aliasing that should be taken into account in the design of peer-to-peer systems. A theoretical analysis of a peer-to-peer network [17] was also proposed along the recurrent concern of frequent node arrivals and departures.
Peer availability, sharing patterns and Internet band-width usage have been major concerns in previous works; the main objectives were to study the impact of peer fre-quent arrivals and departures in the design of to-peer systems as well as the potential of caching on to- peer-to-peer workloads. We instead focused on the emergent clustering properties of such workloads, and how they might be leveraged for improving search performance.
Recently eDonkey has been identified as the main competitor of Kazaa, and is ahead of Kazaa in Europe. As a consequence, eDonkey has generated a lot of inter-est and some important results have been obtained. An analysis [29] of the eDonkey traffic observed outside the University of Wurzburg during 12 days focuses on the network-level properties of the traffic, i.e. the amount
of administrated bandwidth used compared to down-loads, and the “mice and elephants” effect on the net-work. Besides, analyses of two logs of an eDonkey server have been proposed [11, 10]. Those papers mainly focus on short-term dynamic behavior of clients (request fre-quency, etc.) and on the graph of clients related through the server. From the clustering point of view, interest-ing results report that around 20% of the edges of the exchange graph are bidirectional, and that cliques — subsets of clients all connected to each other — of size 100 and higher exist among the server clients. Another recent work [8] analyzes a three day crawl of eDonkey clients, and demonstrates the presence of semantic clus-tering.
The smart downloading algorithm of the Bittorrent network has also seduced a large number of clients re-cently. An analysis of a 5-months logs of the Bittorrent tracker [3] used during the diffusion of Linux Redhat 9 has been provided [14]. The Bittorrent protocol can be seen as a subset of eDonkey, where all clients interested
in a file are connected to the same server: the tracker.
Consequently, the analysis mainly focuses on the down-load properties (number of updown-loaders and downdown-loaders, download and upload rates, session times) and is or-thogonal to our work.
The use of semantic neighbours for increasing search performance has been first evaluated on a real trace by Sripanidkulchai et al. [28]. Although better results were obtained on a Web trace, they also evaluated their scheme on a peer-to-peer workload. Their experimental results suggest that simple, light-weight techniques ex-ploiting semantic structure in an implicit manner may yield to significant gains in search performance. Al-though this was not the purpose of the paper, these results also attest of semantic clustering in peer-to-peer file sharing systems. Similar results have been obtained on a synthetic trace [30].
More recently, an epidemic-based approach has been proposed in [31] relying on a two-tier architecture. A bottom epidemic-based protocol ensures connectivity in the unstructured overlay network. On top of it, a sec-ond epidemic-based protocol clusters peers according to their semantic interest. The results were obtained using our first eDonkey trace [8] and demonstrate the interest of exploiting clustering properties in such systems.
7. CONCLUSION
Peer-to-peer file sharing is now the main source of Internet traffic, and as such offers important challenges. In particular, a good understanding of the generated workloads is needed, but remains elusive, partly because of the gigantic scale of such systems.
In this paper, we analyzed a two-month trace of the eDonkey network, collected from 2.5 millions connec-tions to clients scattered around the world. In addi-tion to the extracaddi-tion of general sharing patterns, which corroborate the results obtained in other measurement studies on various networks and different settings (see Section 6), we considered dynamic properties of the trace. We analyzed the evolution of cache contents, thereby gaining some understanding in the dynamics of file popularity. We observed that the sharing distri-bution is skewed: a few clients share most of the files,
both in terms of size and number of files. The popu-larity of very popular items tends to remain stable over the trace. We observed that the workload is highly dy-namic: clients share a roughly constant number of files over time, but the turnover is high.
We demonstrated the presence of clustering, both ge-ographical and semantic, between clients in peer-to-peer file sharing workloads. We based our analysis on a suit-able correlation metric between clients, based on the overlap between cache contents. This analysis demon-strated that semantic clustering is even stronger for rare files. We also evaluated some simple strategies for ex-ploiting the semantic relationships between peers to pro-vide alternative, server-less search mechanisms. The ob-served efficiency indirectly indicates the presence of se-mantic clustering between peers, but is of interest in itself. We ran modified experiments to isolate different potential factors responsible for the good performance of these simple search heuristics.
We conclude that clustering is definitely present, be it geographical or semantic, and is worth exploiting in a number of applications.
We have now started an implementation of semantic
links in an eDonkey client, MLdonkey, and will soon
report results on their efficiency.
8. REFERENCES
[1] E. Adar and B.A. Huberman. Free riding ongnutella.First Monday, Internet Journal, October
2000.
[2] R. Bhagwan, S. Savage, and G. Voelker.
Understanding availability. InProceedings of the
2nd International Workshop on Peer-to-Peer Systems (IPTPS’03), 2003.
[3] Bittorrent. http://bitconjurer.org/BitTorrent/. [4] S. Le Blond, J.-L. Guillaume, and M. Latapy.
Clustering in p2p exchanges and consequences on
performances. InIPTPS’05.
[5] Y. Chawathe, S. Ratnasamy, L. Breslau,
N. Lanham, and S. Shenker. Making gnutella-like
p2p systems scalable. InProceedings of ACM
SIGCOMM’03, 2003. [6] Edonkey.
http://www.edonkey2000.com/index.html. [7] F. Le Fessant. Mldonkey, a multi-network
file-sharing client. http://www.mldonkey.net/, 2002.
[8] F. Le Fessant, S. Handurukande, A.-M. Kermarrec, and L. Massouli´e. Clustering in
peer-to-peer file sharing workloads. InIPTPS’04.
[9] Gnutella. http://www.gnutella.com.
[10] J.-L.. Guillaume and S. Le-Blond. P2p exchange
network: measurement and analysis. InSubmitted
to IMC’04.
[11] J.-L. Guillaume and S. Le-Blond. Statistical properties of exchanges in p2p systems. In
PDPTA’04.
[12] K.P. Gummadi, R.J. Dunn, S. Saroiu, S.D. Gribble, H.M. Levy, and J. Zahorjan. Measurement, modeling and analysis of a
peer-to-peer file-sharing workload. InSOSP’03.
[13] S. Handurukande, A.-M. Kermarrec, F. Le Fessant, and L. Massouli´e. Exploiting semantic clustering in the edonkey p2p network. In
SIGOPS’2004.
[14] M. Izal, G. Urvoy-Keller, E.W. Biersack, P. Felber, A. Al Hamra, and L. Garc´es-Erice. Dissecting bittorrent: Five months in a torrent’s
lifetime. InPAM’04, 4 2004.
[15] Kazaa. http://www.kazaa.com/.
[16] N. Leibowitza, A. Bergman, R. Ben-Shaul, and A. Shavit. Are file swapping networks cacheable?
characterizing p2p traffic. InWCW’02, 2002.
[17] D. Liben-Nowell, H. balakrishnan, and D. Karger. Analysis of the evolution of peer-to-peer networks. InPODC’02.
[18] B. T. Loo, R. Huebsch, I. Stoica, and
J. Hellerstein. The case for a hybrid p2p search
infrastructure. InIPTPS’04.
[19] S. Marti, P. Ganesan, and H. Garcia-Molina. Dht
routing using social links. InIPTPS’04.
[20] M. Naor and U. Wieder. Know thy neighbor’s neighbor: better routing for skip-graphs and small
worlds. InProceedings of the 3rd International
Workshop on Peer-to-Peer Systems IPTPS’04, 2004.
[21] Peercache.
http://www.joltid.com/index.php/peercache/. [22] D. Plonka. Napster traffic measurement. Technical
report, University of Wisconsin-Madison, 2000. [23] R. Rivest. RFC 1320: The MD4 message-digest
algorithm, April 1992. Status: INFORMATIONAL.
[24] S. Saroiu, K. P. Gummadi, R. Dunn, S. D. Gribble, and H. M. Levy. An analysis of Internet
content delivery systems. InOSDI’02.
[25] S. Saroiu, P. K. Gummadi, and S.D. Gribble. A measurement study of peer-to-peer file sharing
systems. InIn Proceedings of Multimedia
Computing and Networking (MMCN’02), 2002. [26] S. Sen and J. Wang. Analyzing peer-to-peer traffic
across large networks. InProceedings of the ACM
SIGCOMM Internet Measurement Workshop
2002, 2002.
[27] Slyck. http://www.slyck.com/.
[28] K. Sripanidkulchai, B. Maggs, and H. Zhang. Efficient content location using interest-based
locality in peer-to-peer systems. InProceedings of
IEEE INFOCOM’03, 2003.
[29] K. Tutschku. A measurement-based traffic profile
of the edonkey filesharing service. InPAM’04.
[30] S. Voulgaris, A.-M. Kermarrec, L. Massouli´e, and M. van Steen. Exploiting semantic proximity in
peer-to-peer content searching. InProceedings of
10th IEEE International Workshop on Future Trends of Distributed Computing Systems FTDCS’04, 2004.
[31] S. Voulgaris and M. van Steen. Epidemic-style management of semantic overlays for
content-based searching. InInt’l Conf. on Parallel
and Distributed Computing (Euro-Par), Int’l Conf. on Parallel and Distributed Computing (Euro-Par), August 2005.
[32] H.J. Wang, Y.-C. Hu, C. Yuan, Z. Zhang, and Y.-M. Wang. Friends troubleshooting networks: towards privacy-preserving, automatic,
troubleshooting. InProceedings of the 3rd
International Workshop on Peer-to-Peer Systems IPTPS’04, 2004.
Appendix: Trace randomization algorithm
The goal of the randomization procedure is to modify a collection of peer cache contents so that the peer gen-erosity (number of files cached per peer) and the file popularity (number of replicas per file) are maintained, while any other structure –in particular, interest-based clustering between peers– is destroyed.
The original trace consists of a list of peers, together with the list of their cache contents.
To this end, we use the following randomization algo-rithm, based on swappings.
1. Pick a peeruwith a probability|Cu|/(Pallpeersw|Cw|),
where |Cw| is the size of the file collectionCw of
peerw.
2. Pick a file f, uniformly from Cu (i.e. each with
probability 1/|Cu|).
3. Iterate on steps 1) and 2) to obtain another random
peerv, and a random filef" fromCv.
4. Update the two collections Cu, Cv, by swapping
documentsf andf": Cuis nowCu−f+f", and
Cv=Cv−f"+f. This is done only iff"is not in
Cuoriginally, andf is not inCv either.
It can be shown that after a sufficient number of iter-ations, this algorithm effectively returns a randomized trace meeting our requirements. More precisely, it is a random trace which is uniformly distributed among all traces with the required peer generosity and file popu-larity characteristics.
It can also be shown that it is enough to iterate only
(1/2)∗N∗ln(N) many times, whereN :=Pu|Cu|is