Tasha Fairfield
, Michel Jorratt
Top income shares, business profits, and
effective tax rates in contemporary Chile
Working paper
Original citation:
Fairfield, Tasha and Jorratt, Michel (2014) Top income shares, business profits, and effective tax rates in contemporary Chile. ICTD working paper, 17. Institute of Development Studies,
Brighton, UK. ISBN 9781781181508 DOI: 10.1111/roiw.12196
Originally available from the Institute of Development Studies
Research funded by the International Centre for Tax and Development, Sussex, UK. This version available at: http://eprints.lse.ac.uk/56016/
Available in LSE Research Online: December 2014 © 2014 Institute of Development Studies
LSE has developed LSE Research Online so that users may access research output of the School. Copyright © and Moral Rights for the papers on this site are retained by the individual authors and/or other copyright owners. Users may download and/or print one copy of any article(s) in LSE Research Online to facilitate their private study or for non-commercial research. You may not engage in further distribution of the material or use it for any profit-making activities or any commercial gain. You may freely distribute the URL (http://eprints.lse.ac.uk) of the LSE Research Online website.
Top Income Shares, Business Profits, and Effective Tax Rates in Contemporary Chile*
November 2014,
Updated from ICTD Working Paper 17
Tasha Fairfield
London School of Economics T.A.Fairfield@lse.ac.uk
Michel Jorratt
Director, Servicio de Impuestos Internos Santiago, Chile
Abstract
We contribute to research on inequality and world top incomes by presenting the first calculations of Chilean top income shares and effective tax rates using individual tax-return microdata from 2005 and 2009. We pay special attention to business income, which dominates at the top. Our analysis includes not only distributed profits, but also the large proportion of accrued profits retained by firms, which are rarely analyzed given the difficulty of identifying individual owners. Our most conservative top 1% income-share estimate is 15%—the fifth highest in the top incomes literature. When distributed profits are adjusted for evasion, the top 1% share reaches 22-26%. When we broaden the income concept to include accrued profits, which we impute to taxpayers using ownership shares calculated from business tax forms, the top 1% share increases to a minimum of 23%. Despite this impressive income concentration, the top 1% pays modest average effective income-tax rates of 15–16%.
Keywords
Top incomes, inequality, taxation, Chile, Latin America
*Research funded by the International Center for Tax and Development, Sussex, UK. We thank the Chilean Servicio de Impuestos Internos for their generous cooperation in providing access to tax agency data. We are grateful to four anonymous ICTD reviewers as well as Emmanuel Saez and Berkay Ozcan for helpful comments.
1. Introduction
Latin America has long been recognized as the region characterized by the world’s most extreme levels of inequality. A growing body of research in economics and political science strives to understand the causes and consequences of inequality in Latin America, as well as prospects for redistribution and equitable development.1 However, most empirical research on inequality in Latin America draws on household surveys, which fail to capture information about the very rich.2 Atkinson and Piketty (2009, 2010) and their collaborators have demonstrated that income tax return data provide far more accurate information on top income shares, even where under-reporting is widespread. To date, however, only a handful of developing countries have been analyzed in this literature, given the difficulty researchers have faced in obtaining access to detailed income-tax return data.3
This paper contributes to research and public debate on inequality and redistribution and helps broaden the scope of developing countries analyzed in the top incomes literature by estimating Chilean income shares and effective tax rates from original new datasets compiled with the generous cooperation of Chile’s Servicio de Impuestos Internos (SII). Whereas most studies in the top incomes literature rely on tabulated tax-return data or samples of individual tax returns, we obtained access to the full universe of individual Chilean tax returns for 2005 and 2009.4 We are therefore able to directly report income shares and effective tax rates for top-income fractiles without recourse to fitting or extrapolation techniques. Our analysis accordingly provides the most accurate description of top income shares, income compositions, and tax rates available for contemporary Chile, a country of special interest in Latin America given its
reputation for successful poverty reduction, economic growth, and political stability that have nevertheless coexisted with high levels of inequality and popular disaffection.5 Using our two years of microdata in conjunction with the limited tabulated data published by the SII, we also estimate more approximate top shares for 2004–2011.
A novel feature of this paper is our analysis of not only business profits that are formally distributed to individual taxpayers, but also the very large proportion of profits that are
perpetually reinvested in Chilean firms. We thus contribute to emerging research on income from wealth and capital—whether realized or not (Atkinson 2009b,Atkinson and Piketty 2010, Smeeding and Thompson 2010, Roine and Walderström 2012, Piketty and Zucman 2014). Capital income has long been recognized to augment inequality, but it is rarely analyzed given
1Birdsall and Londoño (1997), World Bank (2004), Acemoglu and Robinson (2005), Goñi et al. (2011), Lustig et al.
(2012), Haggard and Kaufman (2012), Huber and Stephens (2012), Schneider (2013), Fairfield (2015).
2The rich tend to be underrepresented or absent from survey samples given their tiny numbers; sampling procedures
are not designed to include them. Moreover, they are more likely than average citizens to refuse to participate. See Atkinson et al. (2010: 669), Korinek et al. (2006), Székeley and Hilgert (1999), Groves and Couper (1998).
3A few Latin American countries make limited information available. Argentina publishes statistics for the tiny
minority (approximately 3%) of adults required to file income-tax declarations; the Chilean tax agency has also recently published some highly-aggregated income-tax return data. Colombia is the only country that has provided extended panel microdata for analysis of inequality and tax incidence (Alvaredo and Londoño 2013); recent data (2009-11) is now available for Uruguay (Burdín et al. 2014).
4By contrast, Chilean tax-agency data provided for Agostini et al.’s (2012) tax reform simulations aggregated
taxpayers into brackets of 7,422 individuals, and the publicly available tax-agency statistics employed by Lopez et al. (2013) aggregate taxpayers into eight brackets defined by the marginal tax rate schedule; the top bracket contains 13,000-24,000 taxpayers.
5The 2011-2012 student demonstrations forced the issues of inequality and progressive taxation onto the national
data limitations and the difficulty of accurately allocating unrealized income.6 We imputed accrued profits and accumulated retained profits to Chilean taxpayers using ownership shares calculated directly from businesses tax-return forms. Several recent studies have also attempted to impute accrued profits to Chilean taxpayers, but they employ extremely limited information about ownership, and given their reliance on tabulated data, they are unable to rank taxpayers taking accrued profits into account.7 These problems are potentially serious; we find that there is significant re-ranking of taxpayers when comparing income definitions that include accrued profits rather than distributed profits; shares of income with accrued profits are substantially higher when taxpayers are ranked according to income including accrued profits as opposed to income including only distributed profits.
Estimating the distribution of retained profits is particularly important in Chile because the country has a unique integrated income tax that creates strong incentives for business owners to avoid formally withdrawing profits. Chile’s corporate tax serves as a withholding (an advance payment) against personal income taxes that owners are required to pay when they receive distributed profits. Corporate taxes already collected at the firm level are credited against the recipient’s personal income taxes when dividends are distributed, so that profits are not double-taxed. However, distributed profits enter the personal income-tax base, and personal income is subject to progressive marginal tax rates reaching 40%. Because the corporate tax (17% from 2004-2010; currently 20%) is much lower than the top personal income-tax rate (40%), business owners leave the majority of their profits in the firm. According to tax agency figures, on average, only one third of profits are distributed annually (Jorratt 2012: 42). In addition, independent professionals commonly incorporate to avoid paying the much higher personal income tax rates. Retained profits and incorporated income are not always channeled into productive investments. Owners find both legal and illegal ways to consume profits without declaring dividends and hence without paying the corresponding individual income tax; for example, luxury vehicles for personal use may be registered to the firm (avoidance),8 or
distributed profits may simply be omitted from tax declarations (evasion). Income-tax evasion is estimated at 46%, essentially all of which is associated with distributed profits (Jorratt 2009: 7). It is difficult for the tax agency to detect and control under-declaration of distributed profits because the vast majority of Chilean businesses are organized as partnerships and close corporations, rather than publicly-traded corporations; the small number of publicly-traded corporations (amounting to only 0.05% of Chilean firms) are overseen by the Superintendencia de Valores y Seguros and are subject to independent auditing, which minimizes possibilities for evasion. Given these considerations, ignoring retained profits in income distribution studies therefore significantly underestimates the vast material resources at the disposal of Chile’s economic elites.
This paper further contributes to the small but growing literature analyzing not only top income shares, but also effective tax rates paid by the very rich (Piketty and Saez 2006, Bach et al. 2012, Alvaredo and Londoño 2013). Such analysis can play an important role in informing policy debates and grounding scholarly analysis of redistributive politics and the ability of the
6Among other problems, many forms of capital income are tax-exempt and hence unreported. On the serious nature
of the problem of missing capital income and top income shares, see Aktinson, Piketty and Saez (2010).
7López et al. (2013) use aggregate estimates of retained profits and assume based on extremely weak evidence that
85% of retained profits accrue to taxpayers in the top 1%. Agostini et al. (2012) estimate accured profits from household surveys.
8Another frequent avoidance mechanism entails using capital gains to withdraw profits. An owner can buy a
super-rich to defend their material interests.9 Moreover, we include the corporate tax in our estimates of effective tax rates. The most widely referenced incidence study for Chile excludes profits retained by firms from the definition of individual income and ignores the corresponding corporate taxes because they are credited against future personal income tax payments (Engel et al. 1999: 159). However, the corporate tax is not only an important source of revenue in Chile (43-50% of total income taxes in recent years10), it is in practice the only tax that many corporate profits ever pay, given widespread personal income tax avoidance and evasion (Cantallopts et al. 2007). Corporate taxation in Chile therefore can have important implications for both tax
capacity and tax equity. Agostini et al. (2013) embrace this view as well; they provide evidence that the tax deferral for capital income (i.e., profits do not enter the individual income-tax base until they are distributed) creates significant horizontal inequity and reduces the progressivity of the income tax system. However, their analysis is limited by lack of access to the business tax-return forms that we obtained in order to estimate ownership shares.
We find that the concentration of income and profits in Chile is among the highest currently estimated in the top incomes literature, although uncertainty associated with the distribution of undeclared distributed profits and the lack of comparable studies analyzing accrued profits prevent us from confidently ranking Chile among the other income-inequality leaders (the US, Argentina, Colombia and South Africa). When only distributed profits are included in the income definition, we conservatively estimate that the top 1% of adults receives an income share of 15% while the top 0.01% receives 1%. These shares increase substantially when we adjust distributed profits for under-declaration. Depending on the assumptions
employed to impute undeclared profits, estimated shares for 2005 and 2009 range from 22-26% for the top 1%, and 1.6-7.4% for the top 0.01%. When the income definition includes accrued profits instead of distributed profits, top 1% shares range from 23-26% (unadjusted) to 32-33% (adjusted for under-reporting), while top 0.01% shares rise to between 5-7% (unadjusted) and 9-11% (adjusted for under-reporting). Despite this impressive concentration of income, effective income tax rates paid by the richest Chileans are modest. The top 1% pays an average effective rate of at most 15-16%. Our estimated average effective tax rates including the corporate tax in the numerator and accrued profits in the denominator are also 15% for the top 1%; the effective rate for the US including corporate tax is 24% (Piketty and Saez 2006).
I. Data and Methods
Whereas multiple previous requests had been denied, in May 2011 Chile’s tax agency (SII) graciously agreed to provide us with access to confidential, anonymized individual tax return records from 2005 and 2009 within the tax agency’s premises. Compiling our datasets required detailed knowledge about the tax agency’s information systems and filing forms and extensive work on the tax agency’s computers, as well as a lengthy process for obtaining authorization for the project.
By Latin American standards, our datasets are remarkably comprehensive in terms of the number of individuals they include. Income taxes in Latin America generally exclude the majority of the population; most adults make less than the minimum taxable income given high levels of poverty and inequality. In Chile, approximately 82% of individuals earn less than the taxable threshold (Agostini et al. 2012). Nevertheless, individuals registered with the SII comprised 63% (67%) of adults in 2005 (2009) (many of whom did not receive enough income
9Hacker and Pierson (2010), Winters (2011), Fairfield (2015).
to owe taxes). Our datasets contain information on all reported income and taxes paid by these individuals. This section describes the key components of our datasets and the methods used to compile them.
a) Income and profits
Our datasets record income in 8 categories: pensions (aggregated private and public), wages, independent work, rent from real estate, interest earnings, taxable capital gains, dividends and distributed profits, and accrued net business profits.11 Information on the first seven
categories comes directly from forms filed by taxpayers, crosschecked against forms filed by withholding or reporting agents whenever possible. To reconstruct total, pre-tax wage income, deductions for mandatory health insurance payments and contributions to private pension funds were added back to the declared taxable amounts. We exclude the many untaxed forms of interest, capital gains, and rent from our analysis for lack of adequate information, as is the norm in the top incomes literature.12
Accrued profits—a unique feature of our datasets—were allocated using ownership shares calculated from business tax forms: the ratio of profits distributed to a particular owner to total profits distributed by the firm. After multiple iterations to trace through interlocking business ownership, 49% (45%) of the total accrued profits for 2005 (2009) were imputed to Chilean taxpayers, 31% (37%) to foreign owners, and 3% (2%) to funds managed by pension and mutual administrators. Profits imputed to foreigners are omitted from our dataset; profits accrued to pension funds were imputed in proportion to taxpayers’ pension and wage income (see Appendix 1). We lack ownership information to impute the remaining 17% (16%) of profits reported to the tax agency in 2005 (2009). We employ three alternative approaches for handling these residual profits. The first is to simply omit them. The second entails imputing these residual profits based on the distribution of the accrued profits for which we do have ownership information. The third imputes the residual accrued profits in proportion to the distribution of taxpayers’ declared distributed profits. While all of these approaches are ad hoc, they provide a rough estimate of the uncertainty surrounding the distribution of accrued profits.
Our datasets also include retained profits accumulated since 1984, as reported in businesses’ “Taxable Profit Fund” (Fondo de Utilidades Tributables, FUT) ledgers. These retained profits were imputed to individual taxpayers using the same ownership shares calculated as described above. The tax agency uses the FUT, which was created in 1984 when the Pinochet dictatorship established Chile’s integrated income tax system, to keep track of how much tax credit (corporate tax paid by the firm) owners are due when they eventually withdraw these profits and pay individual income taxes. Total FUT profits reported at the end of 2012 were equivalent to Chile’s GDP. FUT funds imputed to taxpayers in our datasets make up 56-61% of the total.
b) Adjusting for undeclared income
In addition to estimating top income shares using declared income in the categories described above, which is the norm in the top incomes literature, we estimate shares after adjusting income in three categories to the Chilean Central Bank’s national accounting figures:
11Appendix 1 describes the interest earnings, capital gains, and accrued profits categories in more detail. 12Despite the difficulties that relying on income definitions dictated by country-specific tax systems creates for
cross-national comparisons, this approach appears inevitable for analyses employing tax-agency data, and the associated problems are generally sidestepped in the literature.
independent work, distributed profits, and accrued profits. This section describes our rationale for adjusting these incomes and the procedures employed to impute undeclared income. Appendix 2 provides additional methodological details.
The first two types of income—independent work and distributed profits—are subject to significant under-reporting. Most independent professionals opt to declare expenses under a simplified presumptive regime, which in practice probably inflates expenses and thereby reduces declared income. Regarding distributed profits, as previously discussed, the tax system creates strong incentives for under-declaration and provides many loopholes to access retained profits for consumption, and it is difficult for the tax agency to obtain information from impartial third parties that would help detect inconsistencies on tax declarations.13 Independent work income calculated from national accounts was 1.3 (1.5) times higher than the total declared to the tax agency in 2005 (2009). The discrepancy for distributed profits was far greater—the national accounts figure was 2.8 (3.2) times greater than the tax agency figure. We believe that this very large gap is explained primarily by evasion. The national accounts value, which is a residual calculated from changes in assets based on information provided by financialinstitutions, is accepted by Chilean experts as a good approximation of the profits actually distributed to households. The other components of household income in the national accounts come from reliable sources and should be free of significant measurement error, so the accounting discrepancy that would otherwise arise must reflect unreported distributed profits.
Total accrued profits constructed from national accounts surpassed the tax agency total by a lesser but still substantial factor of 1.9 (2.2). This discrepancy is likely explained by a
combination of under-declaration, tax benefits that cannot be estimated which should be added back to declared taxable profits (e.g. asset depreciation), and the inherent difficulties of
constructing a matching definition of accrued profits from national accounts, which are derived from different data to serve different purposes. Despite the latter issue, we think it best to adjust the imputed accrued profits to national accounts, given the known sources of downward bias that affect our raw estimates.
Independent work. To adjust independent work income in our datasets, we first use Chilean household surveys (CASEN) to estimate the portion of the national accounts figure that accrues to individuals who did not file tax returns. We then impute the difference between this amount and the tax agency total to taxpayers in proportion to their declared independent work income. In other words, we assume that the distribution of undeclared independent work income is identical to the distribution of declared independent work income.
Distributed profits. To adjust distributed profits, we impute the full difference between the national accounts value and the tax agency value to tax filers. We thus assume that non-filers receive negligible capital income,14 which we believe is appropriate for Chile given the relatively large percentage of adults registered with the tax agency and the evident concentration of capital income in tax agency data; household surveys also suggest that capital income is extremely concentrated (Cantellopts et al. 2007). We employ three alternative methods for imputing undeclared profits. The first method entails allocating the difference between the national accounts total and the tax agency total in proportion to taxpayers’ declared distributed profits. This approach likely overestimates evasion among taxpayers who declared substantial distributed profits and underestimates evasion among taxpayers with large accrued profits who declared
13Tax agency access to bank information on checking accounts, which would help detect undeclared business
income and independent work income, is highly restricted and cannot be used for general auditing operations.
minimal distributed profits. Our second method makes the alternative assumption that evasion is proportional to the difference between taxpayers’ accrued profits and the distributed profits that they declare. In other words, we assume that an individual with large accrued profits who declared few distributed profits has engaged in substantial evasion (rather than actually reinvesting profits in the firm). This approach alters the distribution of distributed profits to more closely reflect the distribution of imputed accrued profits. The third approach imputes undeclared profits in proportion to the distribution of retained profits accumulated in the FUT ledger. The assumption here is that the larger the taxpayer’s FUT account, the fewer distributed profits the taxpayer has truthfully declared. This approach attempts to capture the view shared by many experts that the FUT serves more to facilitate tax evasion than to stimulate productive investment. Of course, none of these approaches is likely to give an accurate depiction of the actual distribution of undeclared profits, which is by definition unknown. Together with the unadjusted data, however, they serve to delineate the range of uncertainty.
Accrued profits. For accrued profits, we assign the difference between national accounts and tax agency totals in proportion to the positive net accrued profits in our datasets. This procedure is likely to overestimate earnings for taxpayers at the top of the accrued-profits ranking, since taxpayers with large net accrued losses do not receive any positive adjustment, even though they too may have either under-declared gains or over-declared losses. We also employ an alternative approach that uses the distribution of gross earnings as the basis for the adjustment. This approach has the advantage that accrued net losses also receive a positive adjustment, which is desirable because our estimates of accrued profits do not correct for tax benefits associated with depreciation; depreciation may account for some of the large net negative values in our datasets.
c) Income definitions for analyzing top shares
We analyze top income shares using several different income definitions. We begin with a definition based on taxable income that corresponds to earnings realized during the year. This income, denoted Y_Rlzd, includes pensions, wages, independent work, taxable interest, and distributed profits.15
We next construct an income Y_AcrdProf that substitutes imputed accrued profits for distributed profits. The logic is to more closely approximate a Haig-Simons income concept— consumption plus changes in net worth—which aims to measure individuals’ potential to consume without reducing their wealth during the period in question.16 This approach is
arguably preferable for characterizing material resources at the top when realized capital income is small compared to unrealized capital income (Smeeding and Thompson 2010).17 Our Y_AcrdProf income definition is particularly appropriate for Chile, given the tendency to under-declare or
15We would like to exclude public pensions, following top incomes studies that focus on market income, but tax
agency figures mix public and private pension payments, and we do not have enough information to disaggregate the two. However, Chile’s pension system was privatized in 1980, and the residual public system accounted for only 35% of pension payments in 2009. This figure excludes public pension top-ups that are paid to low-income Chileans and financed by tax revenue. Recipients of these public-supported pensions do not earn enough to pay income taxes.
16See Haig (1921), Simons (1938).
17Our income Y2 is similar to Smeeding and Thompson’s (2010) “More Complete Income,” which includes imputed
capital income. The authors substitute imputed capital income for reported interest, rents, and dividends to better approximate changes in net worth. For Chile, we lack sufficient information on real estate assets to be able to treat this income source similarly to retained profits.
disguise distributed profits, as well as the fact that few capital gains are taxed. As Atkinson, Piketty and Saez (2010: 677) observe: “When realized capital gains are untaxed and hence not observed, it is important to assess the effects of attributing retained profits to top income.”
We estimate top shares using various related income definitions that either include or exclude capital gains, alter the treatment of pensions, apply alternative adjustment procedures, or do not adjust independent work or profits to national accounts at all. Our preferred definition of income Y_AcrdProf excludes capital gains (which are primarily received by businesses), because they may reflect profits generated in previous years rather than income generated during the year in question, and because including imputed capital gains along with accrued profits may result in some double-counting. In addition, since we are particularly interested in examining how top income shares change when examining accrued profits rather than distributed profits, we prefer to leave other components in the income definition unaltered compared to Y_Rlzd.
Core income definitions:
Y_Rlzd = pensions + wages + independent work + taxable net interest + taxable rent + distributed profits; declared incomes only
Y_Rlzd_NatAcc = Y_Rlzd but adjusting independent work and distributed profits to National Accounts
Y_AcrdProf = pensions + wages + independent work + taxable net interest + taxable rent + imputed accrued profits; declared incomes and accrued profits for which ownership information exists only
Y_AcrdProf_NatAcc = Y_AcrdProf but adjusting independent work and accrued profits to National Accounts
Auxiliary definitions:
Y_Rlzd _CG = Y_Rlzd + capital gains received by individuals
Y_Rlzd_NatAcc_alt1 = Y_Rlzd_NatAcc but using the alternative distributed-profits adjustment method based on the difference between taxpayers’ positive accrued profits and distributed profits
Y_Rlzd_NatAcc_alt2 = Y_Rlzd_NatAcc but using the distribution of accumulated retained profits in the FUT to adjust dividends
Y´_AcrdProf = Y_AcrdProf + declared accrued profits in firms without ownership information imputed in proportion to declared distributed profits
Y´´_AcrdProf = Y_AcrdProf + declared accrued profits in firms without ownership information imputed in proportion to the distribution of accrued profits for which ownership information exists
Y_AcrdProf _CG = Y_AcrdProf including capital gains
Y_AcrdProf_Pens = Y_AcrdProf with imputed accrued profits from pension funds instead of pension payments
Y_AcrdProf_NatAcc _alt = Y_AcrdProf_NatAcc but using the distribution of gross income to adjust accrued profits
d) Ranking taxpayers
Our work with the tax agency micro-data produced six datasets based on rankings of individual taxpayers that correspond to each of the four core income definitions listed above, as
well as two alternative adjustment procedures (Y_Rlzd_NatAcc_alt2, Y_AcrdProf_NatAcc _alt). After ranking individuals according to each income definition, the data was aggregated into groups consisting of eleven taxpayers each (rows in our datasets), following the tax agency’s protocol for
protecting taxpayer confidentiality. When analyzing the additional auxiliary income definitions listed above, we employ the dataset with the ranking that is most closely correlated with the definition in question.
e) Control incomes
We estimate control incomes (the denominator for calculating income shares) by combining tax agency data with national accounts, as is standard in the top incomes literature when sizable portions of the adult population do not file tax returns. We construct total amounts of wage income, independent work, distributed profits, and accrued profits from national
accounts. To these amounts we add total tax agency figures for taxable rent and interest, for which comparable figures could not be constructed from national accounts. This procedure produces control incomes corresponding to Y_Rlzd_NatAcc (adjusted distributed profits and other realized income) of approximately 60% GDP, the same value used for Argentina (Alvaredo 2010). This value is also similar to control incomes for other countries analyzed in the Atkinson and Piketty (2009, 2010) top incomes volumes. When we replace distributed profits with
imputed accrued profits (Y_AcrdProf_NatAcc), our control income increases to 66-67% GDP. For the income definitions including unadjusted declared profits (Y_Rlzd, Y_AcrdProf,
Y´_AcrdProf, Y´´_AcrdProf), we use the total value of declared profits from the tax agency datasets in the control income instead of the national accounts figures, in accord with our assumption that capital income accrues only to tax filers.18 These control incomes are substantially smaller (which is not surprising given the large discrepancy between capital income reported to the tax agency and capital income calculated from national accounts) (Table 1).
––Table 1 here–– f) Control populations
Income taxes in Chile are filed individually. There is no option for married couples to file jointly, and they receive no preferential tax treatments. For the control population, we therefore use estimates of the adult population over age 20, following the usual approach in the top incomes literature.
––Table 2 here––
It should be noted that using households as the unit of analysis would result in lower top income shares, considering that female labor participation is relatively low in Chile.19 Sanhueza and Mayer (2011: 179-80) illustrate this phenomenon for the top decile and top centile using household survey data; however, they find that differences between shares constructed using household income, per capita household income, and individual income are small. Analyzing
18We likewise exclude from the control income the amount of independent work income that we estimate is evaded
by tax filers. Including this amount lowers top share estimates only slightly.
19Female labor force participation has been rising over the past decade; Chile’s rate in 2005 was only 43.4%
compared to the OECD average of 61.9%, but it reached 53.6% in 2010 compared to 63.9% for the OECD (http://stats.oecd.org).
gender inequality with tax return data is an interesting potential avenue for future research if the tax agency is able to supply such information.20
II. Results: Top Incomes a) Realized income shares
We begin our analysis with the standard realized income definition, (Y_Rlzd,Table 3). Top shares are significantly smaller when distributed profits are not adjusted to national accounts compared to scenarios that do adjust profits for under-reporting. For the top 1%, we estimate unadjusted shares of 15-15.5%, whereas evasion-adjusted shares range from 21.6-26.2%. We view the unadjusted shares as lower limits. The adjusted shares are of course educated guesses given that the actual distribution of undeclared profits is unobservable. However, we believe that the upward effect on top income shares is accurate.
Our estimated income shares for the top 10%, 1% and 0.1% do not vary significantly from 2005 to 2009. Shares at the very top show more variation. For the top 0.0001%, Y_Rlzd
(unadjusted) and Y_Rlzd_NatAcc (adjusted) shares are about half as large in 2009, a recessionary year, whereas Y_Rlzd_NatAcc_alt1(2) shares are 1.8 (1.3) times larger in 2009.
Figure 1 shows Lorenz curves (cumulative income distributions) for the top 10% and top 1% in 2005, plotted directly from our datasets. As expected, the data are closely approximated by Pareto distributions; the estimated Pareto shape parameteris 2.37 (2.46) for the top 1% of the unadjusted 2005 (2009) Y_Rlzd curve.
––Table 3 here–– ––Figure 1 here–– b) Shares with imputed accrued profits
Top income shares including accrued profits instead of distributed profits (Y_AcrdProf, Table 4, Figure 2) are significantly larger, indicating the very high concentration of capital ownership in Chile. Estimates for the top 1% share start from a minimum of 23% when no adjustments are made to the tax agency data (Y_AcrdProf). These findings agree with other studies that report more significant inequality when working with income concepts that include broader sources of realized and/or unrealized capital income (Smeeding and Thompson 2010, Atkinson and Piketty 2010, Roine and Waldenström 2012).
––Table 4 here–– ––Figure 2 here––
To further assess the importance of accrued profits at the top, following Roine and
Waldenström’s (2012) approach for capital gains, we calculate shares with accrued profits using two different rankings: one including only distributed profits, and one including accrued profits instead. We then compare to shares including distributed profits only (Table 5).
20We thank an anonymous reviewer for this suggestion. See Sanhueza and Mayer (2001: 183) for analysis using
The results indicate that retained profits are an important resource for those who are
already at the top of the realized income distribution (Y_Rlzd), and including accrued profits in the income concept significantly augments inequality. Shares increase substantially when accrued profits are substituted for distributed profits without altering the original ranking of taxpayers. Shares with accrued profits increase further when taxpayers are re-ranked according this income concept. Ratios of shares with accrued profits to those with distributed profits, ranking taxpayers according to the respective income definitions, range from 1.47-1.53. These ratios are similar to ratios of top 1% shares with capital gains to those without in Sweden (Roine and Waldenström 2012).
––Table 5 here––
These results also indicate that rankings corresponding to the two different income concepts differ nontrivially. Indeed, there are taxpayers in our datasets who declare relatively low distributed profits even though their accrued profits are quite large, and taxpayers who receive substantial distributed profits even though their net accrued profits for the year are negative.21
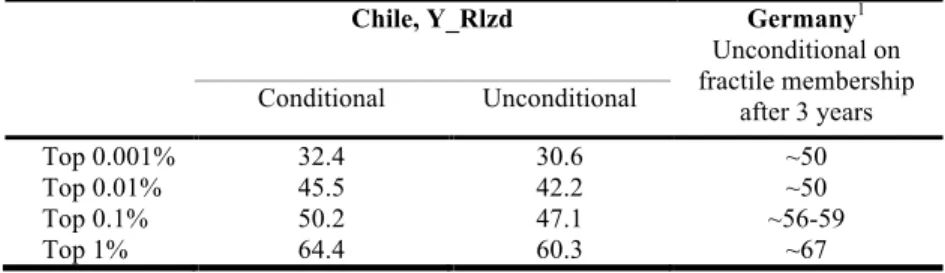
Another way to assess the differences in these two rankings entails identifying the percent of taxpayers in a given top Y_Rlzd fractile who also fall within the same fractile of the Y_AcrdProf distribution (Table 6). Continuity across the top 1% is quite high—nearly 78%, whereas much smaller percentages of taxpayers in the top 0.01% and top 0.001% were also at the top of the Y_AcrdProf distribution.
––Table 6 here––
c) Estimated top shares from published tabulated data (2004–2012)
We hope to build a more extended time series from tax-return microdatain the future. In the meantime, we provide rough estimates of top income shares from published tabulated data (reported income with distributed profits, available only for the years 2004–2012) by applying fixed adjustments based on comparisons with our much more accurate 2005 and 2009 estimates (Table 7).22 We first estimate shares directly from the tabulated data for 2005 and 2009,
substituting the total amount of reported income from the tabulated data for the total reported income in our more detailed datasets. Total income in the tabulated data is less than the total income in our datasets, partly due to accounting differences in the way the tax agency reports the data. We apply standard Pareto interpolation procedures used in the top income literature to estimate income shares for the top 1%, 0.1%, and 0.01% from the tabulated data.23 These shares agree well with our Y_Rlzd shares for 2005 and 2009 (1–5% relative difference). We then
calculate adjustment factors in order to estimate shares of different income concepts from the
21The mismatch between distributed and accrued profits in these latter cases may occur for several reasons. First,
businesses may distribute profits accrued during a previous year even if they registered losses in the current year.
Second, an individual may hold ownership in multiple businesses, some of which distribute profits but some of which accrue large losses that overwhelmed profits accrued in the other firms. Third, some of the mismatch between distributed and accrued profits may be an artifact of our imperfect reconstruction of accrued profitsfrom taxable profits, due to the difficulties of estimating tax allowances for depreciation.
22We thank Emanuel Saez for this suggestion.
tabulated data (Table 8). Adjustment factors for Y_Rlzd_NatAcc top shares are quite stable for each of the three top fractiles across the two years for which we have tax-return microdata (1–3% relative difference). Adjustment factors for Y_AcrdProf and Y_AcrdProf_NatAcc are also reasonably stable for the top 0.1% and 1% (2–5% and 6–10% relative difference respectively). We proceed to multiply top fractile shares estimated from the tabulated data for the other years by the
geometric mean of our 2005 and 2009 adjustment factors.
For the Y_AcrdProf (_NatAcc) top 0.01%, we report shares with two significant figures only. Given the more substantial relative variation between the 2005 and 2009 adjustment factors, applying a constant adjustment factor across the full time series likely produces more error, so these shares should be treated as rougher approximations.
Top income shares are fairly constant from 2004–2011, except for anomalously high 2008 values. The published tax agency data for this year reports an unusually high mean income for taxpayers in the top bracket; access to microdata will be necessary for analyzing why this year appears out of line with the others.
––Table 7 here–– ––Table 8 here––
d) International comparisons
Figure 3 places Chile’s standard top income shares (Y_Rlzd) in cross-national context. We plot the Chilean estimates from tabulated data along with our microdata estimates, with and without adjusting for under-declaration. When examining Figure 3, it is important to recognize that income definitions depend on tax systems and therefore vary in potentially non-trivial ways; methodological differences in how control incomes are calculated across countries may affect results as well.24 At present, these difficulties remain unresolved in the top incomes literature. Bearing these caveats in mind, we discuss some tentative comparative conclusions.
When profits are not adjusted to national accounts, Chile’s top 1% shares are higher than most European countries but lower than the four inequality leaders in the World Top Incomes Database (Colombia, Argentina, the U.S., South Africa) (Figure 3.a). However, we think it is more appropriate to use Chile’s adjusted shares in cross-national comparisons. Although adjusting to national accounts is not standard in the top incomes literature, Chile’s tax system creates strong incentives to under-declare distributed profits, and Chile’s tax agency has weak capacity for detecting undeclared distributed profits. Similar incentives do not exist in Argentina or Colombia, where the top personal income tax rate matches the corporate tax rate and
dividends do not enter the personal income tax base.25 While Nordic countries have similar gaps between tax rates on personal (wage) income and capital income, avoidance (income shifting) may be more salient than evasion (undeclared income).26 Roine and Waldenström (2008: 375) estimate that correcting for evasion in Sweden causes top 1% shares to rise by at most 25%. For Chile, top 1% shares increase by 40-44% in the most conservative adjustment scenario
(Y_Rlzd_NatAcc); higher fractiles increase by far more.
24For more on these issues, see Atkinson, Piketty and Saez (2010).
25In Argentina, taxpayers have incentives to over-declare capital income in order to justify changes in patrimony that
might otherwise alert officials to investigate for potential evasion or money laundering (AFIP 2008, interview). 26Note however that Engstrom and Holmlund (2009: 2426) estimate for Sweden that “self-employed households
with unincorporated businesses hide around 50% of their true incomes.” On income shifting in Finland, which is a particular concern among small firms, see Pirttila and Selin (2011).
When profits are adjusted to national accounts, Chile’s top 1% share surpasses all other countries in the World Top Incomes Database. Evasion-adjusted top 1% shares for Argentina (Alvaredo 2007) reach similarly high levels.27 Shares with adjusted profits for Chile’s top 0.1% and higher fractiles are sensitive to the method used for imputing undeclared dividends.
Adjusted top 0.01% Y_Rlzd_NatAcc_alt1(2) shares exceed those in all other countries analyzed (Figure 3.b). Chile’s adjusted Y_Rlzd_NatAcc shares are substantially lower but similar to South Africa. Unadjusted Chilean shares are closer to European shares.
––Figure 3 here––
Turning to our more complete income definition (Y_AcrdProf), cross-national comparisons become more difficult since the distribution of accrued profits has rarely been analyzed.28 We tentatively compare Chilean income shares with accrued profits to income shares including capital gains in other countries (Figure 4), assuming for these other countries as Piketty and Saez (2006: 9) do for the U.S. that“…realized capital gains on corporate stock reported on individual tax returns are of comparable magnitude to retained earnings from corporations estimated in National Accounts.” Chile’s top 1% shares with accrued profits exceed U.S. shares with capital gains. Chile’s unadjusted top 0.01% shares are similar to U.S. shares, whereas adjusted top 0.01% shares are significantly higher.
––Figure 4 here––
e) Mobility at the top
Our data suggests that mobility in Chile among top income fractiles (Table 9) is similar to developed countries. After four years, 60% of taxpayers who were in the top 1% in 2005 remained within that fractile (64% if taxpayers who no longer existed in 2009 are eliminated from the initial group).29 For the US and Germany, studies have found that the probability of remaining in the top 1% after 3-5 years is 60-68% (Kopczuk et al. 2010: 114, Jenderny 2013: 13). For the top 0.1% in Chile, we find that 43% remained in that fractile four years later; similarly, the probability of remaining in the top 0.1% in Canada is 40-50% (Saez and Veall 2007: 250).
Mobility among fractiles based on accrued profits (Table 10) is slightly lower for all but the top 0.001% of Chileans. 40% of taxpayers remained in the top 0.001% Y_AcrdProf fractile after four years, compared to 32% for the Y_Rlzd fractile.
––Table 9 here–– ––Table 10 here––
27Alvaredo’s methodology for adjusting incomes differs from ours. He views these shares as upper limits that likely
overestimate evasion among the very rich.
28Atkinson (2009b: 99-100) analyzes how retained profits affect top income shares in the UK during the inter-war
period, drawing on limited data available on personally-owned shares.
f) Heavy concentration of accumulated retained profits
Our datasets allow us to examine not only the distribution of profits accrued during the year in question, but also the distribution of retained profits accumulated in the FUT since 1984. These retained profits represent a significant source of wealth in Chile—at least on paper (the FUT is an accounting mechanisms, and many of these profits in practice have probably been withdrawn)—and they are heavily concentrated (Table 11). Depending on the income definition used to rank taxpayers and the year, the top 0.1% owns 36-78% of retained profits. As such, accumulated retained profits are significantly more concentrated than yearly (declared) distributed and accrued profits.30
Additionally, our data show that FUT wealth is only loosely correlated with reported income Y_Rlzd. The correlation with reported Y_AcrdProf income is much stronger.
––Table 11 here––
g) Income composition: Importance of profits at the very top
We focus our analysis of top income compositions on income definitions Y_Rlzd and
Y_AcrdProf, without any adjustments for under-reported profits or independent work. Figure 5
shows the share of each income type for the top percentiles. For Y_Rlzd, distributed profits dominate other income sources only for the top 0.001%; wages dominate for lower percentiles within the top 1%. The Y_Rlzd figure also displays the ratio of declared distributed profits to accrued profits. These ratios vary widely, from a minimum of 12% to a maximum of 75%, with no consistent pattern over time or across percentiles. For Y_AcrdProf, accrued profits dominate within the top 0.1%, constituting over 84% of total income in that fractile; less than 13% of accrued profits are distributed. Compared to Y_AcrdProf, Y_Rlzd income compositions are much more variable over time, even though shares of each source in aggregate personal income change only marginally. Declared distributed profits make up a much lower share of the two top
percentile incomes in 2009 (44% and 32% respectively) compared to 2005 (87% and 46% respectively). For comparison, the figures also display capital gains as a percent of total income, even though they are not included in the income definition. For the most part, capital gains are negligible compared to other income sources.
––Figure 5 here––
To get a sense of how individuals in the top 1% can be characterized in terms of their income sources, we rank our rows of 11 aggregated taxpayers by their share of specific income types (wages and pensions, independent work, profits31). This procedure follows Bach et al. (2009: 321), except that we are not able to rank at the individual level. However, each row for this purpose can be considered a “typical” taxpayer in the corresponding cohort. Table 12 shows that most of those in the top 1% receive income from a mix of sources. For Y_Rlzd,
approximately 9% (16%) receive over 80% of their income from wages in 2005 (2009); 0% report distributed profits in excess of 80% of total income. Independent work plays a much less significant role compared to wages and profits; 98% (99%) of typical taxpayers receive under 30% of their income from this source. For Y_AcrdProf, the fraction of wage-earners (over 80% of
30The top 0.1% recives 17-66% of accrued profits and 12-23% of distributed profits. 31Income shares from interest and rent are small.
income from wages and pensions) in the top 1% drops to 5% (10%), while the fraction of business people (over 80% from accrued profits) increases to 3%.
When we examine the top 0.01% alone, business activity grows in importance relative to wage income for 2006. 1% of these typical taxpayers report distributed profits surpassing 80% of total Y_Rlzd income compared to just 3% in the wage-earners category. The figures are more dramatic for Y_AcrdProf incomes. Accrued profits exceed 80% of total income for 66% (61%) of typical taxpayers in 2005 (2009), whereas none have wage-income shares over 30%.
Accordingly, when we focus on accrued profits rather than distributed profits, the top of the distribution is clearly and consistently dominated by business owners.
The same phenomenon is apparent within the top 0.001% as well; the top of the Y_Rlzd distribution is dominated by wage earners, whereas as the top of the Y_AcrdProf distribution is dominated by business owners. All typical taxpayers in the Y_AcrdProf top 0.001% have accrued profits exceeding 98% of total income. In stark contrast, all typical taxpayers in the Y_Rlzd top 0.001% have wage income shares above 96%. These results further indicate the importance of analyzing accrued profits.
––Table 12 here––
III. Effective Tax Rates a) Tax data
Our datasets contain information on both individual and corporate income taxes. Chile’s individual income tax is divided into two categories. People who earn only wage income pay the “second category tax” (ISC, impuesto de segunda catagoría) with progressive marginal rates rising from 5% to 40% (Table 13).32 People who receive any other sources of income instead of or in addition to wages pay the “complementary global tax” (IGC, impuestoglobal
complementario), which applies the same progressive rate schedule to the sum total of taxable income.33 The corporate income tax on accrued profits (IPC, impuesto de primera categoría) was imputed to individuals using the same iterative assignment procedure employed to allocate accrued profits (Section I.a). We imputed the small amount of corporate tax corresponding to accrued profits in pension funds (approximately 5% of the total) in proportion to taxpayers’ work and pension income,34 a similar procedure to that employed by Piketty and Saez (2006) for the US.
––Table 13 here––
Amounts registered for the corporate tax and the IGC may be negative, indicating that the tax agency has reimbursed the taxpayer. Loss carry-back is the most common scenario leading to negative corporate taxes. In general, the total annual amount of IGC paid tends to be negative, primarily because the credit for the corporate tax paid by companies when profits accrue tends to
32Marginal rates were lowered in 2012 to the following schedule: 4%, 8%, 13.5%, 23%, 30.4%, 35.5%, 40%. 33Capital gains are an exception: they are subject to corporate tax but do not enter into the IGC base and hence
receive preferential tax treatment.
34We estimated corporate tax from pension funds by applying an effective rate (16.8%) calculated from aggregate
figures to accrued profits in these funds. We do not take independent work into account when imputing corporate tax from pensions funds since the bulk of pension contributions were made by dependent workers.
exceed the income tax that individuals owe on their distributed profits. However, at the very top of the income distribution, IGC amounts are primarily positive.
b) Effective rates ignoring corporate tax
Table 14 displays effective tax rates defined as individual income taxes paid divided by declared realized income (Y_Rlzd). We exclude corporate taxes on retained profits, as is most common in incidence studies. However, we do include corporate taxes corresponding to distributed profits—recall that Chile’s corporate tax is credited against individual income taxes owed when profits are distributed. Effective tax rates calculated including capital gains and capital gains taxes differ only marginally from the rates in Table 14, except for the top 0.001% in 2009 (the effective rate drops by 1.7 percentage points when capital gains are included).
Rates do not vary much from 2005 to 2009, with the exception of the top 0.0001%, which paid only 15% in 2005 compared to 31% in 2009. The 2005 rate results from the unusually low tax on distributed profits collected from the owners’ businesses (corporate tax credit).35
Effective tax rates vary substantially within the percentiles reported in Table 14. Over an interval of 0.01% around the top 99.9%, the coefficient of variation is 12%. Tax benefits to
promote savings are one salient source of horizontal inequity that may help to explain the spread. Table 14.a includes effective individual income tax rates for the U.S., Germany, Colombia, and Uruguay, the only countries to our knowledge for which similar analyses exist. However, much caution is required when making cross-country comparisons. Given the problem of undeclared dividends, the Chilean rates are upper bounds; concluding that rates at the top are similar in Chile and the two OECD countries would be misguided. Rates at the top are lower and flatter when distributed profits are adjusted to national accounts (Table 14.b). When comparing Chilean and Colombian rates, it is important to note that the strikingly low
Colombian rates are sensitive to Alvaredo and Londoño’s (2013: 22) assumption that 33% of income reported as “ingresos no constitutivos de renta” are dividends taxed at the firm level.36 They estimate that if dividends instead comprise 75% of income in this category, the average effective tax rate for the top 0.01% would rise to 14%. That rate is closer to Chilean rates including imputed corporate taxes and accrued profits in the analysis (below).
––Table 14 here––
c) Low effective rates including imputed corporate tax and accrued profits
Given the problem of undeclared distributed profits, we believe effective rates that include the corporate tax and accrued profits provide a better metric of the tax burden at the top in Chile. Table 15 displays average effective tax rates defined as all income taxes paid during the year divided by income accrued during the year (Y_AcrdProf). Average effective rates for the top fractiles reach at most 17.2%.
The average tax rates reported for the top percentiles again mask significant variation of rates within these groups. This variation is due largely to the fact that total income tax liabilities for the year do not correspond directly to income definition Y_AcrdProf (profits accrued during the year in question, which may or may not be distributed); the individual income tax reflects
distributed profits, while the corporate tax reflects accrued profits. As such, taxpayers with large
35This result may reflect an error in the data provided by the tax agency; it is possible that a tax return for a
non-Chilean national was accidentally included in this top group of eleven taxpayers.
distributed profits but few accrued profits (or significant losses) have very high effective tax rates calculated with income denominator Y_AcrdProf. In addition to the distinct tax treatment of retained versus distributed profits, loss carry forward or carry back and use of other tax benefits contributes to horizontal inequities.
For comparative context, Table 15 also displays average effective tax rates for the U.S. calculated by Piketty and Saez (2006), the only study of which we are aware that fully includes the corporate tax in analyzing top fractile tax incidence. The Chilean rates are 40-64% of the U.S. rates. When comparing the Chilean and US effective tax rates, it should be kept in mind that Piketty and Saez’s (2006) corporate tax incidence assumptions and imputation methods differ from ours. They impute corporate taxes paid in proportion to individuals’ realized capital income, including dividends, capital gains, and interest, whereas we impute corporate taxes paid in proportion to ownership of accrued profits, which we judge more appropriate for Chile.37 It should also be noted that Piketty and Saez (2006) do not impute reinvested corporate profits in their analysis, since they maintain that realized capital gains on stocks in the U.S. are of comparable magnitude. The Chilean context is very different, given that few companies are publicly traded, only 35% of profits are distributed annually according to tax return data, and total reported capital gains are less than 1% of accrued profits.
––Table 15 here–– Conclusion
Our highly detailed and disaggregated tax-return data provide the most accurate available estimates to date of top income shares, income compositions, unrealized capital income, and effective tax rates in Chile. Chilean top income shares—whether profits are adjusted to national accounts or not—are among the highest of those countries that have so far been analyzed with similar methods. Including accrued profits in the analysis skews the distribution even more heavily toward the top. Effective tax rates, meanwhile, are modest. Regarding policy
implications, the evidence we present suggests that there is substantial room to raise revenue for social spending by taxing Chile’s upper income earners and capital owners more heavily, in line with the Bachelet administration’s efforts, although analysis of optimal tax policy and its role in public finance lies beyond the scope of this paper.38 We hope that our empirical data will inform ongoing debates on tax policy and inequality in Chile.
We hope to extend our research during the coming years by building a time series, which would allow analysis of the determinants of top income shares and responses to tax policy changes since democratization. Such analysis could potentially yield different results from OECD findings (Roine et al. 2009, Piketty et al. 2014), given that Latin America is characterized by a distinct type of “hierarchical capitalism” that reinforces economic and political inequalities (Schneider 2013, Schneider and Soskice 2009). Access to more years of data, which the Chilean tax agency will hopefully provide as time and resources allow, will also afford more complete information on business ownership for imputing accrued profits.
More broadly, our analysis highlights the need for greater attention in the top incomes literature to three research agendas. First, more efforts to analyze the distribution of capital
37We treat the portion of corporate tax corresponding to pension and insurance funds in a similar manner as Piketty
and Saez (2006), imputing this amount in proportion to taxpayers’ wage and pension income.
38E.g. Saez 2011, Piketty et al. 2014. Recent research suggests capital income could be taxed more heavily without
income—whether realized or not—could make a significant contribution to our understanding of inequality around the globe, although data constraints will likely remain problematic. As the Chilean case illustrates, realized capital income may correlate only roughly with unrealized capital income at the top of the distribution. Second, more analysis of how tax systems affect income definitions as well as how much and what type of income is actually declared across countries (and over time) is in order. In Chile, the structure of the income tax creates a particular set of incentives that must be taken into account when endeavoring to estimate income shares and effective tax rates that are reasonably comparable with other countries. Additional attention to comparability issues, cross-national systemization, and methodological standards for imputing undeclared income will become increasingly important as tax return data become available in more developing countries. Third, the top incomes literature could fruitfully expand to include more analyses of effective tax rates paid by the rich and super-rich. We are aware of only a handful of studies that undertake such analysis. This line of inquiry could help shed light on the relationship between taxation and inequality at the top of the income distribution and could serve as a valuable input for policy debates on tax reform and analysis of redistributive politics.
Tables
Table 1: Control Incomes, % GDP
2005 2009 Y_Rlzd 50.7 50.1 YRlzd_NatAcc 59.3 60.2 Y_AcrdProf 54.8 53.6 YAcrdProf_NatAcc 66.3 66.9 Y´(´)_AcrdProf 57.7 56.4 Y_Rlzd_CG 50.8 50.1 Y_AcrdProf_CG 55.0 53.9 Y_AcrdProf_Pen 50.6 49.6
Notes: Y_Rlzd includes distributed profits. Y_Rlzd_NatAcc denotes that independent work and distributed profits are adjusted to National Accounts. Y_AcrdProf includes accrued profits. Y_AcrdProf_NacAcc denotes that independent work and accrued profits are adjusted to National Accounts. Y´_AcrdProf and Y´´_AcrdProf include imputed residual accrued profits with no ownership information. CG denotes inclusion of capital gains. For Y_AcrdProf_Pen, imputed accrued profits from pension funds replace pension payments.
Table 2: Population and Tax Returns Population over 20
Source: Instituto Nacional de Estadisticos
Tax returns Source: SII
2005 10,750,033 6,808,535
2009 11,582,966 7,731,605
Table 3: Realized Income Shares (with Distributed Profits), 2005 (2009)
Top 0.0001 Top 0.001 Top 0.01 Top 0.1 Top 1 Top 10 Top 20 Y_Rlzd 0.091 (0.053) 0.335 (0.261) 1.090 (0.988) 4.020 (3.825) 15.54 (15.02) 49.30 (48.93) 63.79 (63.94) Y_Rlzd_CG 0.091 (0.052) 0.336 (0.299) 1.096 (1.034) 4.054 (3.886) 15.60 (15.10) 49.35 (48.98) 63.83 (63.98)
Y_Rlzd_NatAcc 0.211 (0.106) 0.628 (0.454) 1.817 (1.636) 6.145 (5.911) 21.75 (21.63) 55.41 (55.81) 68.46 (69.21) Y_Rlzd_NatAcc_alt1 0.974 (1.718) 2.901 (3.663) 6.155 (6.795) 11.97 (12.57) 24.39 (24.88) 55.28 (55.69) 68.24 (68.96) Y_Rlzd_NatAcc_alt2 0.902 (1.140) 3.051 (3.346) 7.006 (7.379) 13.18 (13.70) 25.86 (26.23) 56.17 (56.63) 68.80 (69.56)
Sources: Authors’ calculations from own datasets.
Notes: These Chilean incomes include only distributed profits. NatAcc denotes that profits and independent work are adjusted to National Accounts. Alt1 denotes the alternative adjustment procedure for distributed profits using the difference between taxpayers’ positive accrued profits and distributed profits; Alt2 denotes the alternative adjustment procedure for distributed profits using the FUT distribution. CG denotes inclusion of capital gains.
Table 4: Income Shares with Accrued Profits, 2005 (2009)
Top 0.0001% Top 0.001% Top 0.01% Top 0.1% Top 1% Top 10% Top 20% Y_AcrdProf 0.8277 (1.353) 2.468 (2.895) 5.298 (5.458) 10.66 (10.60) 23.25 (23.04) 55.15 (55.23) 68.72 (69.35) Y´_AcrdProf 0.7997 (1.290) 2.387 (2.780) 5.216 (5.337) 10.86 (10.71) 24.34 (23.88) 56.58 (56.48) 69.78 (70.27) Y´´_AcrdProf 1.058 (1.755) 3.152 (3.750) 6.706 (7.005) 13.09 (13.18) 26.50 (26.44) 58.01 (58.30) 71.07 (71.92)
Y_AcrdProf_NatAcc 1.422 (2.425) 4.232 (5.176) 8.960 (9.617) 17.14 (17.72) 32.02 (32.55) 61.92 (62.60) 73.68 (74.71) Y_AcrdProf_NatAcc_alt 1.583 (NA) 5.390 (NA) 10.91 (NA) 19.26 (NA) 32.96 (NA) 61.52 (NA) 73.12 (NA) Y_AcrdProf_CG 0.8543 (1.377) 2.497 (3.028) 5.372 (5.744) 10.82 (11.01) 23.44 (23.42) 55.27 (55.44) 68.79 (69.48) Y_AcrdProf_Pen 0.8959 (1.460) 2.671 (3.126) 5.734 (5.894) 11.54 (11.45) 25.03 (24.75) 57.32 (57.59) 70.13 (71.10)
Sources: Authors’ calculations from own datasets.
Notes: Y´ and Y´´ include imputed residual accrued profits with no ownership information. In the first case, the residual is imputed in proportion to declared distributed profits; in the second case, it is imputed in proportion to the distribution of accrued profits for which ownership
information exists. NatAcc denotes that accrued profits and independent work are adjusted to National Accounts. Alt denotes the alternative adjustment procedure for accrued profits using gross income. CG denotes inclusion of capital gains. Pen indicates that imputed accrued profits from pension funds have replaced pension payments.
Table 5: Income Shares with Distributed Profits (Y_Rlzd) vs. Accrued Profits (Y_AcrdProf)
by Different Rankings; 2005 (2009) a) Unadjusted Incomes
Top 0.0001 Top 0.001 Top 0.01 Top 0.1 Top 1 Top 10 Y_Rlzd 0.091 (0.053) 0.335 (0.261) 1.090 (0.988) 4.020 (3.825) 15.54 (15.02) 49.3 (48.9)
Y_AcrdProf ranked by Y_Rlzd 0.109 (0.159) 0.929 (0.430) 2.570 (1.561) 6.986 (5.071) 19.90 (17.50) 51.89 (50.33)
Y_AcrdProf 0.828 (1.353) 2.468 (2.895) 5.298 (5.458) 10.66 (10.60) 23.25 (23.04) 55.15 (55.2)
Ratio of Y_AcrdProf to Y_Rlzd 9.06 (25.77) 7.36 (11.10) 4.86 (5.52) 2.65 (2.77) 1.50 (1.53) 1.12 (1.13)
b) Incomes adjusted to National Accounts
Top 0.0001 Top 0.001 Top 0.01 Top 0.1 xx Top 1 Top 10 Y_Rlzd_NatAcc 0.211 (0.106) 0.628 (0.454) 1.817 (1.636) 6.145 (5.911) 21.75 (21.63) 55.4 (55.8)
Y_AcrdProf_NatAcc ranked by Y_Rlzd_NatAcc 0.335 (0.315) 1.702 (0.911) 4.191 (2.983) 10.67 (8.667) 26.77 (24.40) 57.90 (56.47)
Y_AcrdProf_NatAcc 1.422 (2.425) 4.232 (5.176) 8.960 (9.617) 17.14 (17.72) 32.02 (32.55) 61.92 (62.60)
Ratio of Y_AcrdProf_NatAcc to Y_Rlzd_NatAcc 6.74 (22.8) 6.74 (11.4) 4.93 (5.88) 2.79 (3.00) 1.47 (1.50) 1.12 (1.12)
Source: Authors’ calculations from own datasets.
Notes: Y_Rlzd includes only distributed profits. Y_Rlzd_NatAcc denotes that independent work and distributed profits are adjusted to National Accounts. Y_AcrdProf includes accrued profits. Y_AcrdProf_NacAcc denotes that independent work and accrued profits are adjusted to National Accounts.
Table 6: Transitions from Top Y_Rlzd Fractiles to Y_AcrdProf Fractiles (2005)
Y_Rlzd fracile % Also in Top Y_AcrdProf fractile
Top 0.001% 19.4
Top 0.01% 27.9
Top 0.1% 45.2
Top 1% 77.6
Sources: Authors’ calculations from own datasets.