Volume 34
Number 492
Iowa livestock producers' choice of
markets
Article 1
April 1961
Iowa livestock producers' choice of markets
Wilbur R. Maki
Iowa State University of Science & Technology
Norman V. Strand
Iowa State University of Science & Technology
Follow this and additional works at:
http://lib.dr.iastate.edu/researchbulletin
Part of the
Agriculture Commons
,
Economics Commons
,
Sociology Commons
, and the
Statistics and Probability Commons
This Article is brought to you for free and open access by the Iowa Agricultural and Home Economics Experiment Station Publications at Iowa State University Digital Repository. It has been accepted for inclusion in Research Bulletin (Iowa Agriculture and Home Economics Experiment Station) by
an authorized editor of Iowa State University Digital Repository. For more information, please contactdigirep@iastate.edu.
Recommended Citation
Maki, Wilbur R. and Strand, Norman V. (1961) "Iowa livestock producers' choice of markets,"Research Bulletin (Iowa Agriculture and Home Economics Experiment Station): Vol. 34 : No. 492 , Article 1.
Iowa Livestock Producers'
Choice of Markets
by Wilbur R. Maki and Norman V. Strand
Department of Economics and Sociology Department of Statistics
AGRICULTURAL AND HOME ECONOMICS EXPERIMENT STATION IOWA STATE UNIVERSITY of Science and Technology·
CONTENTS
Summary _______________________________________________________________________________ " . ___ .. __ _ _ _______________ ___ 96 Introduction ____________________ _ ______ ________ _____ ____ ____ _ ____ _____ ___ ____________ _ ____________ _____________ ___ 97
o
bj ecti ves ________________ __ ____ _____________ _______________ _____ ___________ ___________ ________ ___ ____ _ ____ ___ ______ 97 Factors affecting choice of markets ______________________________________________________________ ._ 98 Farm characteristics .. ____________________________________________________________ .___ _________ _____ 98 Livestock classes __ -__________________________ . _. ______________ . ___ . ___________________________________ 100 Market outlets __________________________________________________________________________________________ 1 0 1 Producer attitudes ____________________________________________________________________________________ 102 Market choices for cattle and calves ______________________________________________________________ 104 Sales ____________________________________________________________________________________________________________ 1 04 Purchases __________________________________________________________________________________________________ 1 06 Changes in market choices, 1940-54 ________________________________________________________ 106 Market choices for hogs and pigs __________________________________________________________________ 107 Sal es ________________________________________________________________________________ -___________________________ 1 07 Purchases __________________________________________________________________________________________________ 1 08 Changes in market choices, 1940-54 ________________________________________________________ 109 Distance to market and lot size ________________________________________________________________________ 109 Livestock sales _______________ ---_______________________________ -________________________________________ 110 Cattle and calves ______________________________________________________________________________ 11 0 Hogs and pigs ____________________________________________________________________________________ 112 Livestock purchases ________________________________________________________________________________ 115 Cattle and calves ______________________________________________________________________________ 115 Hogs and pigs ---__________________________________ " _________ -______________________________ 116 Appendix: Survey design ________________________________________________________________________________ 117 The data ---__ --- ---_________ -___________________________________________________ 117 Area of investigation --____________________________________________________ --______________________ 117 Sample size --- --- ---______ ---____ --_____________ --________________________________________ 117 The sample design -____________ -______ ---_____________________________________________________________ 117 Training of interviewers __________________________________________________________________________ 118 Summary of coverage experience __________________________________________________________ 118 Estimates of population totals, means and variances __________________________ 119 Sampling errors for selected characteristics __________________________________________ 120SUMMARY This report covers principally the market choices
of Iowa livestock producers during 1954. The find-ings are based on a sample survey of about 400 Iowa farmers who were interviewed at 3-month in-tervals. These findings show the market outlets and market sources of the major classes of live-stock - cattle, calves, hogs and pigs - sold and bought by Iowa producers. The characteristics of both the livestock producers and their livestock sales and purchases are presented with reference to the reported patterns of market selection.
In 1954, every livestock producer in Iowa had available at least one major market outlet within a 20-mile radius of his farm. Geographical dif-ferences occurred, however, in the concentration of livestock production, which affected the spatial distribution of market outlets and market sources for Iowa producers. In 1954, livestock sales per acre of farmland, for example, ranged from $10 to $67 among the 99 counties in Iowa. Generally, the eastern and western parts of the state had the most specialization in livestock production.
According to the 1954 survey data, slaughter cattle were sold by farmers largely through ter-minal markets. These markets, from the live-stock producer's viewpoint, offered a specialized service in the form of skilled sales personnel and a large number of active buyers. More than half of all steers and heifers sold by Iowa producers were sold through terminal markets.
Terminal markets were not as important as sales outlets for cows and bulls and were much less important as outlets for hogs and calves than they were in the sales of steers and heifers. In 1954, 49 percent of all sales of cows and bulls were through terminal markets, while only 13 percent of all hogs were sold through terminal markets. Nearly aU livestock sales by Iowa pro-ducers at terminal markets, moreover, involved livestock intended for slaughter.
Meat packing plants, including packer buyers, and auctions were the next most important group of market outlets for cattle used by farmers. Meat packers purchased 22 percent of the total marketings of cattle by farmers in 1954, while 13 percent were sold through auction markets.
Slaughter hogs were sold largely to packing plants and dealers. Sales directly to packing plants and to packer buyers in 1954 were, respectively, 17 percent and 35 percent of total hog sales. Sales through dealers comprised 24 percent of total hog sales. From the producer's viewpoint, convenience in location was the most important consideration in the choice of packing plants, packer buyers and dealers in the sale of slaughter hogs.
Feeder cattle, calves and pigs were sold largely through auctions or directly to another farmer. Breeding stock followed similar marketing chan-nels. Purchases of feeder and breeding stock also
96
occurred largely through these two markets. Lo-cal dealers, in addition, were an important source of feeder pigs.
Differences in marketing services offered by the major types of livestock markets were associ-ated with differences in the livestock characteris-tics at each maj or type of market. Terminal mar-kets-the outlet primarily used for slaughter cattle, though in total numbers slaughter hogs also were important-were characterized by rela-tively large lots shipped relarela-tively great distances and representing relatively high average weight and value per hundredweight when sold.
Packing plants and packer buyers-the pre-dominant outlet for slaughter hogs, though im-portant also as market outlets for slaughter cat-tle and calves-were characterized by shipments of intermediate lot sizes hauled an intermediate distance, of intermediate average weight and of relatively high value per hundredweight. '
Dealers were located, on the average, most con-veniently with reference to distance. The local dealer markets also were differentiated from the other major types of markets with reference to the characteristics of the livestock handled.
Auction markets were conveniently located for producers and offered specialized services in the sale and purchase of livestock intended for breed-ing and feedbreed-ing. Generally, livestock sales at these markets were in small lots, shipped only a few miles to place of sale, of lighter average weight and of lower average value per hundred-weight than the livestock sold at other major mar-ket outlets.
Changes during the period from 1940 to 1954 also are cited in this report, of which the most striking was the growth of auction markets. Ter-minal public markets and packing plants, how-ever, maintained their relative importance as market outlets for slaughter cattle and calves and, because of the secular growth in total mar-ketings, the total sales through these markets increased substantially. Sales of slaughter hogs through packer buyers or directly to packing plants also increased in total volume.
Livestock auctions experienced the largest in-crease in sales volume through producers' pur-chases of feeder cattle and calves. Local dealers, however, became the most important market source for feeder pigs-an activity that partly compensated for their declining importance as outlets for slaughter cattle and hogs.
Thus, each livestock market has developed a unique pattern of services and clientele in re-sponse to the needs of particular types of live-stock enterprises. As the pattern of livelive-stock production has changed, livestock markets have changed also in relative importance as outlets or sources of livestock for Iowa producers.
Iowa Livestock Producers' Choice of Markets
1BY WILBUR R. MARl AND NORMAN V. STRAND
Livestock producers ih Iowa have a wide choice of markets, including terminal markets, packing plants, packer buyers, dealers, auctions, other farmers and miscellaneous marketing agencies. These markets differ in their services and clien-tele. Their services also vary according to the class of livestock handled.
Iowa livestock markets have experienced sev-eral periods of quite drastic adjustments to changing patterns of livestock marketing. Until 1920, Iowa livestock producers depended largely upon the terminal public markets in both buying and selling of livestock. The advent of motor trucks and improved roads, however, triggered the growth of country markets and the gradual shift of slaughtering plants into areas of concen-trated livestock production. In the competitive struggle for the producers' patronage, the special-ized services of the public stockyards and com-mission firms vied with the locational convenience of the country markets.2
Today, an expanding network of market news serves to connect the hundreds of country mar-kets with the major central marmar-kets. Livestock producers thus are able to compare prices at al-ternative markets and even obtain bids from sev-eral buyers on a given sales lot of livestock. In effect, each of the 1,200 livestock markets and the 180,000 livestock producers in Iowa are tied to
a
nationwide system of markets and market news reporting.In a perfect market, a particular quality of live-stock would bring an identical plice (except for transportation costs) at all pricing points. Under imperfect knowledge, however, the theoretical norm is not attained because of variability in livestock quality, demand and marketings. Addi-tional knowledge about existing livestock market-ing practices would be useful, therefore, in evalu-ating the strengths and weaknesses of the present system of marketing and market news reporting. Moreover, this information would be helpful to livestock market operators in adapting their
ac-1 Project 1323 of the Iowa Agricultural and Home Economics Experi-ment Station. The data used in this study were obtained from the Iowa Livestock Marketing Survey. Project 1229. which was financed by a grant from the Union Stockyards and Transit Company. Chicago. Illi-nois. The authors are grateful to Francis A. Kutish and Elliott S. Clif-ton for their contribution in the development of the field surveys and to
Sam H. Thompson and Charles Y. Liu for assistance in the preparation of the tabular material upon which this report is based.
2 The early history of livestock marketing In Iowa is covered in: Sam H. Thompson. }::eonomlc trends in livestock marketings. John H. Swift Company. St. Louis. 1940.
tivities to the changing needs of livestock produc-ers.
A sample survey was undertaken in 1953 and 1954 to obtain a more complete picture of mar-keting practices and market choices of Iowa live-stock producers.3 In this survey, a panel of about
400 farmers in Iowa was interviewed at quarter-year intervals over an 8-quarter period starting in April 1953. The survey findings serve as the source of data reported in this publication.
OBJECTIVES
The primary objective of this report is to pro-vide a basebook of livestock marketing patterns of Iowa farmers for the calendar year 1954. Future studies of livestock marketing patterns can use this basebook to examine trends and to evaluate changes in the market choices of Iowa livestock producers.
Cattle, calves, hogs and pigs are the major livestock classes bought and sold by Iowa farmers. Hence, this report is limited to the sales and pur-chases of the four major livestock classes, includ-ing their interfarm sales. Livestock intended for slaughter, feeding and breeding are included in the tabular presentations, however, both separate-ly and combined under various market-class de-scriptions.
The data pertain only to the Iowa population of livestock producers (mostly for the one calendar year-1954) . Even though producers' choice of markets in 1954 may apply to existing situations, this report does not include an extrapolation of the findings to more recent years. Some data are available, however, to show the aggregate pat-tern of farm marketings of livestock for the 35-year period-1924 through 1959. The 1954 data also can be related to the 1940 survey of the Corn Belt Livestock Marketing Research Committee.4
Briefly, the 1954 farm marketings of cattle, calves, hogs and pigs were somewhat fewer in total number than in later years, as shown in fig. 1. In comparison with 1940, however, the 1954 livestock marketings were substantially larger in total number. Livestock production in Iowa, which has composed about 15 percent of total
• The statistical features of this sample survey are discussed In the appendix.
• Marketing livestock in the Corn Belt region. S. D. Agr. E .. "p. StD.. Bul. 365. Nllv. 1942.
livestock production in the United States, kept pace with the growth in population and demand for meat during the period since 1940. Cyclical changes occurred, however, in yearly livestock production. The secular and cyclical changes in livestock marketings resulted in two sets of changes in the business volume of each market-changes in total numbers bought and sold and changes in each market's percentage share of total Iowa sales and purchases of livestock.
FACTORS AFFECTING CHOICE OF MARKETS
Choice of market is a terminal decision in the livestock production process. Early in the produc-tion process, rather basic farm decisions are in-volved in the choice of a livestock enterprise and its relative size (as compared with the previous year or the average size of all such enterprises). The aggregate price effects of farmers' decisions are involved in the cyclical changes in farm mar-ketings shown in fig. 1. Choice of market, how-ever, relates to the basic production decisions insofar as the pricing process functions with ref-erence to market organization and structure. If
markets fail to precisely discover the derived re-tail market value of livestock, then livestock qual-ity improvement programs based on adequate price-quality differentials are likely to fail. More-over, lack of reliability in livestock price fore-casting may result in excessive dependence on current prices in making basic production decis-ions. A better understanding of livestock market-ing patterns and changes in these patterns, there-fore, may contribute to improvements in the mar-ket information used in both the production and distribution processes.
Four different sets of factors are cited as
rele-vant to livestock producers' choice of markets: farm organization, livestock or market class, time of marketing and farmer attitudes. Iowa farms are changing gradually in size, enterprise organi-zation and degree of specialiorgani-zation. Market classes of livestock, particularly the percentage distribu-tion of female stock, also change from year to year as a result of producers' decisions to increase or decrease the number of animals bred or the number of animals on feed. In addition~ current and anticipated price relationships lor feed grains, cattle and hogs affect the weight of ani-mals bought and sold, or the time of marketing. Finally, producer preferences affect the choice of particular market outlets or market sources, though these preferences may change because of changes in farm organization, livestock classes or time of marketing.
FARM CHARACTERISTICS
Practically all Iowa farms-186,769 farms, or 96.5 percent of the estimated 193,643 farms in 1954-reported one or more head of livestock on hand or sold during the year. Considerable differ-ences occurred, however, in farm organization and the nature of the livestock enterprise. As sug-gested in table 1, for example, livestock farms are the dominant type of farm in Iowa, though other types of farms also keep livestock, either cattle, hogs or both.5
6 A farm was classified as livestock, cash grain, dairy and poultry and egg. if 50 percent or more of total cash receipts for 1953 were from one of the particular sources of revenue. A farm was a dairy farm also if dairy products accounted for 30 percent or more of total cash receipts, milk cows represented Ii 0 percent or more of all cows and sales of dairy products together with sales of cattle amounted to 60 percent or more of total receipts. A fann was a general farm if 76 percent or more of the cash receipts came from livestock, grain crops, dairy products and poultry and if it did not fan into any of the other categories. A farm was classified as miscellaneous If it was a truck farm Or a type not Included in the other five categories.
CATTLE AND CALVES . - - - . , (MILLIONS OF HEAD)
HOGS AND PIGS (MILLIONS OF HEAD)
?
°1924 I 1929 CALVES I 19341'"
/-HOGS AND PIGS ,
A
''I'
/\f \
,.
/ \
,I'
I \ /-'" I,
V
'I
"',
,
I
'w'
Ij
I 1939,
1944,
1949Fig. 1. Estimated annual sales of specified livestock classes by Iowa farmers, 1924·59.
98
\ I"
,
I
'
' ... , 'e-",
1~54 8 6TABLE 1. ESTIMATED NUMBER OF IOWA FARMS OF SPECIFIED TYPE. BY LIVESTOCK ENTERPRISE. 1954.
Livestock Cash Dairy Poultry All
enterprise Livestock grain products and egglO General Other farms
Cattle only .. -.~-"---"-",-... " . - " " " " " , - - - , , - , , , , , - , - , . '''''''''-''-''- 4.068 8.984 2.111 1.674 2.153 0 18.996 Hogs only ... ---.-_ .. _---... -... _---_._ ... -.-. 4.046 1.237 0 (i II 0 5.283
Cattle and hogs ...•... 119.665 19.829 11.401 iSS 10.848 0 162.",96
Neither cattle nOlO hOgS ... 0 1.852 0 1.GH 1.G74 1.674 q74
All farms ... 127.779 31,902 13.512 4.101 14.670 1.674 193.643
TABLE 2. ESTIMATED NUMBER OF IOWA FARMS HAVING SPECIFIED LIVESTOCK ON HAND. DEC. 31. 19G4.
Type of farm Cattle Hogs
All farm.- and calves and pig.
Llvedock 1:!7.779 122.li81 114,966
Cash grain ... . 31,902 26.304 18.294
Dni l"Y products ...•...•...••• 1:~.512 13.512 9,624
Poult.·y and eggs ..•...•... _._ .... _ ... _ 4.101 ~.427 71;3
General ...•... _ ... _ ... _ ... _ ... . 14.67~ 11.61iO 1l.50i
All farms ... _ ... _ ... _ ... : ... . 191.969 176.584 155.144
• Total number of farm~ excludes 1.674 farms in the "other" type of farm cat .. ",ory. Neither rattle nOr hogs Were "eported by IIny farm in thi.
categol'Y of Iowa farms.
TABLE 3. ESTIMATED NUMBER OF CATTLE AND CALVES ON SPECIFIED TYPE OF b'ARM. BY LIVESTOCK CLASS. DEC. 31. 1954.
Milk
Type of farnt stock
Live.tock ... 1.118.3
Cuh grain ... _ ... _ ... 176.3
Dairy products ... _... 246.2
Poultry and eggs ... 25.9
General ...• 126.9 Total ... 1.693.6 Beef breeding stock 1.098.9 195.9 40.4 9.2 80.4 1.424.8 Feeders All
Home raised Purchased Total cnttle
(1.000 heRd) 990.4 1.849.0 2.839.4 i •• 056.6 134.~ 100.5 234.7 606.9 :::1.8 1.1 34.9 321.5 10.8 0.9 11.7 46.8 5n.2 38.a ~3.~ 300.8 1.224.·1 1.989.8 3.214.2 6.332.6"
.. The United State. Department of Agriculture reports 6.161.000 head On hand on Jan. 1. 1955. See: Meat animals. t .. rm production. disposition and farm income by states. 1955-56. U. S. Dept. Agr •• Agr. Mkt. Serv .• Crop Reporting Board. Mt An 101 (57). April 1957.
Somewhat fewer farms reported cattle, calves, hogs 01' pigs on hand at the end of the 1954 calen-dar year than during the year (table 2). Total farm marketings of livestock were at a lower level in 1954 than in 1953 or 1955, as shown in fig. 1. Hence, livestock numbers on Dec. 31. 1954, were affected by the general upward movement in live-stock numbers. Though hog marketings were fivefold the number of cattle and calves sold by
Iowa fanners in 1954 and 1955, fewer farms re-ported hogs and pigs on hand than rere-ported cattle and calves.
Cattle and calves kept mainly for milk made up a major part of the total breeding stock on Iowa farms, as shown in table 3. Home-raised feeders on hand were fewer in total number than beef breeding stock or purchased feeders. Most of the purchased feeders were on livestock farms.
TABLE 4. ESTIMATED NUMBER OF HOGS AND PIGS ON SPECIFIED TYPE OF FARM. BY LIVESTOCK CLASS. DEC. 31. 1954. Type of farm Barrows and gUts Livestock ... 6.702.9 Cash grain ... _... 481.3 Dairy products ... 66.7
Poultry and eggs ... 35.1
General ... 463.4 Total ... 7.749.4 Sows and gilts 2.108.8 127.5 136.1 14.3 106.8 2.493.5 Boars andatags (1.000 head) 80.8 3.7 7.2 1.0 6.2 97.9 Pigs under 3 months 722.3 117.8 36.4 0.0 36.2 912.7 Total 9.614.8 730.3 246.4 50.4 611.6 11.253.5"
"The United States Department of Agriculture reports 11.156.000 head on hand On Jan. 1. 1955. For source. see footnote to table 3.
Livestock farms accounted for 80 percent of the cattle and calves on hand Dec. 31, 1954. Esti-mated average number of head of cattle and calves per farm ranged from 41 on livestock farms to 19 on poultry and egg farms.
Farm inventories of hogs and pigs were rela-tively small in relation to farm marketings, as illustrated partly in table 4. Livestock farms again accounted for most of the farm inventories on Dec. 31, 1954. Average number of head of all hogs and pigs on hand ranged from 84 on live-stock farms to 26 on dairy farms.
In July 1953, the sample of Iowa farmers was interviewed regarding various practices in the choice of markets. Considerable market informa-tion was available, according to these interviews. At least one daily newspaper was received by 89 percent of the farmers, while 93 percent received at least one farm paper or magazine. Despite the large proportion of farmers subscribing to both sources of information, only 5 percent of the farmers indicated the daily newspaper as the best source of information in making price forecasts 5 to 6 months ahead, while 21 percent indicated farm papers and magazines as best for this pur-pose. Radio, however, was listed as the best in-formation source on price forecasts by 14 per-cent of the farmers. Only 5 perper-cent specifically listed land-grant college and U. S. Department of Agriculture reports as best. Though a wide vari-ety of informational sources was indicated, at least 30 percent of the farmers did not compare prices in different markets for cattle or hogs.
Both buyer and seller cited the element of un-certainty in judging the market value of live-stock. Some livestock producers reduced this uncertainty by obtaining bids or price quotations from several different buyers. The 1954 survey data showed that bids or other price indications were obtained on 78 percent of the steers sold and on 67 percent of the mixed lots of steers and heifers sold. Also, 74 percent of the barrows and gilts sold were placed on bid or were priced before the sale. However, only 55 percent of the calves, 42 percent of the cows and bulls, 41 percent of the sows, 33 percent of the boars and stags and 100
27 percent of the vealers were handled in this manner. Moreover, in 1954, all feeder pigs were sold without prior bids or price indications.
A producer may decide to sell his livestock at a more distant market and, hence, he may com-pare prices at several markets. In the 1953 sur-vey, 74 percent of Iowa livestock producers re-ported making market price comparisons. These producers thus reduced some of the uncertainty of selecting the best market for their livestock.
Various practices were used in the comparisons of market prices. The average price was used by 60 percent of the producers making price compari-sons. The producers using the top price, the low price, or a price range were almost equally divid-ed. The different practices stemmed from differ-ences in livestock characteristics and in personal evaluations of different market characteristics.
Producers using the average price in making market comparisons were asked to list their rea-sons for this practice. Most of the respondents believed that they had average stock; hence, they expected an average price on their sales. Never-theless, a considerable element of pricing uncer-tainty was apparent in the replies obtained from the sample of producers.
LIVESTOCK CLASSES
Slaughter livestock made up the major part of the 3,777,000 cattle, 293,500 calves and 16,853,-300 hogs and pigs sold by Iowa producers in 1954
(table 5). Eighty-two percent of the cattle and 72 percent of the calves were intended for slaugh-ter. Marketings of slaughter hogs were 90 per-cent of the total sales of hogs and pigs.
Total purchases of cattle and calves in 1954 amounted to 64 percent of the total sales, while
TABLE 5. ESTIMATED NUMBER OF LIVESTOCK SOLD BY IOWA FARMERS FOR SPECIFIED USE. BY LIVESTOCK CLASS. 1954.
Intended use Cattle
Slaughter ... 3.074.8 Feeder ... 344.6 Herd or breeding... 311.1 Unknown ... 46.5 All uses ... 3.777.0 Calves (1.000 head) 211.1 64.6 14.9 2.9 293.5 Hogs and pigs 15.143.4 1.092.3 423.1 194.5 16.853.3
TABLE 6. ESTIMATED NUMBER OF LIVESTOCK PURCHASED BY IOWA FARMERS FOR SPECIFIED INTENDED USE.
BY LIVESTOCK CLASS. 1954.
Intended Use Cattle Calves
Feeder ...•....•... 2.148.5 Herd ... 150.9 All uses •.•... 2.299.4 Hog. and pigs 2.718.6 476.7 3.195.3
total purchases of hogs and pigs were 19 percent of total sales. Over 2 million head of each of the two major classes of livestock were purchased in 1954, as shown in table 6.
The 1954 survey data were used to examine the correlation, if any, between specialization in stock production and marketings of different live-stock classes. Iowa farms were classified into four groups with respect to the percentage of total cash receipts derived from livestock sales during 1954. The four percentage groups and the number of farms in each group were as fol-lows: Under 25 ... _ ... _ ... 36,009 25 to 49 .. __ ... _ ... 24,470 50 to 74 .... _ .... _ ... _ ... 39,741 75 and over ... 93,423 TotaL._ ... _ ... 193,643 Thus, nearly half of all Iowa farms in 1954 de-rived 75 percent or more of their cash receipts from the sale of livestock. 6
Iowa farms reporting livestock sales as less than half of total farm sales accounted for only 13 and 12 percent, respectively, of all cattle and calves sold and all hogs and pigs sold (table 7). These percentages, however, varied widely among the several livestock classes, particularly for cat-tle and calves. Only 6 percent of the steers sold originated among the less specialized producers (farms reporting livestock sales as less than 50 percent of total farm sales), but 33 percent of the dairy heifers, 30 percent of the dairy cows and 23 percent of the vealers originated among these producers. Less than 15 percent of the to-tal sales of any market class of hogs and pigs-barrows and gilts, sows, boars and stags, feeder pigs and gilts for breeding-originated from this producer group. A majority of the less special-ized livestock producers reported grain sales as a major source of cash receipts.
TABLE 7. ESTIMATED PERCENTAGE OF SPECIFIED
LIVE-STOCK SOLD BY IOWA FARMERS REPORTING SPECIFIED
DE-GREES OF ENTERPRISE SPECIALIZATION. BY LIVESTOCK
CLASS. 1954.
Livestock sales Steers COws All Air
as percent of and and cattle and hogs
total farm sales heifers bulls Calves ca.lves and pigs
Under 25 ... 4 19 14 7 5 25 to 49 ... _ 5 11 10 6 7 50 to 74 ... 14 24 29 16 23 75 and over ... 77 46 47 71 65 Total. ... 100 100 100 100 100 MARKET OUTLETS
The major markets used by Iowa producers in 1.954 and the total number of each located in Iowa,
• Farms reporting livestock sales as 50 percent or more of total cash receipts were somewhat greater In number in 1954 than in 1953. The earlier data served as a basis for the type-of-farm classification.
were as follows: 1 terminal public market, 49 packing plants and their packer buyers, 660 local independent dealers, 170 auctions and a large fraction of the 187,000 farms reporting sales of livestock. Local cooperative associations, of which 34 were reported, local retailers and miscellane-ous markets were unimportant in the state-wide pattern of livestock sales and purchases.1 In ad,.
dition, a large number of out-of-state marketl:! were available to Iowa producers.
Most cattle were sold through public stock-yards, auctions or packer buyers (including those at packing plants), as shown in table 8. Auctions, however, were the most important outlet for calves. Packer buyers and the public stockyards handled most of the hogs and pigs sold by Iowa farmers.
TABLE 8. ESTIMATED NUMBER OF LIVESTOCK SOLD BY IOWA FARMERS THROUGH SPECIFIED MARKETS. BY LIVESTOCK
CLASS. 1954.
Hogs
Market Cattle CalVes and pigs
(1.000 head)
Terminal public market ... 1.826.4 2.0 2.181.3 Direct to packing plants ... 533.7 10.2 2.153.7 Packer buyers ... 231.8 16.2 6.520.5 Local dealers ... 164.3 20.0 3.939.1 Auctions ... 651.0 213.1 777.7 Other farmers ... 321.8 26.8 811.6 Local cooperatives ... 4.1 0.0 197.5 Local retailers ... 17.3 0.0 1.4 Special sale. ... 9.7 0.0 36.1 Unknown ... 16.9 5.2 234.4 All market. .. ... _ ... 3.777.0- 293.5" 16.853.3b
• Total cattle and calves sold was 4.070.500 head. The United States Department of Agriculture reports 3.393.000 cattle and calves sold. but this excludes interfarm sales. (For source. See footnote. table 3). In-terfarm oales. plus the proportionate share of the "unknown" category in this survey. were 350.500 head. This number subtracted from 4-070.500 is equal to 3.620.000. which may be compared with the USDA figure of 3.393.000.
b.The USDA reports 16.613.000 head of hogs and pigo sold exclusive of mterfarm saies. Interfarm sales. plus a proportionate share of the "unknown" category in this survey. were 823.000 head. This number subtracted from 16.853.300 i. equal to 16.030.300. which may be com-pared with the USDA figure of 16.613.000.
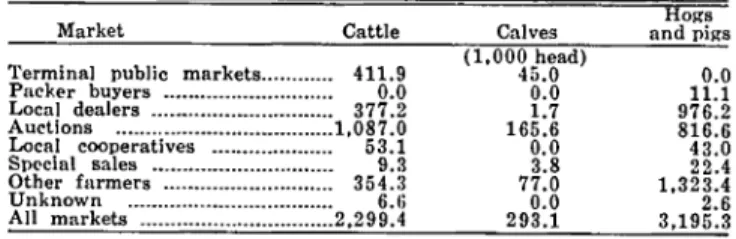
TABLE 9. ESTIMATED NUMBER OF LIVESTOCK PURCHASED
BY IOWA FARMERS THROUGH SPECIFIED MARKETS. BY LIVE-STOCK CLASS, 1954.
Market Cattle
Terminal public marketB ... _.... 411.9 Packer buyers ... 0.0 Local dealers ... _... 377.2 Auctions ... 1.087.0 Local cooperatives ... _... 53.1 Sp~clal sales ... 9.3 Other furmers ... 354.3 Unknown ... _ .... _ ... _ 6.6 All markets ... 2.299.4 Caives (1.000 head) 45.0 0.0 1.7 165.6 0.0 3.8 77.0 0.0 293.1 Hog. and pigs 0.0 11.1 976.2 816.6 43.0 22.4 1.323.4 2.6 3.195.3
The pattern of livestock purchases differed sharply from the pattern of sales (see table 9). Other fanners and auctions were more important as sources of livestock purchased than as market outlets for livestock sold. In addition, local deal-ers were an important source of feeder pigs.
Market choices among livestock producers var-ied according to the degree of specialization in livestock production (table 10). Much of this affinity between type of market and degree of specialization, however, was related to the market classes of livestock sold by different producers. Among producers with similar farm production characteristics and market classes of cattle and calves, a similar pattern of market selection was observed .
':rhese estimates of .the number of markets are based On a forth-comtng report on Iowa hvestock markets.
TABLE 10. ESTIMATED PERCENTAGE OF CATTLE AND CALVES SOLD BY IOWA FARMERS REPORTING SPECIFIED DEGREES OF ENTERPRISE SPECIALIZATION, BY MARKET OUTLET, 1954.
Livestock sales as percent of total farm sales
Terminal markets Under 25 ... 30 25 to 49 ...•... 24 50 to 74 ...•....•.•...•....••••...•.... 46 75 and over ... ... 50 Average ...•... 46
• Including sale. at packing plant •. • Less than 0.5 percent.
Packer buyers· 5 12 11 24 20 Local dealers Auctions 3 44 12 28 5 26 16 5 20
Other Local Other All
farmers cooperatives markets markets
18 0 Db 100
18 0 6 1UO
11 Db 100
6 0 Ob 100
8 Db 1 100
TABLE ll. ESTIMATED PERCENTAGE OF HOGS AND PIGS SOLD BY lOWA FARMERS REPORTING SPECIFIED DEGREES OF ENTER-PRISE SPEClALIZATlON, BY MARKET OUTLET, 1954.
Livestock sales Terminal
as percent of total farm sale.
Under 25 ... -.... -...
-
.... ---... ~ ... --... -.. -...25 to 49 ... --... -...
50 to 74 __ • • • • • __ • • • • • • • • • • • • _____ • • • • • u • • • • • • _ • • • • • • • • • • • • • • • • • • • • • _ _ _ _
75 and over ... _---... _-... _--_ ... _-...
A,erage •..• _ ... __ •..•.•••••... __ •...••..•....•••. _ •••.. ___ ·_n ••• ••••
• Including sales at packing plants.
b Less than 0.5 percent.
public markets 8 10 12 14 13 Packer buYers II 61 55 53 51 52
The uniformity in patterns of market selection among livestock producers is illustrated in the market choices in the sale of hogs llnd pigs (table 11). The distribution of market classes of hogs and pigs is almost the same among livestock pro-ducers reporting varying degrees of specializa-tion. Again, the distribution of market classes of livestock is a more reliable indicator of producers' selection of market outlets than the distribution of producers according to the percentage of total cash receipts derived from livestock sales.
Farm marketings of all cattle and calves were quite uniformly distributed over the year. Con-siderable differences occurred, however, among the market classes listed in table 12. The time of marketing among various livestock classes was related through the production process that gen-erated these marketings, such as milk production or breeding of cattle kept mainly for beef. Most of the variability in the bimonthly marketing pat-tern for cattle and calves was related to the out-puts of these two types of livestock enterprises.
Bimonthly sales of hogs and pigs (table 13) followed the characteristic seasonal pattern asso-ciated with hog marketings. The 1954 calendar year marked the beginning of a secular trend to-ward earlier farrowings and earlier marketings.
Farm purchases of cattle and calves during 1954 corresponded in their temporal pattern with farm marketings of feeder calves (table 14). Most feeders were purchased during the last 4 months of the year.
The bimodal purchase pattern for hogs and 102
Local Other Local Other All
dealers Auction. farmers cooperatives markets markets
16 8 7 0 0 100
29 3 2 0· 1 100
~7 2 4 2 Ob 100
23 6 5 1 Ob 100
24 5 5 1 Ob 100
pigs correlated with the spring and fall pig crops (table 15). In 1954, a major part of the barrows, gilts and sows were purchased during the first quarter-year, while boars, feeder pigs and gilts for breeding were purchased during the final 3-or 4-month period. Though practically all the sows, boars and gilts purchased were intended for breeding, a marked difference existed in the bi-monthly distribution of purchases. For all market classes, however, only a few purchases were re-ported during July and August.
PRODUCER ATTITUDES
Panel members were interviewed regarding their reasons for selling each lot of livestock through the specified market rather than through an alternative market.s Essentially, four major
types of reasons were given: the degree of market competition, mostly in terms of market price; the location and convenience of the market; the type of animal sold; and various special reasons stated by a relatively small number of respondents. All reasons were given on the basis of number of head of livestock involved rather than the number of lots.
The degree of competition at the preferred market-indicated by the number of buyers and sellers-was stated as the most important reason for each of the three major classes of livestock sold. The notion of "most competition" was
TABLE 12. ESTIMATED PERCENTAGE OF CATTLE AND CALVES SOLD BY IOWA FARMERS IN SPECIFIED MONTHS. BY LIVESTOCK CLASS, 1954.
Steers and Dairy Beef Dairy All
Bimonthly period heifers heifers Bull. Cows cows Calve. Vealers cla.ses
Jan, · Feb. • • • • • • • • • • • • • • • • • • • • • • • h . . . n . . . u • • • • • • • • 15 10 18 27 IH 7 13 16 March
.
April • • • • • • • u . . . 15 2 17 17 1~ 8 2~ 15 May · June --_. __ ... ---... 16 12 14 11 16 8 22 16 July · Aug. ... -... __ ._--.-... 18 23 14 12 9 3 17 16 Sept.·
Oct. ... 20 12 16 11 20 29 11 19 Nov. · Dec. • • • • • • • • • • • • • • • • • • • • • • • • • • • • • • • • • • • • _ . . . • u . . . · u 16 41 21 22 25 45 15 18 Total ... 100 100 100 100 100 100 100 100TABLE 13. ESTIMATED PERCENTAGE OF HOGS AND PIGS SOLD BY IOWA FARMERS IN SPECIFIED MONTHS, BY LIVESTOCK CLASS, 1954.
Bimonthly perlcd and gilts Barrows
Jan .• Feb. ... 15 March· April ... __ .... __ ... _ ... _... 17 May. June ... _... 11 July. Aug. ... ... 9 Sept .• Oct ... _... 20 Nov •• Dec ... __ ... 28 Total. ... 100 Sows 7 10 :15 29 11 S 100 Boars and stags 9 :17 12 6 14 22 100 Feeder Gilts (or All pigs breeding ela •• es 24 32 15 12 ~7 16 12 6 14 27 12 14 4 19 11 17 24 100 100 10(1 'fABLE 14. ESTIMATED PERCENTAGE OF IOWA FARM PURCHASES OF CATTLE AND CALVES IN SPECIFIED MONTHS, BY LIVE-STOCK CLASS, 1954. Steers D"\iry Beef Dairy All Bimonthly period and heifers heifers Bulls cOws cows Calves elasses Jnn. · Feb. ... 11 29 10 20 15 7 11 March . April • . . . u ... _ . . . 13 10 20 2:! :1 12 May · June • • • • • • • • • 0 4 . . . 0 4 . . . 6 7 2~ 11 6 3 6 July · Aug. . . . u • • • • • • 8 0 17 7 4 8 Sept . . Oct. • . . . n . . . _ • • • • • • • • 38 0 11 18 26 63 39 Nov. . Dec. • . . . _ . . . . d . . . 24 54 18 35 30 20 24 Total ... __ ... 100 100 100 100 100 100 100 TABLE 15. ESTIMATED PERCENTAGE OF IOWA FARM PURCHASES OF HOGS AND PIGS IN SPECIFIED MONTHS, BY LIVESTOCK CLASS, 1954. Bimonthly period and gilts Barrows Jan .• Feb. ... 29 March· April ... 39 May. June ... ... 13 July. Aug ... -- ... .. Sept .• Oct. ... 6 Nov •• Dec. ... 8 TotaL ... _ ... 100 Sows 30 34 21 :1 ;; 7 100 Boars and stags 10 9 5 3 21 52 100
Feeder Gilt. for All
pigs breeding classes
17 13 17 14 17 16 11 6 11 9 4 II 22 35 22 27 25 26 100 100 100 103
vealed as the most important reason cited with reference to a third of the cattle and calves sold and over a fourth of the hogs. The "most con-venient" market, however, was the dominant rea-son in the choice of the specified market outlet for hogs, while "type of animal" and "special con-siderations" were relatively more important in the choice of market outlets for calves than for cattle and hogs.
Producers' attitudes on choice of markets were related to the market outlets used for each class of cattle (table 16). Thus, price or the degree of competition was most important with reference to the primary market outlets for slaughter cat-tle. The belief that a particular market offered the best price was important with respect to pack-er buypack-ers and dealpack-ers (who frequently quoted a price to the producer upon examination of the livestock) . The idea of a favorable degree of competition at the terminal market or the packing plant encouraged many producers to select these markets, though a specific price for the cattle was not quoted prior to shipment to the market outlet. Convenience, type of animal and miscellaneous considerations were important in the choice of the primary market outlets for feeder cattle and cattle intended for breeding purposes. Special con-siderations were important in the sales to packer buyers. Producers generally expressed a prefer-ence for a net price transaction, or one that did not involve deductions for commissions and other charges. Some producers were solicited by the buyer, or the buyer quoted a price. These prac-tices were cited also among the special considera-tions in table 16.
The notion of a competitive market was an im-portant consideration in the choice of market out-lets for calves and vealers (table 17). However, the number of sales through market outlets other than auctions was relatively small. Hence, the
reasons cited with reference to the other markets pertained to. a relatively small number of sales.
The degree of competition was cited most fre-quently as a reason for selecting terminal markets rather than any alternative markets in the sale of hogs (table 18). Price was cited more frequently in connection with the market agencies having personnel customarily visit farms and quote a price upon inspection of the hogs of marketable weights. Convenience was mentioned most fre-quently with reference to the leading markets for hogs. Auctions were selected because of two re-ported considerations-the occurrence of a high degree of competition and the suitability of these markets for the sale of feeder pigs.
MARKET CHOICES FOR CATTLE AND CALVES
The patterns of marketings and purchases of cattle and calves of Iowa producers for each of the major markets-public stockyards, packer buyers, local dealers, auctions and other farmers-involve essentially two important variables: the market class of livestock and the distance to market. The implications of these two basic ele-ments of market selection are discussed in later sections of this report. Presently, the market choices for different market classes of cattle and calves are examined with reference to their sales and purchases by Iowa livestock producers.
SALES
In table 19, sales of the major market classes of cattle and calves in 1954 are shown according to intended use. In 1954, practically all slaughter cattle and calves were beef animals. Only 10 percent of the total sales intended for slaughter were. dairy heifers, dairy cows or vealers.
Fur-TABLE 16. ESTIMATED PERCENTAGE OF CATTLE SOLD THROUGH SPECIFIED MARKET, BY REASON FOR CHOICE OF MARKET, IOWA. JAN. .. TUNE. 195~.
'ferminal public Reason markets Most competition ...••.... 42 Best price ... 24 Most convenient ... 24 Type of animal... ... 8 Special considerations ... 2 All reasOns ... 100 Packing plants 48 18 12 4 18 100 Packer buyers 26 32 2 8 32 100 Local dealers 23 61 5 4 7 100 All Auctions Farmers markets 27 0 36 9 11 23 26 0 19 36 64 14 2 25 8 100 100 100 TABLE 17. ESTIMATED PERCENTAGE OF CALVES AND VEALERS SOLD THROUGH SPECIFIED MARKET, BY REASON FOR CHOICE OF MARKET, IOWA. JAN.-JUNE. 1953. Termmal public Reason markets Most competition ... 92 Best price ... ... 8 Most convenient ... 0 Type of animal... 0 Special considerations ... 0 All reasons ... 100 Packing plants 81 o 14 o 5 100 Packer bUyers 19 15 31 7 28 100 TABLE 18. ESTIMATED PERCENTAGE OF HOGS SOLD THROUGH SPECIFIED IOWA. JAN.·JUNE. 1953. Terminal public Reason markets Most competition ... 60 Best price ... 16 Most convenient ... 16 Type of animal... 8 Special considerations ... 0 All reasons ... 100 104 Packing plants 34 20 33 6 7 100 Packer buyers 22 35 30 9 4 100 Local dealers 62 14 24 o o 100 MARKET, Local dealers 18 33 .40 2 7 100 BY Auctions 40 14 16 ~9 1 100 REASON FOR Auctions 35 9 H 31 11 100 Farmers o o o 10 90 100 All markets 40 11 18 17 14 100 CHOlCE OF MARKET, All Farmers markets 0 27 2 28 46 32 7 7 45 6 100 100
TABLE 19. ESTIMATED PEROENTAGE OF SPECIFIED CLASSES OF OATTLE AND OALVES SOLD BY IOWA FARMERS. BY IN·
TENDED USE. 1954."
Intended use after sale
Livestook class Slaughter Feeder
Steers ... 57.4 42.7 Beef heifers ... 18.3 9.8 Dairy heifers ... 0.7 0.2 Mixed steers and heifers... 7.9 29.3 Beef cows ... 4.4 1.4 Dairy oows ... 3.7 0.0 Bulls ... 1.2 0.8 Calves ... 6.4 15.8 All classes ... 100.0 100.0 Herd 0.0 24.9 15.4 0.0 17.7 26.1 11.0 4.9 100.0 • These perc('ntages may be converted into absolute values by using the data in table 5.
thermore, less than 0.5 percent of the total feed-ers were dairy stock. Dairy heiffeed-ers and dairy cows, however, accounted for 41 percent of the total sales of breeding stock.
SLAUGHTER CATTLE AND CALVES
Terminal public markets were the principal market outlet for all slaughter steers and heifers, except dairy heifers (table 20). Auction markets, however, were the most important outlets for the livestock sold less frequently at terminal markets -cows, bulls and calves. Packer buyers, though not a highly favored market for anyone market class, accounted for the second largest percentage of the total sales of livestock sold in the largest numbers-steers and heifers, including the mixed
lots of steers and heifers. .
Public terminal markets, packing plants and auctions were the principal market outlets used by Iowa farmers in the sale of cattle and calves. Practically all-99.9 percent-of the cattle and calves sold by farmers to packing plants, either directly or through packer buyers, were intended for slaughter. A major part of all the cattle sold through the other specified markets were slaugh-ter cattle. Only 4 percent of the sales through
terminal markets were not for slaughter, while 21 percent of the sales through dealers and 36 per-cent of the sales through auctions were in the herd or feeder category.
Sales of slaughter cattle and calves occurred quite uniformly during the year. The third quar-terly period, however, was marked by an increase in the rate of marketings through the two most important outlets, terminal markets and packer buyers (table 21). Sales through packer buyers and local dealers were marked by an inverse cor-relation in the bimonthly percentages for these t.wo outlets.
FEEDER CATTLE AND CALVES
Auctions or local sales barns were the major market outlets for feeder cattle and calves (table 22). Each market class had, however, a unique percentage distribution of market outlets. The bimonthly distribution of sales through each of four major market outlets generally corresponded to a pattern of peak sales during the winter months and lower sales during July and August
(table 23).
BREEDING CATTLE AND CALVES
Sales of breeding stock accounted for only 8 percent of total 1954 sales of cattle and calves. Bulls and calves, moreover, made up less than 16 percent of the total sales of breeding stock. Hence, the data in table 24 on market outlets are based on a rather limited number of reports. Never-theless, in comparison with the tabular material cited earlier, a consistent pattern of market selec-tion is presented in table 24.
Sales of breeding stock, which were composed
TABLE 20. ESTIMATED PERCENTAGE OF SLAUGHTER OATTLE AND CALVES SOLD BY
MARKETS. BY LIVE'lTOCK CLASS. 1954. IOWA FARMERS THROUGH SPECIFIED
Market Steers
Beef DaIry Mixed .teers Beef heifers heifers and heifers cows Terminal publlo markets ... 61.8
Packing plants- ... 27.4 Local dealers ... 2.9 66.6 3.5 40.6 36.0 20.2 42.7 25.7 14.2 5.0 22.0 9.2 4.5 Auctions ... 6.8 7.4 28.9 20.0 43.8 Farmers ... 0.6 0.3 0.0 0.0 1.5 Other markets ... 0.5 0.5 2.9 4.5 0.0 All markets ... 100.0 100.0 100.0 100.0 100.0
• Including sales through packer buyers.
DaIry cows 24.1 26.0 4.1 45.7 0.0 0.1 100.0 Bulls 34.6 6.6 4.9 53.9 0.0 0.0 100.0 Calves 0.9 12.5 9.2 77.4 0.0 0.0 100.0 All classes 53.8 24.2 4.6 16.3 0.5 0.7 100.0
TABLE 21. ESTIMATED PERCENTAGE OF SLAUGHTER CATTLE AND CALVES SOLD BY IOWA FARMERS IN SPECIFIED MONTHS. BY MARKET. 19;;4.
Terminal
Bimonthly public
period mal'ketH buyers· Pa(·ker deale,:. Local Auctions Other markets All
Jan .• Feb. ... 16 8 12 16 24 14 15 7 19 29 14 18 26 19 20 17 24 17 17 14 20 19 23 13 11 20 16 15 16 2 15 100 100 100 100 100 March. April ... _... 13
r..i; :
i~':r~::::::::::::::::::::::::::::::::::::::::::::::::::::::::::::::::::::::::::::::::::::::::::::::::::::::::
U
Sept .• Oct. ... 22 Nov •• Dec. . ... _.... 15 'I'otaL ... _... 100 - Including sales at p:1cklng plants.TABLE 22. ESTIMATED PERCENTAGE OF FEEDER CATTLE AND CALVES SOLD BY IOWA FARMERS THROUGH SPECIFIED MARKETS. BY LIVESTOOK CLASS. 19fi4.
MIxed steers Cow. and All
Market Steers Heifers and heifer. bulls Calves classes
Terminal public markets ... _ ... _... 15.1 Local dealer. .. ... _... 9.5
§ff¥E~i~~:: ~~ ~~~ ~~ ~~~ ~~~~~~~~ ~~~~~ ~~~~~ ~~~ ~~~~~~~~ ~~~~~~~~~~~~~~ ~~~~~~~~~~~~~~~~~~~~~~~~~~~~~~~~~~~ ~~~~~~~~:::~ :::~~ ~~
I!!
~
!
6.4 26.6 63.5 0.2 16.3 17.0 3.4 0.0 1.0 6.9 61.1 50.8 7.6 72.5 52.4 15.5 19.2 28.9 26.3 24.2 0.0 0.0 0.0 0.0 0.2 100.0 100.0 100.0 100.0 100.0 105TABLE 23. ESTIMATED PERCENTAGE OF FEEDER CATTLE AND CALVES SOLD BY IOWA FARMERS IN SPECIFIED MONTHS, BY MARKEl'. 19;;4.
'l'erm,maI
BimonthlY public LO!'al Other All
period markets dealers Auctions farmers markets
Jan. -Feb. ... 0 13 20 43 22 ~:~c~ ju~~ri.I .. ::::::::::::::::::::::::::::::::::::::::::::::::::::::::::::::::::::::::::::::::::::::::::::::::::::::::::: 4~ ~~:;t.·.-t'c1:
:::::::::::::::::::::::::::::::::::::::::::::::::::::::::::::::::::::::::::::::::::::::::::::::::::::::::::::::
1~ 40 17 7 0 13 9 2 22 9 19 7 7 5 3 7 16 Nov .• Dec. ... ... 40 23 34 29 33 TotaL ... 100 100 100 100 100 TABLE 24. ESTIMATED PERCENTAGE OF HERD CATTLE AND CALVES SOLD BY IOWA FARMERS THROUGH SPECIFIED MARKETS, BY LIVESTOCK GLASS. 19:;4. Beef UalrY Market heifers heifers Local dealers ... ... ... ... 3.7 5.6 Auctions ... 9.6 :14.2 Farmers ... ... 86.7 58.9 Other ... 0.0 1.3 AI! markets ... 100.0 100.0 largely of heifers and cows, followed the same bi-monthly pattern as the sales of feeder cattle and calves (table 25). Since sales through other markets constituted only 2.4 percent of total sales, data on bimonthly sales through these markets were not shown separately. TABLE 23. ESTIMATED PERCENTAGE OF HERD CATTLE AND CALVES SOLD BY IOWA FARMERS IN SPECIFIED MONTHS, BY MA"RKET. 19;;4. Bimonthly Local period dealers JMan. h- FeAb ... ,... '3'ur: arc _ prll ... .. May - June... 1 July - Aug... 0 Sept. • Oct... ... 42 Nov. - Dec... 22 Total... ... 100 Auctions 23 10 6 21 27 I " .) 100 PURCHASES Farmers 25 14 8 4 13 36 100 All markets 23 I:! 9 9 18 28 100Purchases of cattle and calves according to in-tended use included largely steers, heifers and calves (table 26). Only two market classes of cattle and calves were included among the pur-chases of feeders, as compared with seven market classes among feeder sales. Since the purchases of feeders constituted 90 percent of the total pur-chases of cattle and calves, estimates on four of the six market classes in table 26 are based on a rather small number of reports.
TABLE ~6. ESTIMATED PEaCENTAGE OF SPECIFIED CLASS OF CATTLE AND CALVES PURCHASED BY IOWA FARMERS, BY IN_
TENDED USE. 19;;4.'
Intended use after purchase
Livestock class Feeder Herd
Steers and/or heifers ... 88.6 12.1 Dairy heifers ... 0.0 10.7 Beef cows ... 0.0 13.0 Dairy cows ... 0.0 38.G Bulls ... 0.1 13.3 Calves ... 11.3 12.3 All classes ... 100.0 100.0
n These percentages may be converted into absolute vnlues by using
the data in table G.
FEEDER CATTLE AND CALVES
Auctions were the primary market sources, while terminal markets, local dealers and other farmers were secondary market sources for feeder cattle and calves purchased by Iowa farmers (table 27). Frequently the auction markets served as outlets for feeder cattle and calves purchased by the auction operators on their own account. Local 106
Beef Uairy An
cows cows Bulls Calves classes
0.0 3.5 4.5 0.0 3.2
37.8 29.1 24:1 26.3 25.9
61.0 62.3 65.4 73.7 68.5
1 .) 5.1 5.4 0.0 2.4
100.0 100.0 100.0 100.0 100.0
TABLE 27. ESTIMATED PERCENTAGE OF FEEDER CATTLE
AND CALVES PURCHASED BY IOWA FARMERS THROUGH SPE-CIFIED MARKETS. BY LIVESTOCK CLASS, 19;;4.
Steers and
Market heifers
Terminal public markets ... 19.0 Local dealers ... 17.1 Auctions ... 47.6 Local cooperatives ... __ ... 2.5 Farmers ... 13.8 Other ... 0.0 All markets ... 100.0 Calves 16.5 0.3 56.4 0.0 25.6 1.2 100.0 All classesR 18.7 15.2 48.6 2.2 15.1 0.2 100.0 • Purchases of beef cows and bull., which Were made entirely
through auctions, are included.
dealers also used these markets to sell feeders bought directly from ranchers.9
A major part of the 1954 purchases of feeder cattle and calves occurred during the fourth quar-ter (table 28). Furthermore, the major purchases of feeders occurred somewhat earlier in the fall than did the major sales of feeders by Iowa farm-ers. This pattern of sales and purchases was related partly to the number of cattle and calves on hand. The bimonthly patterns of market transactions in feeder cattle and calves, therefore, were subject to change during the cycle (that started in 1949 and reached a peak in cattle in-ventories in 1956).
BREEDING CATTLE AND CALVES
Though the purchases of breeding stock were small, a variety of market classes and market sources were involved in 1954 (table 29). How-ever, auctions and other farmers were reported as the market sources of 84.3 percent of total pur-chases. Again, the individual percentages must be interpreted with somewhat more caution than the estimates based on a large number of sales.
Breeding cattle and calves were purchased largely during the fall and winter months (table 30). Typically. only 16 to 17 percent of the pur-chases occurred during the May through August period.
CHANGES IN MARKET CHOICES, 1940-54 Market selection among Iowa livestock pro-ducers changed somewhat over the 14-year period from 1940 to 1954 (table 31). In terms of total sales and purchases of Iowa producers, the
per-• Additional d"ta on the operation of Iowa livestock markets are re-pOl'led in the forthcoming l'eport cited earlier.
TABLE 28. ESTIMATED PERCENTAGE OF FEEDER CATTLE AND CALVES PURCHASED BY IOWA FARMERS IN SPECIFIED MONTHS. BY MARK!';T. 1954.
l'ermlnal
Bimonthly public Local All
Farmers
period markets d~alers Auctions Other markets
6 1-1 " 79 11 6 Ifi 18 U U 5 Ii 8 II Ii 14 9 I 21 8 54 :~ :: -If) 0 39 15 2:! 2:1 (J
24
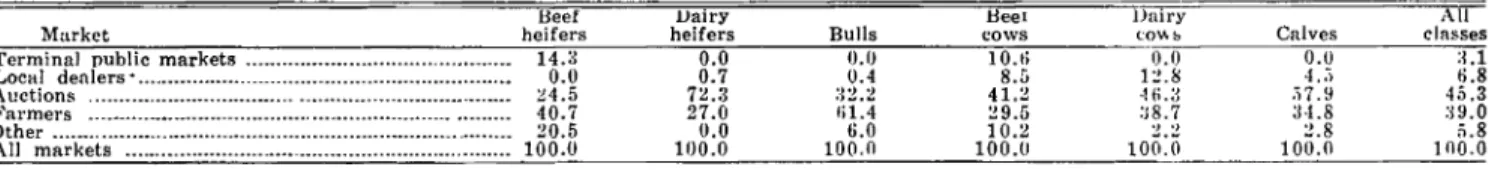
100 100 100 100 100TABLE 29. ESTIMATED PERCENTAGE OF HERD CATTLE AND CALVES PURCHASED BY IOWA FARMERS THROUGH SPECIFIED MAR-KETS. BY LIVESTOCK CLASS. 19r.4. . Beef
Market heifers
Terminal public markets ... 14.:l Local dealers' ... 0.0 A"ctions ... ... ~4.5 ~'al'mers ... .•... 40.7 Other ... 20.5 All markets ... 100.0 Dairy heifers 0.0 0.7 n.3 27.0 !I.O 100.0 Bulls 0.0 0.4 :12.2 1)1.4 6.0 100.0 Heel cows 10.li 8.[,
41.2
~9.{j 10.2 100.0 Dairy All<':O\\b Calves classes
0.0 0.0 :1.1 12.8 Li 6.8 -ltl.:{ .>7. ~J 45.3 :;8.7 3·1.8 :;9.0 0' 0' 2.8 ii.8 100:0 100.n 100.0
TABLE :;0. ESTIMATED PERCENTAGE OF HERD CATTLE AND CALVES PURCHASED
BY MARKIeT. 19:;4. BY IOWA FARMERS. IN SPECIFIED MONTHS.
Bimontbly All
period Auctions Farmel's Other m;:lI'ket'8
Jan. - Feb. ... ... 11 14 :::~ UI
March - April ... ... 14 ~ .) 1 :{ 18
May ~ June ...• _ •.•.•...•...• __ .. _ .... _... [) 11 iti 9
july - Aug •... _ ...•... _... l!! .) II 7
Sept. - Oct. ... ... ... ... ... ... .... ... ... .... 1 Ii 1 i :!7 1 ~I Nov. - Dec. ... ... ·111 ~8 I:! ~2
Totai.. ... 1111) 11)1. 100 100
'fABLE 31. ESTIMATED TOTAL SALES AND PURCHASES OF CATTLE AND CALVES THROUGH SPECIFIED MARKETS. BY LIVE-STOCK CLASS. IOWA 1940 AND 19;;4 "
Sales P\lrch'l.s~s
Marht Slaughter Feeder Herd Total Feeder Herd Tot'll
1~40 1954 1940 1954 1940 UJ54 1940 19;;4 1940 19,,4 1940 1954 19-10 1951 (1.000 he~d)
Terminal public market ... l.364 1.789 54 67 ~2 1\ 1.440 1.857 816 ·I;;~ 9 5 825 ·158 Packing plants ... 541 805 29 n 7 (I 577 80;; I) 0 II II 0 0 Local dealers ... ... 26:1 150 61 29 14 11 338 189 n2 368 H 12 ~41 380 Concentration yards ... 43 Ob 21 Ob a Ob 67 0" 86 011 2 Ob 88 Oh Auctions ... 135 542 57 218 36 85 228 845 584 1.179 29 78 r.1~ 1.2:;7 Local cooperatives ... :17 II 2 0 2 2:l~ 2g 37~ 4~~ :lg~ 0 7Q. [,~~ 4~B ri{':;,';:':k:t~d .. ~:~~:.~ .. ::::::::::::::::::::::::::::2.4~~ :1.3~g ~~~
m
1~~ 330 2.916 4.070 2.318 2.421 11~ 172 2.4:);; 2.593 • Based on 1940 data reported in S. D. Agr. Exp. Sta. Bul. 365 ani on 1954 data obtained from the Livestock Marketing Survey cited e,rlier in this report. Estimated sales or purchases through unspecified mnrkets ar~ distributed proportionately among the specified mm'kcts; hence, the8e to· tals differ from those in table 7.b Farm survey data for 1940 show that about two-thirds of the conceatration yards ;n the Corn Belt Were owned by local dealers. while packing plants owned one-third of the yards. The 1954 survey data do not include this additional market characteristic. Hence. differences in sales and pur-chases through packing plants and local dealers for the 2 years are partly due to this difference in classification.
centage shares for terminal public markets, local dealers and other farmers were reduced, but for auction markets these percentages increased. Sales to packer buyers, including sales directly to
pack-ing plants, accounted for about 20 percent of total
sales over this 14-year period. In terms of abso-lute changes in the number of cattle and calves bought and sold, auctions, packing plants and ter-minal markets were more important in 1954 than in 1940 as outlets for cattle and calves. In addi-tion, purchases through auctions increased two-fold during this period. These increases in sales and purchases were associated largely with the secular growth in livestock numbers, though some of these changes were due also to the decline in sales through local dealers.
MARKET CHOICES FOR HOGS AND PIGS Sales and purchases of hogs and pigs are in-fluenced sharply by the breeding intentions of producers. Increases in hog numbers are associated first with the withholding of gilts for breeding purposes. Marketings of slaughter hogs thus may not correspond with the number of pigs saved 6
to 9 months earlier. A change in the sex distri-bution of farm marketings, therefore, is an early indication of changes in breeding intentions and the size of the pig crops 6 to 18 months later. This cyclical pattern of hog production and mar-ketings must be recognized in the interpretation of data on sales and purchases of hogs and gilts.
SALES
In 1954, 80 percent of all hogs and pigs sold by Iowa producers were slaughter barrows and gilts, 7 percent were feeder pigs, and onlY 1 percent were gilts for breeding (table 32). The remain-ing 12 percent of total sales comprised sows, boars and stags which were sold for slaughter or breeding purposes.
TABLE :)2. ESTIMATED PERCENTAGE OF SPECIFIED CLASSES OF HOGS AND PIGS SOLD BY IOWA FARMERS. BY INTENDED
USE. 19.i4."
Intended use after tm.le Market class Slauo:hter Feeder Herd B"rrows and gilts... 88.1 0.0 0.0 Sows ... 11.5 0.0 :)2.7 Boars and stags ... 0.4 0.0 27.0
Feeder pigs ... 0.0 100.0 0.0 Gllts for breeding ... 0.0 0.0 40.2 All classes ... 100.0 100.0 100.0
R These percentages may be converted into nbsolnte vaiu('s hy lH~ing
the data in table 5.
SLAUGHTER HOGS
Packer buyers, including direct sales to packing plants, local dealers and terminal markets repre-sented the market outlets for 97.4 percent of the slaughter hogs sold by Iowa producers in 1954 (table 33). The percentage distribution of sales among the major market outlets was quite similar among the three market classes of hogs, except perhaps for the somewhat larger sales of boars and stags through auctions.
In summary, the distribution of the annual Iowa hog marketings among alternative livestock mar-kets differed greatly from the distribution of marketings of cattle and calves. A number of factors may account for this difference. First, the value of an average lot of hogs was less than the value of an average lot of cattle and calves. Moreover, the skills required in selling slaughter hogs generally were less-at least in the opinion of the producer-than the skills required in sell-ing cattle. Hence, proximity to market was a more important consideration in the sale of hogs than the specialized services available at more distant markets.
Bimonthly sales of slaughter hogs followed a bimodal distribution, as suggested by table 34. The bimonthly pattern differed, however, among the several market outlets. Sales through local dealers were marked by the smallest degree of intertemporal variability, while sales through the minor slaughter hog markets were exceptionally variable from month to month.
FEEDER PIGS AND OTHER HOGS
Other farmers and auctions were the major market outlets for feeder pigs and hogs intended for breeding purposes (table 35). The bimonthly pattern of feeder pig sales through the two major market outlets shows a bimodal distribution com-parable to the sales pattern for slaughter hogs, except for a time-interval lag of 2 to 4 months (table 36). The intertemporal pattern changes abruptly, however, depending upon the position of the hog cycle and producers' breeding intentions. Sales of breeding stock were concentrated in the first 3 or 4 months of the 1954 calendar year (table 37). The intertemporal sales pattern for breeding stock departed from the bimodal sales distributions cited earlier, partly because of pecu-liarities in the monthly pattern of sows farrow-ing. Breeding stock purchased early in 1954 were available for production of both the spring and fall pig crops. Typically, part of the sows farrow-ing in the sprfarrow-ing would be kept through the sum-mer for breeding later in the same calendar year. The monthly level of sales of breeding hogs would be influenced, therefore, by the extent of multiple farrowings during the year.
PURCHASES
Pig purchases were made up almost entirely of feeder pigs, though a small number of pigs
in-tended for breeding purposes at some later time 108
-TABLE 33. ESTIMATED PERCENTAGE OF SLAUGHTER HOGS ANO PIGS SOLD BY IOWA FARMERS THROUGH SPECIFIED
MARKETS, BY LIVESTOCK CLASS, 1954.
Barrows Boars All
Market and gilts Sows and stags classes
Terminal public markets ...••.. 13.8 19.0 13.1 14.4 Packer buyers' ...•..•... 58.5 49.4 51.4 57.4 Local dealers ... 25.4 27.8 15.7 25.6 Auctions ....••... 0.8 2.7 18.1 1.1 Local cooperatives ... 1.4 0.7 1. 7 1.3 Other ... 0.1 0.4 0.0 0.2 All markets ... 100.0 100.0 100.0 100.0
• Including sales at pscklng plant.
TABLE 34. ESTIMATED PERCENTAGE OF SLAUGHTER HOGS
SOLD BY IOWA FARMERS IN SPECIFIED MONTHS, BY
MAR-KET, 1954.
'l'erminal
Bimonthly public Packer Local All
period markets buyers' dealers Auctions Other market.
Jan. Feb ... 11 13 17 16 37 14 March - ApriL. ... 14 17 15 30 3 16 May _ June... 14 14 15 23 13 14 July - Aug ... 11 10 15 2 3 12 Sept. Oct ... 21 20 16 13 30 19 Nov. _ Dec ... 29 26 22 16 14 25 TotaL ...• I00 100 100 100 100 100
n Including direct to packing plant.
TABLE 35. ESTIMATED PERCENTAGE OF FEEDER AND HERD HOGS AND PIGS SOLD BY IOWA FARMERS THROUGH
SPECI-FIED MARKETS. BY LIVESTOCK CLASS, 1954.
Feeder Breeding or herd use
Market pigs Sows Boars Gilts
Terminal public market. 0.7 0.0 0.0 0.0
Local dealers ... 6.2 0.2 0.3 4.0 Auctions ... 48.3 12.9 12.4 27.6 Farmers ... 44.1 81.9 84.7 65.3 Other ... 0.7 5.0 2.6 3.1 All markets ... 100.0 100.0 100.0 100.0 Total 0.0 1.8 18.7 76.1 3.4 100.0
TABLE 36. ESTIMATED PERCENTAGE OF FEEDER PIGS SOLD BY IOWA FARMERS IN SPECIFIED MONTHS. BY MARKET, 1954.
Bimonthly Local All
veriod dealers Auctions l"armers markets
Jan. - Feb... 2 30 18 24 March - ApriL... 0 14 13 12 May - June... 0 14 12 12 July - Aug... 22 16 40 27 Sept. _ Oct... 54 19 4 14 Nov. - Dec... 22 7 13 11 TotaL. ... 100 100 100 100
TABLE 37. ESTIMATED PERCENTAGE OF HERD HOGS, SOLD BY IOWA FARMERS IN SPECIFIED MONTHS, BY MARKET, 1954.
Bimonthly All
period Auctions Farmers Other markets
Jan. - Feb... 33 34 54 35 March _ ApriL... 23 35 26 32 May - June... 2 6 19 ,6 July - Aug... 10 3 1 4 Sept. _ Oct. ... 12 7 0 8 Nov. - Dec... 20 15 0 16 Total ... 100 100 100 100
TABLE 38. ESTIMATED PERCENTAGE OF SPECIFIED CLASS OF HOGS AND PIGS, PURCHASED BY IOWA FARMERS, BY
INTEND-ED USE. ] 954."
Intended use after vurchase
Livestock class Feeder Herd
~::.~ow.~ ... ~~~ ... ~.i.~~~ ... ::::::::::::::::::::::::::::::::::::::::
g:i
2g:8
Boars and stags ... 0.1 19.1 Pigs ... 96.5 7.3 Gilts ... 0.0 48.6 All classes ... 100.0 100.0 • These percentages maY be converted into absolute values using the data