2014 International Conference on Machine Learning and Cybernetics, ICMLC2014, Lanzhou, China, 13-16 July 2014
MISSING VALUE IMPUTATION FOR THE ANALYSIS OF INCOMPLETE
TRAFFIC ACCIDENT DATA
RUPAM DEB1, ALAN WEE-CHUNG LIEW1
1School of Information and Communication Technology, Griffith University, Australia E-MAIL: [email protected], [email protected]
Abstract:
Road traffic accidents are a major public health concern, resulting in an estimated 1.3 million deaths and 52 million injuries worldwide each year. All the developed and developing countries suffer from the consequences of increase in both human and vehicle population. Therefore, methods to reduce accident severity are of great interest to traffic agencies and the public at large. To analysis the traffic accident factors effectively we need a complete traffic accident historical database without missing data. Road accident fatality rate depends on many factors and it is a very challenging task to investigate the dependencies between the attributes because of the many environmental and road accident factors. Any missing data in the database could obscure the discovery of important factors and lead to invalid conclusions. In order to make the traffic accident datasets useful for analysis, it should be preprocessed properly. In this paper, we present a novel method based on decision tree and imputed value sampling based on correlation measure for the imputation of missing values to improve the quality of the traffic accident data. We applied our algorithm to the publicly available large traffic accident database of United States (explore.data.gov), which is the largest open federal database in United States. We compare our algorithm with three existing imputation methods using three evaluation criteria, i.e. mean absolute error, coefficient of determination and root mean square error. Our results indicate that the proposed method performs significantly better than the three existing algorithms.
Keywords:
Data mining; Data preprocessing; Decision tree; Data imputation; Traffic accident.
1. Introduction
The high growth of the number of vehicles leads to roads with higher traffic density. The immediate effect of this situation is the dramatic increase of traffic accidents on the road, which has become a serious problem in many countries. For example, 2478 people died on Spanish roads in 2010, which means one death for every 18,551 inhabitants [1]. In United States (according to Department of Transportation, United states) nearly 30,000 people died in road accidents.
According to Australian Bureau of Statistics, the majority of transport related deaths (almost 72%) in Australia is associated with motor vehicles driven on public roads.
In recent years, there has been rapid development in sensor technologies. As a result, huge amount of traffic accident data has been collected [2]. Due to the wide availability of data and the imminent need for turning such data into useful information and knowledge, data mining has attracted a great deal of attention [3]. Using data mining technology such as classification and clustering, we can uncover patterns of traffic activities and factors that lead to accident.
To run the classification and clustering algorithms, there is a strong need for data preprocessing to ensure the data is of good quality. Data preprocessing takes almost 80% of the total data mining effort. It is also known that good results can be achieved by using data mining algorithms only if you have a good quality dataset [4].
In general data preprocessing includes imputation of missing values, smoothing out noisy data, identification of incorrect data, and correction of inconsistent data. In this paper, we propose a new decision tree-based algorithm called DSMI for imputing missing values. Our experiments show that the proposed algorithm has better imputation accuracy compared with several other existing algorithms.
The paper is organized as follows: In section 2 we present a literature review of related work. Our proposed algorithm is described in section 3. Experimental results are discussed in section 4. Finally section 5 draws the concluding remarks.
2. Related Work
Many missing value imputation approaches have been proposed recently for various applications [5-8, 10-13]. Among them, k-Decision tree based imputation (kDMI) [5],
Decision tree based imputation (DMI) [6], Expectation Maximization imputation (EMI) [7], and k-Nearest Neighbor
imputation methods.
For imputing numerical missing values, EMI algorithm relies on estimating the mean and covariance matrices of the dataset. The EMI algorithm starts with initial estimates of the mean and the covariance matrix and cycles through the steps until the imputed values and the estimates of mean and covariance matrix stop changing appreciably from current iteration to the next iteration [7]. The main drawback of this method is that for imputing the missing value it uses information from the whole dataset and therefore is suitable only for datasets that exhibits strong correlations for the attributes within the whole dataset.
kNNI method first finds user-defined k number of records from the total dataset by using the Euclidean distance measure. For imputing a numerical missing value the method utilizes the mean value of the specific attribute within the k most similar records of the entire dataset. If the missing attribute is categorical then the method utilizes the most frequent value of the attribute within the k most similar records. kNNI is a simple method that performs well on the dataset having strong local correlation structure. However, the method can be expensive for a large dataset since for each record having missing value(s) it finds k number of similar records by searching the whole dataset. Moreover, the identification of a suitable value for k can be a challenging task [8].
Rahman et al. proposed the DMI [6] technique which
uses the decision tree and EM algorithm for missing value imputation. They argued that the correlations among attributes within a horizontal partition of a dataset can be higher than the correlations over the whole dataset. This technique works as follows: it first divides the full dataset (DFull) into two sub datasets, one having records with missing values (DMiss) and others having records without missing values (DComplete). Then it builds decision trees on DComplete considering the attributes having missing values in DMiss as class attributes. After that, it assigns each record with missing value(s) in DMiss to the leaf where it falls in for the tree that considers the attribute, which has a missing value for the record, as the class attribute. Finally, it imputes numerical missing values using EM algorithm or categorical missing values using majority class values within the leaves. They showed that DMI performed well compared with other existing imputation methods. However, for imputing categorical values, simple voting is used. Another more serious problem is that the authors did not define how the imputation is done if the missing values record falls in more than one leaves, a situation that could occur if there is more than one missing values in a record.
kDMI [5] algorithm imputes missing values using two levels
partitioning. Like DMI, kDMI algorithm also employed
horizontal partitioning based on a decision tree in first level
partitioning. For second level partitioning, the authors used a BestKNN approach to first find the best value of k by searching all records of a leaf and calculated the root mean square error (RMSE) of the non-missing attribute values. Then EM algorithm is used for imputing numerical data and frequent value of BestKNN is used for imputing categorical data, respectively. However, it is not clear if all the attributes of a record are categorical then how would RMSE being calculated using BestKNN. It is also not clear if the missing values record falls in more than one leaves, how the imputation would be done. Here, we propose DSMI, a new decision tree with random sampling of imputed values imputation method to address the above problems. The justification for using decision tree-based method is that the records in a leaf are more correlated than the whole dataset and the variance between attribute values for the records within a leaf is smaller than that of the entire dataset [9].
3. Proposed Approach
We present our missing values imputation technique below.
We build the decision trees with correlated records using C4.5 algorithm. The records with missing values are assigned to the leaves and their missing values are imputed using correlation measure.
3.1. Basic Concept
We illustrate our basic algorithm design here. At first, the full dataset (DFull) is divided into two sub datasets. One subset contains records with missing values (DMiss) and other one without missing values (DComplete). A sample datasets DFull, DComplete, and DMiss are shown in TABLE 1, 2, and 3. Then, we build a set of decision trees on DComplete with the attributes having missing values in DMiss, as the class attributes. For example in DMiss three attributes (Driver status, Passenger number and Accident address) have missing values and we make three decision trees depend on these attributes shown in Figure 1, 2, and 3.
TABLE 1. FULL DATASET DFULL
Driver status Weather condition Passenger number Accident address Injury severity
R1 Drunk Good 3 Sanders Kill
R2 Drunk Good 4 ? Kill
R3 Drunk Good 2 Glendale No injury
R4 Normal Fair 3 Glendale No injury
R5 Normal Fair ? Glendale No injury
TABLE 2. COMPLETE DATASET DCOMPLETE Driver status Weather condition Passenger number Accident address Injury severity
R1 Drunk Good 3 Sanders Kill
R3 Drunk Good 2 Glendale No injury
R4 Normal Fair 3 Glendale No injury
TABLE 3. MISS DATASET DMISS
Driver status Weather condition Passenger number Accident address Injury severity
R2 Drunk Good 4 ? Kill
R5 Normal Fair ? Glendale No injury
R6 ? Good ? Glendale Kill
In Figure 1, ‘ Leaf 1 Sanders: (1) R1’ represents 1 record associated with ‘Sanders’ value and ‘R1’ record falls in ‘Leaf 1’. Here, we quantize the numerical attribute by the square root of its domain size. As passenger attribute is numerical so we have to quantize it and it is shown in TABLE 4.
Figure 1. Tree for Accident address
TABLE 4. COMPLETE DATASET FOR NUMERIC CATEGORY PASSENGER NUMBER Driver status Weather condition Passenger number Accident address Injury severity
R1 Drunk Good 3-4 Sanders Kill
R3 Drunk Good 1-2 Glendale No injury
R4 Normal Fair 3-4 Glendale No injury
Figure 2. Tree for Passenger number
Figure 3. Tree for Driver status
After that, we assign each record of DMiss to the leaf of a tree with the same attribute as the missing attribute. For example, in TABLE 3, R2 record has ‘Accident address’ attribute value missing so we assign this record to the Accident address tree’s (Figure 1) leaf. R2 and R5 records are assigned to Leaf 1 and Leaf 6 respectively which are shown in TABLE 5 and TABLE 6.
TABLE 5. ASSIGN MISS DATASET FOR ACCIDENT ADDRESS
Driver status Weather condition Passenger number Accident address Injury severity
R1 Drunk Good 3 Sanders Kill
R2 Drunk Good 4 ? Kill
TABLE 6. ASSIGN MISS DATASET FOR PASSENGER NUMBER
Driver status Weather condition Passenger number Accident address Injury severity
R4 Normal Fair 3 Glendale No injury
The records with more than one missing values would fall into multiple leaves. If any record falls in multiple leaves, we aggregate records in all these leaves into one collection. According to TABLE 3, R6 record has two missing values so it is assigned to three leaves 4, 6, and 8 (Figure 2 and 3) and shown in TABLE 7, 8, and 9. Then, we aggregate these three tables into TABLE 10.
TABLE 7. ASSIGN MISS DATASET FOR PASSENGER NUMBER AND DRIVER STATUS Driver status Weather condition Passenger number Accident address Injury severity
R1 Drunk Good 3 Sanders Kill
R6 ? Good ? Glendale Kill
TABLE 8. ASSIGN MISS DATASET FOR PASSENGER NUMBER AND DRIVER STATUS Driver status Weather condition Passenger number Accident address Injury severity
R4 Normal Fair 3 Glendale No injury
R6 ? Good ? Glendale Kill
TABLE 9. ASSIGN MISS DATASET FOR PASSENGER NUMBER AND DRIVER STATUS Driver status Weather condition Passenger number Accident address Injury severity
R3 Drunk Good 2 Glendale No injury
R6 ? Good ? Glendale Kill
TABLE 10. COMBINED TABLE 7, 8, AND 9
Driver status Weather condition Passenger number Accident address Injury severity
R1 Drunk Good 3 Sanders Kill
R4 Normal Fair 3 Glendale No injury
R3 Drunk Good 2 Glendale No injury
R6 ? Good ? Glendale Kill
We impute the missing values in each table by searching for records in the table which have the maximum number of non-missing attributes in common to the missing record. Then the attribute values corresponding to the missing values in the selected records are taken to be possible imputed values. For example, in TABLE 10, R6 record has three non-missing values but we do not get any record matching with these three non-missing values. So we search instead for two matching non-missing values and get two records with two matching attributes values: R1(Good, Kill) and R3(Good, Glendale). For the two missing attributes (Driver status, Passenger number), the possible imputed values from R1 and
R3 records are (Drunk, 3), and (Drunk, 2), respectively. If there is more than one possible imputed value, the correlation between each possible imputed value and the matched non-missing value is computed using IS measure. The IS measure between two items a and b is given by IS(a,b)
= P(a,b)/√(P(a)*P(b)), where P denotes probability value [14].
For example, in TABLE 10, the IS measure of (Drunk, 3) and (Drunk, 2) have the same value of 1. Finally, the actual imputed value is obtained by random sampling from the list of possible imputed values based on the distribution of their IS measures. For example, since both (Drunk, 3) and (Drunk, 2) have the same IS measure of 1, their distribution is both equal to 0.5, and both have equal probability of been chosen as the actual imputed values for the missing values in R6. Random sampling according to the IS measure ensures that uncertainty in attribute values are modeled for and helps to reduce bias artifact in the imputed dataset.
3.2. Proposed Algorithm
Our proposed DSMI algorithm is presented below.
Input: Full dataset with missing values
Output: Full dataset with missing values imputed
DFull: Full dataset
DComplete: Sub dataset without missing values DMiss: Sub dataset with missing values
M: Total number of attributes having missing values in DMiss
Ai: i-th attribute in dataset
Lj: j-th leaf created from the attribute Ai, which has missing value(s) in DMiss
N: Total number of non-missing records matched with a missing record in table T
Ok: possible imputed value(s) from the k-th record of T Ck: k-th record IS measure value corresponds to Ok
Step I: Decompose full dataset into complete and missing
values sub datasets DFull = DComplete + DMiss
Step II: Generate decision trees with leaves
FOR i = 1 to M
IF Ai is numeric attribute then
Quantize attribute using √|Ai| where |Ai| is the domain size of Ai
END IF
Create decision tree with leaves using C4.5 from DComplete considering Ai as class attributes which have missing values in DMiss
END FOR
Step III: Assign each record of DMiss into leaf of the missing
FOR each record of DMiss DO
Get missing attribute(s) tree(s) associated with this record Assign record into the corresponding leaf Lj
Generate table T from records in Lj END FOR
IF a record is assigned into multiple leaves THEN Aggregate all tables into one table T
Remove duplicate record(s) from this table END IF
Step IV: Impute missing values
FOR each table T DO
FOR each missing record in T DO
Find non-missing records in T that match with the maximum number of non-missing attribute(s) in the missing record, and let N be the number of such records FOR k = 1 to N
Ok = possible imputed value(s) from the k-th matched record
Ck = IS measure computed for Ok END FOR
Imputed value(s) is obtained by randomly samples from the set of possible imputed values { O1…ON } based on the distribution specified by the set of IS measures { C1…CN } END FOR
END FOR
Step V: Get full dataset with missing values imputed
4. Results and Discussion
We compare our performances with three imputation methods kDMI, DMI, and EMI. Imputation accuracy is
evaluated using three well-known performance indicators: mean absolute error (MAE), coefficient of determination (CoD), and root mean square error (RMSE). CoD is used in statistical model analysis to assess how well a model predicts future outcomes. The RMSE is a frequently used measure of the difference between values predicted by a model and the values actually observed. MAE measures the average magnitude of the errors in a set of forecasts, without considering their direction. The higher the CoD, the lower the RMSE and MAE, the better the imputation.
We do experiment on 22 text files data (Large Truck Crash Causation Study File 1). The text files have different number of attributes and 60639 records. Most of the attributes (90%) are categorical and coded with numeric values which correspond to text descriptions. The dataset contains 2193 records with missing values. Here, we first remove the records having missing values thereby create a dataset having 58446 records without any missing values.
We use four types of missing patterns [6]. In simple
pattern a record can have at most one missing value. In medium pattern, a record can have missing values for 2 – 50 % of the total number of attributes. In a complex pattern, a record can have missing values for 51 – 80 % of the total number of attributes. A blended pattern contains 25% records having missing values with simple pattern, 50% with medium pattern and 25% with complex pattern. We also use two types of missing models, namely overall and uniformly distributed (UD). In the UD missing model, each attribute has equal number of missing values. However, in the overall model, missing values are not equally distributed among attributes.
Here, we artificially create missing values in the dataset by using 4 missing patterns, namely simple, medium, complex and blended, 4 missing ratios i.e. 2%, 4%, 8% and 12%, and two missing models, namely overall and uniformly distributed (UD). We have altogether 32 missing combinations (4 missing ratios, 4 missing patterns, 2 missing models). For each combination we use 200 datasets. So, we create 6400 (32 combinations, 200 datasets for each combination) datasets.
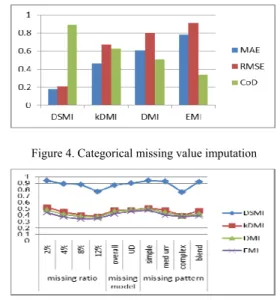
Figure 4 Shows that DSMI performed well for imputing categorical missing values compare with others algorithm. This performance is very important for preprocessing our datasets as most attributes of traffic accident dataset are categorical.
Figure 4. Categorical missing value imputation
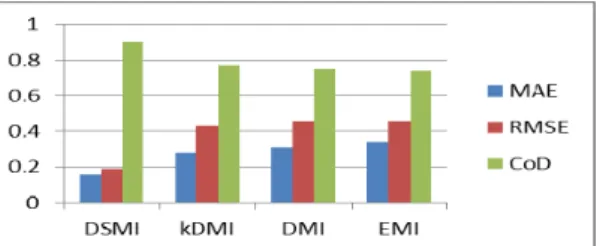
Figure 5. Average performance based on coefficient of determination (CoD) We present the aggregate performances based on CoD for missing ratio, missing model and missing patterns on the traffic accident datasets in Figure 5. The figure shows that for all cases DSMI outperforms other methods in terms of CoD. The result of missing values imputation for numerical values is presents in Figure 6. In Figure 7, we present the aggregate
performances based on RMSE for 2 missing ratios, 2 missing models and 4 missing patterns. Our algorithm achieves the best performance with all performance indicators. In practical applications, almost all historical databases are categorical. So, we need an algorithm which performs well with categorical missing values. Our results show that the proposed algorithm performed well in all cases.
Figure 6. Numerical missing value imputation
Figure 7. Average performance based on RMSE
5. Conclusion
In this paper, we proposed a new imputation method with the aim of analyzing traffic accidents data. Our algorithm combines features of decision tree and imputed value sampling based on correlation measure, and has been shown to outperform several popular imputation methods on traffic accident data, where a large number of attributes are categorical.
References
[1] M. Fogue, P. Garrido, F. J. Martinez, J.-C. Cano, and C. T. Calafte, “A novel approach for traffic accidents sanitary resource allocation based on multi-objective genetic algorithms”, Expert Systems with Applications, Vol. 40, No. 1, pp. 323-336, Jan. 2013.
[2] Z. Zamani, M. Poumand, and M. H. Saraee, “Application of data mining in traffic management: Case of city of Isfahan”, Proceeding of ICECT2010 Conference, Kuala Lumpur, pp. 102-106, May 2010.
[3] S. Shanthi, R. G. Ramani, “Feature relevance analysis and classification of road traffic accident data through data mining techniques”, Proceeding of WCECSC2012 Conference, San Francisco, October 2012.
[4] P. Miksovsky, K. Matousek, and Z. Kouba, “Data pre-processing support for data mining”, Proceeding of IEEE SMC2002 Conference, Hammmet, pp. 1-8, October 2002.
[5] M. G. Rahman, and M. Z. Islam, “k-DMI: A novel
method for missing values imputation using two levels of horizontal partitioning in a data set”, Proceeding of ADMA2013 Conference, Hangzhou, pp. 250-263, December 2013.
[6] M. G. Rahman, and M. Z. Islam, “A decision tree-based missing value imputation technique for data pre-processing”, Proceeding of AusDM2011 Conference, Ballarat, pp. 41-50, December 2011.
[7] T. Schneider, “Analysis of incomplete climate data: estimation of mean values and covariance matrices and imputation of missing values”, Journal of Climate, Vol. 14, No. 5, pp. 853-871, March 2001.
[8] G. E. A. P. A. Batista, and M. C. Monard, “An analysis of four missing data treatment methods for supervised learning”, Journal of Applied Artificial Intelligence, Vol. 17, No. 5-6, pp. 519-533, Oct. 2003.
[9] M. Z. Islam, and L. Brankovic, Privacy preserving data mining: A noise addition framework using a novel clustering technique, Knowledge-Based systems, Vol. 24, No. 8, pp. 1214-1223, Dec. 2011.
[10] H. Junninen, H. Niska, k. Tuppurainen, J. Ruuskanen, and M. Kolehmainen, “Methods for imputation of missing values in air quality data sets”, Journal of Atmospheric Environment, Vol. 38, No. 18, pp. 2895-2907, 2004.
[11] A. W. C. Liew, N. F. Law, and H. Yan, “Missing value imputation for gene expression data: computational techniques to recover missing data from available information”, Briefings in Bioinformatics, Vol. 12, No. 5, pp. 498-513, Sep. 2011.
[12] X. Gan, A. W. C. Liew, and H. Yan, “Microarray missing data imputation based on a set theoretic framework and biological consideration”, Nucleic Acids Research, Vol. 34, No. 5, pp. 1608-1619, Feb. 2006. [13] K. O. Cheng, N. F. Law, W. C. Siu, “Iterative
bicluster-based least square framework for estimation of missing values in microarray gene expression data”, Pattern Recognition, Vol. 45, No. 4, pp. 1281-1289, Apr. 2012.
[14] P. N. Tan, V. Kumar, J. Srivastava, “Selecting the right objective measure for association analysis”, Information Systems, Vol. 29, No. 4, pp. 293–313, Jun. 2004.