A R E S E A R CH R E P O R T FR O M S W E D I S H IN S TIT U TE FO R FINAN C I A L R E S E A R CH
Direct Evidence of
Dividend Tax Clienteles
MAGNUS DAHLQUIS T
GÖR AN ROBERTSSON
KRIS TIAN RYDQVIS T
Swedish Institute for Financial Research (SIFR) is a private and independent non-profit organization established at the initiative of members of the financial industry and actors from the academic arena.SIFRwas launched in January 2001 and is situated in the center of Stockholm. Professor Magnus Dahlquist serves as director of the Institute. The mission ofSIFRis to:
• Conduct and stimulate high quality research on issues in financial economics, where there are promising prospects for practical applications,
• Disseminate research results through publications, seminars, conferences, and other meetings, and
• Establish a natural channel of communication about research issues in finance be-tween the academic world and the financial sector.
The activities ofSIFRare supported by a foundation based on donations from Swedish financial institutions. Major contributions have been made by: AFA, Alecta, Alfred Berg, AMF Pension, Brummer & Partners, Carnegie, Handelsbanken, Kapitalmarknadsgrup-pen, L¨ansf ¨ors¨akringar, Nordea, Svenska Fondhandlaref ¨oreningen, and ¨Ostg ¨ota Enskilda Bank.
Sveriges Riksbank funds a position as visiting professor atSIFR.
SIFRalso gratefully acknowledges research grants received from Bankforskningsinstitutet, F ¨oreningsbankens Forskningsstiftelse, Jan Wallanders och Tom Hedelius Stiftelse, Riks-bankens Jubileumsfond, and Torsten och Ragnar S ¨oderbergs stiftelser.
Swedish Institute for Financial Research, Saltm¨atargatan 19A 11, SE-113 59 Stockholm, Sweden Phone: +46-8-728 51 20, Fax: +46-8-728 51 30, E-mail: info@sifr.org, Web: www.sifr.org
Direct Evidence of Dividend Tax Clienteles
Direct Evidence of Dividend Tax Clienteles
Magnus Dahlquist G¨oran Robertsson Kristian Rydqvist∗March 14, 2007
Abstract
We study a large data set of stock portfolios held by individuals and organizations in the Swedish stock market. The dividend yields on these portfolios are systematically related to investors’ relative tax preferences for dividends versus capital gains. Tax-neutral in-vestors earn 40 basis points higher dividend yield on their portfolios than inin-vestors that face higher effective taxation of dividends than capital gains. We conclude that there are dividend tax clienteles in the market. We also argue that the abundant portfolio holdings by private corporations, despite triple taxation at a combined marginal tax rate as high as 77.5%, is a consequence of taxation.
Keywords: Tax incidence, dividend tax clienteles, capital gains tax, stock ownership. JEL Classification Numbers: G11, G35.
∗We are grateful for institutional information from Ingrid Eriksson, Kerstin Nilsson, Viveca Scherman
Johans-son, and Per Swanstr¨om of Skatteverket, Kristina Melz´en, Marie Rosvall of F¨ors¨akringsf¨oreningen, Lina Sj¨ostr¨om, Krister Swaretz, and Stig Westman of F¨oreningssparbanken, Vigg Troedsson of Sveriges Fondhandlarf¨orening, Jan Bjuvberg, H˚akan Thorsell, and Filip Wijkstr¨om of the Stockholm School of Economics, Svante Johansson of Carnegie Investment Bank, Johnny Larsson of Statistics Sweden, Roger Pettersson of RPA F¨ors¨akringsm¨akleri, Sune Rydqvist of Configura, Ingmarie Severien of Handelsbankens forskningsstiftelser, and Bo Winnerfeldt of the Nordic Central Securities Depository. We also want to thank for comments by Michael Brennan and William Goetzman and by sem-inar participants at Binghamton University, Frontiers of Investments in Curacao 2007, Helsinki School of Economics, Ministry of Finance, New University of Lisbon, Norwegian School of Economics, Norwegian School of Management, Ohio State University, Renselaer Polytechnic Institute, Royal Institute of Technology, Swedish Institute for Financial Research, University of Maastricht, and University of Oxford. Financial support from the Bank of Sweden Tercente-nary Foundation, and Johan och Jakob S¨oderbergs stiftelse is gratefully acknowledged. Dahlquist: Swedish Institute for Financial Research, Stockholm School of Economics and CEPR; e-mail magnus.dahlquist@sifr.org . Robertsson: Swedish Institute for Financial Research; e-mail goran.robertsson@sifr.org . Rydqvist: Binghamton University and
1
Introduction
Corporations pay dividends and investors pay taxes on these dividends. Investors also pay taxes on capital gains when they sell their shares, but they can choose when to do so. Some investors are tax neutral, while other pay taxes on dividends but not on capital gains. Theory suggests that investors can reduce the overall tax bill by sorting themselves into clienteles in which low-tax investors collect the dividends and high-low-tax investors realize capital gains.1 Understanding how the differential taxation of dividends and capital gains influences investors’ stock portfolios has implications for the pricing of financial securities, for corporations issuing securities, and for governments collecting taxes.
There is a large literature that examines the tax clientele hypothesis with indirect measures. One strand of the literature examines the price and volume patterns around the ex-dividend day. Elton and Gruber (1970) argue that the patterns of ex-dividend day returns are consistent with tax clienteles in the stock market, while Kalay (1982) and Boyd and Jagannathan (1994) challenge this interpretation.2 A second strand relates stock returns and dividend yields. A return premium on high-yield stocks would induce low-tax investors to hold high-yield stocks and high-tax investors to hold low-yield stocks. Several studies run cross-sectional regressions of returns on dividend yields, but reach different conclusions (see, for example, Black and Scholes (1974), Litzenberger and Ramaswamy (1979), Miller and Scholes (1982)). A third strand of the literature examines in-stitutional ownership. Del Guercio (1996) and Grinstein and Michaely (2005) find that institutions prefer dividend-paying stocks, and Michaely, Thaler, and Womack (1995) and Dhaliwal, Erickson, and Trezevant (1999) document changes in institutional ownership around dividend initiations and omissions. These studies are often inconclusive on tax effects because the tax status of institutional investors cannot be determined.
There are also direct tests of the tax clientele hypothesis. Lewellen, Stanley, Lease, and
Schlar-1See, for example, Miller and Modigliani (1961), Brennan (1970), Litzenberger and Ramaswamy (1979), and Allen,
Bernardo, and Welch (2000).
2The core of the critique is that investors with different marginal tax rates trade around the ex-dividend day until
prices reflect transaction costs rather than tax rates. Trading would mitigate the need for forming tax clienteles, but the evidence suggests that relatively small amounts of stocks are traded, usually much less than 1% of the stock (see, for instance, Michaely and Vila (1996)).
baum (1977) and Pettit (1977) study the stock portfolios of 2,500 individual investors from a retail brokerage house. Both studies relate dividend yields to proxies for marginal tax rates, but reach opposite conclusions. Scholz (1992) looks at self-reported data by 4,000 individuals in the Survey of Consumer Finances and finds evidence consistent with dividend tax clienteles. Most recently, Graham and Kumar (2006) report that high-age, low-income individuals invest more in high-yield stocks using a data set of 60,000 individual investors. These studies suffer from two weaknesses: Data include small subsets of individuals and no organizations, which own most shares, and the marginal tax rate of individuals is difficult to estimate.
We study the tax clientele hypothesis using stock ownership data from Sweden. The data set is comprehensive; it includes more than 34,000 stock portfolios held by organizations and two million stock portfolios by individuals. The tax structure is ideal for estimating tax clientele effects: Tax rates are flat and variation across investors arises mainly from variation in the taxation of organizations. There are three tax clienteles in the Swedish stock market. First, individuals are taxed at the 30% rate and businesses at the 28% rate. These investors prefer capital gains over dividends because tax on capital gains can be postponed. Second, many organizations are tax neutral. Relative to individuals and businesses, tax-neutral investors prefer dividends. Third, the taxation of investment funds is asymmetric: Dividends pass through and are taxed by the recipient, while capital gains accrue tax free within the fund. This means that investment funds have a stronger preference for capital gains over dividends than any of the other investors. In this tax environment we provide the following main results:
• Tax-neutral investors earn higher dividend yields on their portfolios than businesses, individ-uals, and investment funds. The difference is large; tax-neutral investors earn 40 basis points higher dividend yield on their portfolios than investment funds.
• More than 28,000 stock portfolios are held by corporations despite that income on such portfolios is subject to triple taxation. We argue that the existence of these portfolios is a consequence of taxation.
is that the benefits of portfolio diversification swamp the benefits from reducing the tax bill.3 Our finding of tax clientele effects in the Swedish stock market adds to a broader tax literature, which examines the trade-off between taxes and risk-taking across asset classes (see Poterba and Samwick (2002) and references). For example, the formation of tax clienteles across stocks and bonds is central to the capital structure theory of Miller (1977).4 If there are tax clientele effects in the stock market, where the benefits of diversification ought to be the strongest, then tax clienteles are also likely to form across assets where the diversification benefits are weaker.5
The rest of the paper is organized as follows. Section 2 explains the relevant details of the Swedish tax code. The empirical results are reported in Section 3. The curious phenomenon of corporations that hold stock portfolios is analyzed in Section 4. Section 5 concludes the paper and points to directions for future research.
2
Institutional Background & Data
2.1 Data
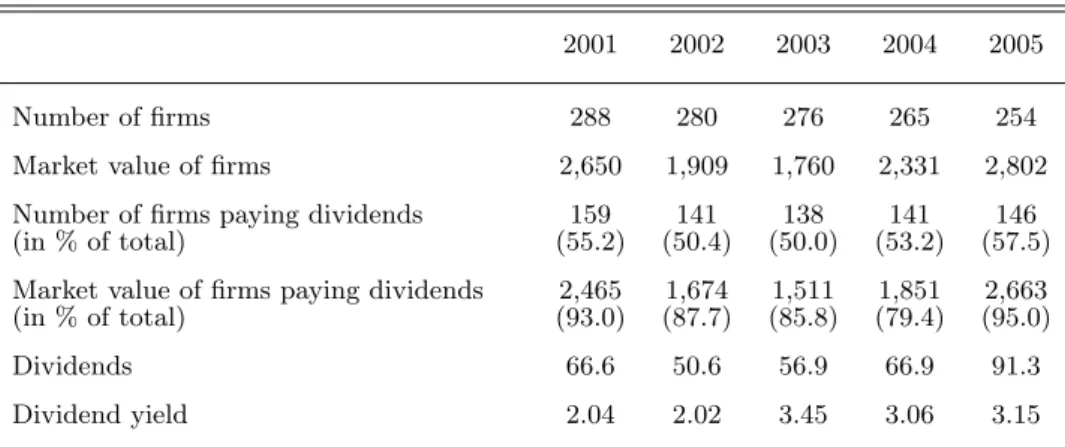
We study Swedish exchange-listed firms in the period 2001–2005. Financial data are taken from Thomson Financial and the Stockholm Stock Exchange. Descriptive statistics on the sample firms and their payout policies are displayed in Table 1. The two top rows present that the number of firms varies between 254 and 288 per year and the market capitalization between SEK 1,760 and 2,802 billion.6 The rest of the table provides statistics on dividends. Dividends are paid annually after the approval of the shareholder meeting. Approximately 50% of the listed firms pay dividends, but the market value of the dividend-paying firms is more than 80% of market capitalization. The aggregate dividends between 2001 and 2004 are approximately SEK 60 billion,
3Miller and Scholes (1978) propose the hypothesis that investors can offset dividend tax liability entirely by
borrowing to purchase the stock portfolio and deduct the dividends against the interest rate payments on the loan. Whether such tax avoidance strategies are being used depends on the investor’s tolerance towards the risk of the levered stock portfolio.
4See also Auerbach and King (1983), who extend Miller’s (1977) model of tax tradeoffs to also include risk. 5For example, the persistent spread in bond yields between regular treasury securities and tax-exempt municipal
bonds suggests that there are tax clienteles in the bond market where the benefits from diversification are smaller than in the stock market (see, for example, pages 340-345 in Sundaresan (2002)).
which implies dividend yields between 2% and 3.5%. In 2005 there is a general increase in dividends (to about SEK 90 billion), but the dividend yield is similar to earlier years (3.1%). In addition to the dividends, approximately 10% of the Swedish firms repurchase shares through open market purchases. However, they are small relative the dividends. The data are generally skewed: The market value of the ten largest firms is more than 50% of stock market capitalization; ten firms pay more than 50% of aggregate dividends; and the market share of the 50 largest investors is almost 50% of stock market capitalization. Concentration of dividends among large capitalization firms is also a feature of the US stock market (see Fama and French (2001)).
Ownership of Swedish listed stocks is organized as book entries by the Nordic Central Securities Depository (NCSD). Regulations require that exchange-listed firms use the securities depository for registration of stock ownership.7 Each investor or custodian bank must have an account in the securities depository. According to law, a complete ownership record of all domestic shareholders must be established on the last bank day of June and December each year. The law requires Swedish banks to reveal the identities of the owners of all shares held in custody, but foreign banks do not have to report the nominee identity.
We obtain ten cross-sections of stock ownership for June and December each year in 2001-2005, but will in the empirical work use annual cross-sections (the June record). Each record displays the name of the shareholder, an organization identification number, the number of shares held, and a security identification code. The formation of individual stock portfolios can be based on the organization number for organizations and the name for individuals and proprietorships for whom the identification numbers have been omitted. The foreign stock portfolios are eliminated, because we do not know the identity of the beneficial owner of shares in custody.
With the data from Thomson Financial we compute factor loadings (betas) in one and three factor regression models and idiosyncratic risks as the standard deviations of the residuals from the same regressions. The betas capture exposures to the market, high-minus-low book-to-market ratios (HML), and small-minus-big market capitalization (SMB). These measures will be used as firm characteristics and later proxy for investors’ investment opportunities. We also consider two
7Some non-listed firms and bond issuers also use the securities depository for record keeping. The bond ownership
liquidity variables, turnover rate (total trading in a stock relative its market capitalization) and spread (bid-ask spread in relation to its price), obtained from the Stockholm Stock Exchange. We further collect information on a firm’s use of dual class shares and whether individuals’ holdings in a firm’s shares are exempt from a wealth tax, or not. These data are later used to capture dimensions beyond taxes that may be important for investors’ portfolio holdings.
2.2 Taxation of Dividends & Capital Gains
Stock ownership generates dividends and capital gains. Dividends are taxed when they are paid and capital gains when the investor sells the stock to another investor in the secondary market or back to the firm in a share repurchase. This section explains how Swedish investors are taxed on dividends and capital gains. The tax rules have remained largely unchanged since 1991.
Individuals. Ordinary income and investment income are taxed as separate income classes.
Or-dinary income is subject to a progressive tax schedule. The average tax rate in the highest income bracket is 67.2%.8 Dividends and capital gains are taxed as investment income at the 30% rate. Capital loss on stocks is deductible against other income, but loss limitations apply.9 Estates are taxed as individuals and all tax obligations of the deceased individual are passed on to the estate.
Businesses. Investment income is lumped together with operating income and taxed at the 28%
rate. Capital loss is fully deductible; it can be carried forward indefinitely, but cannot be carried back. Intercorporate dividends and capital gains are tax free if the ownership fraction of the voting
8The marginal tax rate on ordinary income is
1−
1
1.3246
(1−0.566) = 0.672,
where 32.46% is the social security tax rate and 56.6% is the sum of the local tax rate (average of 31.6%) and the state tax rate (25% for income above SEK 465,200 in 2005). There is no cap on the income to which social security taxes apply.
9Capital loss on stock is fully deductible against capital gains on other stocks, but only 70% against other
invest-ment income. Negative investinvest-ment income can also offset tax liability on ordinary income. The tax reduction is 30% times the deficit up to SEK 100,000 and 21% times the deficit above SEK 100,000. This means that capital loss saves taxes at rates 30% (gains on stock), 21% (investment income, ordinary income up to the limit), and 14.7% (ordinary income above the limit).
rights exceeds 25% up to 2003 and 10% thereafter.10 Business taxation applies to corporations, associations, and foundations, but a variety of business organizations are not taxed this way. The following two business organizations are taxed on imputed income:
• Life insurance companies and pension funds: Income is defined as the average treasury rate during the year times the market value of the stock portfolio in the beginning of the year. The tax rate on imputed income is 15%.
• Banks and brokerage houses: Stocks can be held only for trading purposes. Income is defined as the sum of all sales minus the sum of all purchases plus the change in the market value of the inventory during the year (mark-to-market principle). The tax rate is 28%.
In the next group of business organizations, income passes through to the owners:
• Investment funds: Dividends are taxed as investment income by the recipients, while capital gains accrue tax free within the fund. Fund owners pay capital gains tax when they sell shares in the fund. These tax rules mean that short-term trading profits for the fund are transformed into long-term trading profits for the investor. This tax benefit comes at the expense of a tax on the net asset value of the stock portfolio similar to the taxation of life insurance companies and pension funds.
• Partnerships: Income from a stock portfolio is taxed as ordinary income by the partners. The transformation of investment income into ordinary income discourages individuals from owning stock through a partnership as the marginal tax rate on ordinary income (67.2%) is much higher than that on investment income (30%). For a business partner the transformation makes no difference as the tax rate is 28% in either case.
• Sole proprietorships: Income from a stock portfolio is taxed by the proprietor as investment income (30% rate). Stock clubs are taxed this way.
10Morck (2005) documents similar tax rules in most developed countries except the US where inter-corporate
Government Entities, Charities, and Non-Profits. Government entities are exempt from
taxation. Charitable organizations are exempt from taxation of investment income. Other non-profit organizations are taxed as businesses (see above).
2.3 Tax Preferences
Let τd and τg be the marginal tax rates on dividends and capital gains, respectively. We compute
the relative tax preference for dividends over capital gains for all investors and identify three tax clienteles, sorted from high to low:
θ= 1−τd 1−τg = ⎧ ⎪ ⎪ ⎪ ⎪ ⎪ ⎨ ⎪ ⎪ ⎪ ⎪ ⎪ ⎩ 1.00 A. Tax-neutral organizations 0.85 B. Businesses and individuals 0.70 C. Investment funds
(1)
Tax-neutral organizations (A) exhibit the strongest relative preference for dividends. Life in-surance companies, pension funds, and banks and brokers are tax neutral between dividends and capital gains, because they are taxed on imputed income. Government entities and charities are tax neutral, because they are tax-exempt.
Businesses and individuals (B) prefer capital gains to dividends, because capital gains tax can be postponed. Bailey (1969) estimates the value of deferral to 50% of the statutory rate, Protopapadakis (1983) finds estimates in the order of 25%, and Chay, Choi, and Pontiff (2006) find it to be 55%.11 Green and Hollifield (2003) model the advantage of deferral and find numerically that the effective tax rate on capital gains amounts to approximately 60% of the statutory rate. In equation (1) and what follows, we ignore the small difference in marginal tax rates between businesses and individuals and assume it is 30%, and we apply the numerical result of Green and Hollifield (2003), so that τg = 0.60×30% = 18%.
Investment funds (C) prefer capital gains, because dividends pass through and trigger immediate taxation for the recipient while capital gains accrue tax free within the fund. The dividend tax is
11Much of the US literature assumes that the effective capital gains tax rate is 25% of the statutory rate (e.g.,
Graham (2003)). This is based on Bailey (1969), who multiplies the estimated value of deferral 50% with the estimated value of the option to reset the cost basis to market value at death, which is also 50%. We do not follow this approach because the Swedish tax code does not allow the estate to reset the cost basis to market value (see above).
paid by the investment fund on behalf of the recipient. In equation (1), we assume that individuals own the investment funds. Mutual funds also manage tax-deferred accounts under the Premium Pension Authority (PPM). We ignore this ambiguity about the tax status of investment fund owners, because the new pension system that started in 2000 is relatively small. A few large closed-end funds are traded in the stock market and included in our sample. The shares are owned by both individuals and organizations and, presumably, the tax preference parameter is a weighted average of 0.700 (individuals), 0.720 (businesses) and 1.000 (tax neutral). This complication, which applies to only a few observations, is also ignored.
We exclude partnerships from equation (1), because the tax preference depends on the iden-tities of the partners: 0.657 (individuals), 0.865, (businesses), and 1.000 (tax neutral). Without information on the ownership structure, we think that the inclusion of partnerships only adds noise. The calculations in (1) assume that investors have taxable income. If investors can offset divi-dends and capital gains against capital losses, the relative tax preferences change somewhat. Loss deductions are irrelevant for tax-neutral organizations and investment funds. Businesses become tax neutral, while individuals still prefer capital gains as a result of loss limitations (see footnote 9). We assume that investors make long-term investments and ignore the possibility that businesses and individuals may want to re-balance their portfolios when they have capital losses.
2.4 Identification of Investor Tax Preferences
Statistics Sweden classifies organizations by a two-digit code for organizational form, which we use to sort investors into tax clienteles. The organization code was originally created to facilitate the exchange of information in the public sector. The tax administration uses the code to distribute the appropriate tax form to each organization. Table 2 presents the organization type, the tax form number, and our inference on the organization’s tax status. There are 21 different organizations including individuals in the table. The tax status is unambiguous for the 12 organizations in the top of the table. Additional information is required to classify the tax status of the next five organizations. The last four organizations in the bottom of the table are not studied.
in-surance (A), property and casualty inin-surance (B), pension funds (A), and closed-end funds (C). Brokerage houses (A) are identified by the register of the Swedish Association of Stock Brokers, and controlling shares (A) by the 10% and 25% ownership cutoffs. Non-profit organizations must file a tax return each year. The local tax officer decides whether the organization is charitable and qualifies for exempt investment income (A) or the organization is subject to business tax-ation (B). We classify non-profit organiztax-ations with charitable-related names as tax exempt (A) and non-profit organizations with names related to a specific group of people as businesses (B). Foundations are harder to classify than associations as they are typically named after the donor. A few scientific foundations (A) are well-known to the authors. Foundations with a relationship to a business are classified as taxed (B). The name method classifies 88% of the associations and 29% of the foundations. Non-classified non-profit organizations are not considered.
2.5 Portfolio Characteristics
Table 3 reports averages of portfolio characteristics for major investor types sorted by tax prefer-ences and, within each panel, by average portfolio size. In addition to the organizations in Table 2 above, we have classified corporations as public if the firm itself or the parent of the business group to which the firm belongs is registered in the securities depository, or as private if the firm or the parent is outside the securities depository. The intercorporate ownership structure is taken from the database Market Manager. The table is based on more than two million stock portfolios with a combined market share of 64%. The missing shares are held by foreign investors (33.9%), as-sociations and foundations with unknown tax status, domestic organizations with unknown type, and partnerships. The small number of partnerships, 943, and their insignificant market share, less than 0.05%, is consistent with tax incentives which discourage individuals from holding stocks through partnership.
The variation in average portfolio size across investor types is noticeable. Life insurance com-panies hold the largest and most diversified portfolios. Closed-end funds are also very large, but they hold on average only 10 stocks. Mutual funds, non-life insurance companies, the public sector, and banks hold medium size portfolios with approximately 20 stocks. Pension funds, charities, and
non-profits hold smaller and less diversified portfolios. We only consider investors’ direct invest-ments in domestic stocks and do not have information on the number of foreign stocks they hold. Adding the foreign stocks would most likely increase the number of stocks held by mutual funds and pension funds. We also do not observe other financial or real assets in investors’ portfolios.
The smallest and least diversified portfolios are held by private firms and individuals. The small number of directly owned stocks in individuals’ portfolios is also a striking feature of the Survey of Consumer Finances (see Polkovnichenko (2005)). Calvet, Campbell, and Sodini (2006) show that Swedish individuals diversify through ownership of mutual funds. Swedish individual investors also hold a real claim on the social security system, which is extensive and well-diversified. Individual investors dominate our sample with more than two million stock portfolios of which approximately one million consist of only one stock with a tiny market value below SEK 15,000. More than 600,000 such one-stock portfolios are invested in one of three stocks (Ericsson, Telia-Sonera, and F¨oreningssparbanken). The small aggregate market share of individuals in the amount of 14.5% is in line with 7.2%, 8.9%, and 16.5% reported for Finland, Norway, and the UK, respectively.12 Aggregate ownership by individuals in the US stock market is not available to us.
There is a manifested variation in the portfolio strategies across investor types. Large portfolios held by institutional investors are tilted towards value stocks (small negative HML coefficients) with high dividend yield. Small portfolios held by private corporations show the opposite traits. They are tilted towards growth stocks (large negative HML coefficients) with low dividend yield. Estates and stock clubs also follow this investment strategy. We report the frequency distribution of the HML betas, the number of stocks, and the portfolio values in Figures 1–3. The distributions are shown for each tax clientele, where clientele B is further divided into B1 (Businesses) and B2 (Individuals). There is a striking tendency for businesses to hold growth stocks with very low HML betas. The dominance of few stocks in portfolios held by businesses and individuals is also apparent, as is the higher portfolio values for investment funds.
12See Karhunen and Keloharju (2001) for Finland, Dai and Rydqvist (2006) for Norway, and Bell and Jenkinson
3
Empirical Results
We evaluate the tax effects in the cross-section of stock portfolios. The data are less suitable for time-series analysis, so we do not report any results relating to clientele shifts around dividend initiations and omissions or new stock listings and delistings. Also, we do not investigate shareholder preferences for share repurchasing stocks over no payout stocks as both are subject to capital gains taxation.
3.1 Aggregate Stock Portfolios
The starting point of our analysis is the Capital Asset Pricing Model extended with taxes by Brennan (1970), Litzenberger and Ramaswamy (1979), and Allen, Bernardo, and Welch (2000). In these models, if investors are sufficiently risk averse, the tax effects become negligible and investors hold the market portfolio. This also means that an investor have the same ownership fraction in each firm in the market. This is our null hypothesis, which we evaluate against the alternative that tax-neutral investors (A) tilt their portfolios towards dividend-paying stocks, that investment funds (C) tilt their portfolios away from dividend-paying stocks, and that businesses and individuals (B) fall somewhere between the two extremes.
To test these hypotheses, we construct the aggregate stock portfolios of all investors that belong to tax clientelek=A, B, C. Table 4 presents summary statistics of variables averaged over the years in the sample. The evidence is mixed. Consistent with the tax clientele hypothesis, the dividend yield on the tax neutral portfolio (A) is higher than the dividend yield on the portfolio of business and individuals (B) which, in turn, is higher than the dividend yield on the portfolio of investment funds (C). The yield spread between tax-neutral portfolios (A) and investment funds (C) is 40 basis points. Also consistent with the tax clientele hypothesis, the stock portfolio of tax-neutral investors (A) has the largest weight in dividend-paying stocks. However, inconsistent with the dividend tax clientele hypothesis, the portfolio weight of businesses and individuals (B) falls below that of investment funds (C). We use regression analysis to demonstrate that these patterns are robust to the inclusion of control variables.
3.2 Individual Stock Portfolios
Theory determines the portfolio weight as a function of the stock’s risk characteristics, dividend yield, and the investors’ tax preferences. However, the individual stock portfolio data described above are significantly different from the predictions of the Capital Asset Pricing Model. Regressing individual ownership fractions on a set of explanatory variables is also statistically difficult. For example, the many single-stock portfolios would appear with the portfolio weight of 100% in one stock and 0% in all other stocks. We offer two solutions. In this section, we follow the approach of Pettit (1977), Scholz (1992), and Graham and Kumar (2006) and define the portfolio dividend yield as the dependent variable. The idea is that preferences, beliefs, and budget constraints determine the optimal portfolios, which are associated with a dividend yield. In the subsequent section, we calculate aggregate ownership fractions of the tax clienteles A, B, and C and relate those to the dividend payout of firms.
For each investor i in year t, we compute the dividend yield Yit and estimate a pooled linear
regression model of the dividend yield on dummy variables Ditk for each tax clientele and a set of control variables Xit:
Yit=β0t+γBDitB+γCDitC+βXit+εit. (2)
The tax clientele hypothesis implies that:
0> γB > γC. (3)
We also estimate a regression where we replace the tax clientele dummies with the tax preference parameter θit for each investor iin yeart:
Yit=β0t+γθit+βXit+εit. (4)
For this specification, the tax clientele hypothesis predicts thatγ >0.
The characteristics of individuals’ stock portfolios are markedly different from those of organi-zations (see Table 3 above). Adding more than two million stock portfolios to an equally-weighted
regression means that the coefficients of the control variables, but not the tax variables, are deter-mined by the characteristics of the average individual’s stock portfolio. We therefore report the results from estimating regression models (2) and (4) without the stock portfolios of individuals. Below we comment on the regression results when individuals’ portfolios are included.
The main regression results are reported in Table 5. Standard errors are reported below the coefficients. The standard errors reported throughout the paper are based on a pair-wise bootstrap (500 replications) accounting for conditional heteroskedasticity and serial correlation. Asymptotic standard errors from a GMM estimation, also accounting for conditional heteroskedasticity and serial correlation, are very similar to the bootstrap standard errors and are therefore not reported in the tables. Specifications 1a, 2a, and 3a refer to regression equation (2) and specifications 4a and 5a refer to equation (4). The tax clientele dummies enter with negative signs and the tax preference parameter with a positive sign. The coefficients are statistically different from zero. The coefficients in specifications 2a–5a are consistent with the dividend tax clientele hypothesis but, in specification 1a, the coefficients of businesses (B) are more negative than the coefficient of investment funds (C). The magnitudes are economically meaningful. The yield spread between A and C is between 30 and 60 basis points. Consistent with Pettit (1977), dividend yield decreases with market beta and, as in Graham and Kumar (2006), dividend yield increases with HML beta and decreases with idiosyncratic risk.
The bottom of Table 5 shows that 29.9% of the portfolios are clustered at a zero dividend yield, which means that the coefficients in a linear model may predict negative dividend yields. We examine the sensitivity to the clustering at zero by trimming the sample (Table 6) and by estimating a Tobit model (Table 7). Since zero-yield portfolios are most common among investors with only a few stocks, we expect the problem to be most critical for the estimation of the coefficients of businesses (B).
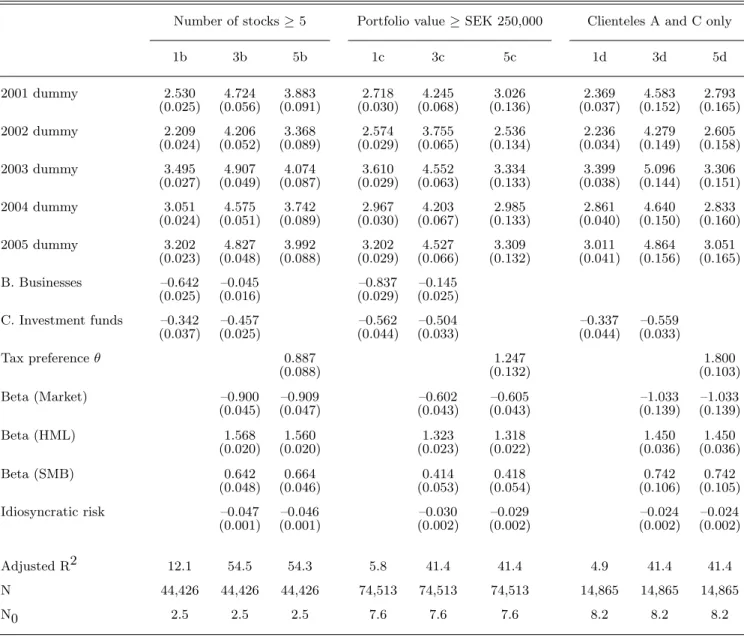
The left panel in Table 6 excludes portfolios with less than five stocks, the middle panel portfolios with a market value below SEK 250,000, and the right panel portfolios of businesses (B). The number of observations and the percentages of zeros decrease dramatically. In all three panels the signs of the coefficients are the same as in the full sample. The magnitude of the coefficients for
investment funds (C) is about the same, while the coefficients for businesses (B) are smaller. Table 7 presents results from a Tobit estimation. The top panel reports the estimated coefficients with standard errors. The results are similar to those using trimmed samples. The bottom panel evaluates the differences in expected yield spreads due to differences in relative tax preferences at the averages of the control variables for tax-neutral investors.13 The resulting yield spreads are similar to those reported in Table 6. In sum, the portfolios held by tax-neutral investors present a robust significant difference in dividend yields relative investment funds, whereas the differences relative portfolios held by businesses are sensitive to the empirical specification.
Many variables can influence investors’ portfolio choices. Above, we attempt to control for investors’ trade-off between risk and return. We have also examined two measures of liquidity, turnover rate and bid-ask spread, but they do not change the results significantly. We have left out variables which may influence the stock portfolios of individuals only. For example, employees may own stock in their own company as a part of an incentive package, founding family members own stock in their own company by inheritance and for control purposes, and individuals may prefer stocks that are exempt from wealth tax. When we include individuals’ portfolios, allowing for different coefficients on the control variables for individuals, we find very similar results as before. The tax coefficient on individuals is significantly negative, but the economic magnitude varies across different regression specifications. This indicates the difficulty in capturing the portfolios of individual investors.
Statutes sometimes restrict charities to make distributions from dividends only and not from realized capital gains or principal.14 This variable cannot be constructed without the statutes of the non-profit organizations. However, the regression results without the foundations are similar.
13Computing differences in expected yield spreads at the grand average or at averages of other investor clienteles
give similar results.
14An official at the local authority which supervises foundations (Tillsynsmyndigheten f¨or stiftelser i Stockholms
l¨an) estimated that 30% of the foundations can only distribute dividends, especially older foundations, 20% can distribute dividends and realized capital gains, and 50% have no explicit restriction and can therefore make payments from its principal.
3.3 Firm-Level Ownership
For each tax clientele k, we compute the aggregate ownership fraction Fk
jt in firm j in year t, and
estimate a pooled linear regression model of the ownership fraction on a dividend dummy variable
Djt, which equals one if the firm pays dividends and zero otherwise, and a set of firm-specific control
variables Xjt:
Fk
jt =β0kt+δkDjt+βkXjt+εkjt, k=A, B, C. (5)
Theδkparameter captures, conditional on the firm characteristicsX
jt, the over- or under-weighting
in dividend-paying stocks of clientele k. Under the null hypothesis that the aggregate investors hold equal market shares across firms, the coefficients of the dividend dummy are all zero. The tax clientele hypothesis predicts that the coefficients can be sorted according to tax preferences:
δA> δB > δC. (6)
The regression is equally-weighted which is correct under the null hypothesis that the ownership fractions are equal across firms.
The regression results are reported in Table 8. The coefficient of the dividend dummy is positive for tax-neutral investors (A) and investment funds (C). These portfolios are tilted towards dividend-paying stocks by approximately seven and five percentage points, respectively. For businesses and individuals (B) the coefficients are negative and suggest that these investors tilt their portfolios away from dividend-paying stocks by about ten percentage points. Consistent with the tax clientele hypothesis (6), tax-neutral investors display a stronger preference for dividend paying stocks than any of the other tax clienteles. The differences between tax neutral investors (A) and any of the other tax clienteles are statistically significant at usual significance levels (not reported in the table). However, inconsistent with the tax clientele hypothesis (6), the coefficients for investment funds (C) are larger than those of businesses and individuals (B).
Missing control variables may explain the mixed evidence for the tax clientele hypothesis. In-vestment funds may be bound to a diversification strategy which forces them to stay close to the market portfolio. Swedish index funds have no choice but to hold the market portfolio and, by
con-struction, the largest investment funds cannot deviate much from the market portfolio. The five largest investment funds hold together more than 10% of stock market capitalization. Businesses and individuals are small and have no commitment to diversify across stocks.
4
Corporate Stock Portfolios
More than 28,000 portfolios are held by private corporations (see Table 3). The average dividend yield on these portfolios is low (1.45%), average portfolio size is small (SEK 2.1 million), and the portfolios are tilted toward growth stocks as suggested by the low average HML betas (–1.03). Why do corporations buy growth stocks? We propose a tax-based explanation.
Special tax rules pertain to income from a private corporation, where the owner (or his relatives) is also employed. The purpose of these rules is to tax labor income the same way regardless of whether it is earned directly as wages or channeled through a partnership or a corporation. The top marginal tax rate on dividends from a private corporation is 68.7% compared to the top marginal tax rate on wages and partnership income 67.2%.15 Together with the corporate tax of 28%, it implies that a dividend on a stock portfolio that passes through to its final owner is subject to triple taxation at a marginal tax rate of 77.5%. The taxation of capital gains from selling shares in the private firm is more favorable. A capital gain that exceeds approximately SEK eight million is taxed as investment income at the 30% rate.16 A private firm cannot repurchase shares.
Corporations may hold a liquid stock portfolio for future investments in operating assets. Cor-porations may also hold stocks to offset pension liabilities for the employees. However, we conjecture that many corporate stock portfolios in our data serve as supplemental retirement accounts for the owners. A portfolio of non-dividend paying stocks does not trigger any taxes before the owner sells the private firm. Saving for retirement through a stock portfolio held by the firm has the
advan-15The rules are complex and change frequently. A small dividend can be paid tax free. An additional amount, which
depends on paid-in-capital and total wages paid to employees other than the owner, is subject to 30% investment income tax. The excess dividend is taxed as wage income at marginal tax rate 56.6%, but is not subject to social security tax. Therefore, the marginal tax rate on corporate income is
(1−0.28)(1−0.566) = 0.687.
tage that the portfolio can be liquidated at any time and used for other purposes than retirement. This benefit must be weighted against the advantage of private pension and deferred compensation plans, which are protected by the limited liability of the corporation.17 Accounting data support the retirement hypothesis. Using data from Market Manager, we compute the ratio of the market value of the stock portfolio to the book value of total assets for financial and non-financial firms, respectively. Most financial firms are securities trading companies, while the non-financial firms span manufacturing, construction, trade, and service. Table 9 presents the distribution of the ratio. Since we are mixing market and book values, the ratio sometimes exceeds 100%. A number of firms have a significant part of their assets in stock portfolios. In more than 3,000 non-financial firms (or 13% of the firms), the ratio exceeds 50%. These firms are better characterized as private stock funds than operating firms. Importantly, when we divide the non-financial firms into firms with assets below and above SEK 2 million, the result is not driven by the smaller firms in the sample. Also, the distributions are very similar across industries (manufacturing, construction, trade, and service). Note that investment-fund tax status does not apply to private firms.
5
Conclusions
We conclude that there are dividend tax clienteles in the Swedish stock market. The main support-ing evidence is the dividend yield spread between tax neutral stock portfolios (A) and investment funds (C). Theoretically, this is where we expect to find the strongest tax effect and the estimated yield spread in the order of 40 basis points is economically meaningful. The ambiguous ordering of business portfolios (B) is also interesting. In some econometric specifications, the average busi-ness portfolio sorts nicely between the average tax-neutral portfolio and the investment fund, but in other specifications, the business portfolios exhibit stronger dividend aversion than investment funds. Empirically, we cannot tell whether businesses choose growth stocks with low dividend yield, because the owners of those businesses like growth stocks or because the business owners want to
17Social security is the basis for retirement in Sweden. Payments to private pension plans and deferred compensation
plans are made after social security taxes, but before ordinary income tax. The maximum before-tax amount is SEK 39,300 per year for private pension plans and SEK 394,000 for deferred compensation plans. Accordingly, the stock portfolio has the additional advantages that there is no upper limit and social security taxes must not be paid.
avoid taxes. The abundance of portfolios of private corporations that invest in low-yield, growth stocks suggests that the owners of many business portfolios want to avoid taxes.
We have studied the portfolio implications of the asymmetric taxation of dividends and capital gains in Sweden. While some features of the Swedish tax code are specific, we believe that the two main tax asymmetries are common. First, businesses and individuals (B) prefer capital gains over dividends as a result of the realization principle. The alternative, the accrual principle that applies to banks and brokerage houses, is less common. Second, Swedish investment funds (C) prefer tax-free capital gains over taxed dividends. We believe this is a common tax treatment of many foreign stock portfolios, which are subject to withholding tax on dividends but pay no other taxes. For example, a US pension fund that purchases Swedish stocks is subject to 15% withholding tax on dividends but 0% tax on capital gains. The presence of such investors may contribute to explaining why foreign investors underweight in dividend-paying stocks and in the aggregate has the lowest dividend yield (see Table 4). However, the effect of dividends on foreigners’ portfolio composition is a topic for future research.
References
Allen, Franklin, Antonio Bernardo, and Ivo Welch, 2000, A Theory of Dividends Based on Tax Clienteles,Journal of Finance 55, 2499–2536.
Auerbach, Alan J., and Mervyn A. King, 1983, Taxation, Portfolio Choice, and Debt-Equity Ratios: A General Equilbrium Model,Quarterly Journal of Economics 98, 587–610.
Bailey, Martin J., 1969, Capital Gains and Income Taxation, in Arnold C. Harberger and Martin J. Bailey, eds.: The Taxation of Income from Capital (The Brookings Institution, Washington D.C.).
Bell, Leonie, and Tim Jenkinson, 2002, New Evidence on the Impact of Dividend Taxation and on the Identity of the Marginal Investor,Journal of Finance 57, 1321–1346.
Black, Fisher, and Myron Scholes, 1974, The Effects of Dividend Yield and Dividend Policy on Common Stock Prices and Returns,Journal of Financial Economics 1, 1–22.
Boyd, John, and Ravi Jagannathan, 1994, Ex-Dividend Price Behavior of Common Stocks: Fitting Some Pieces to the Puzzle,Review of Financial Studies 7, 711–741.
Brennan, Michael J., 1970, Taxes, Market Valuation and Corporate Financial Policy,National Tax Journal 23, 417–427.
Calvet, Laurent E., John Y. Campbell, and Paolo Sodini, 2006, Down or Out: Assessing the Welfare Costs of Household Investment Mistakes, Working Paper, SSRN.
Chay, J.B., Dosoung Choi, and Jeffrey Pontiff, 2006, Market Valuation of Tax-Timing Options: Evidence from Capital Gains Distributions,Journal of Finance 61, 837–866.
Dai, Qinglei, and Kristian Rydqvist, 2006, Investigation of the Costly-Arbitrage Model of Price Formation Around the Ex-Dividend Day, Working Paper, SSRN.
Del Guercio, Diane, 1996, The Distorting Effect of the Prudent-Man Laws on Institutional Equity Investments,Journal of Financial Economics 40, 31–62.
Dhaliwal, Dan S., Merle Erickson, and Robert Trezevant, 1999, A Test of the Theory of Tax Clienteles for Dividend Policies,National Tax Journal 52, 179–194.
Elton, Edwin J., and Martin J. Gruber, 1970, Marginal Stockholders Tax Rates and the Clientele Effect,Review of Economics and Statistics 52, 68–74.
Fama, Eugene F., and Kenneth R. French, 2001, Disappearing Dividends: Changing Firm Charac-teristics or Lower Propensity to Pay?,Journal of Financial Economics 60, 3–43.
Graham, John R., 2003, Taxes and Corporate Finance: A Review,Review of Financial Studies 16, 1075–1130.
Graham, John R., and Alok Kumar, 2006, Do Dividend Clienteles Exist? Dividend Preferences of Retail Investors,Journal of Finance 61, 1305–1336.
Green, Richard C., and Burton Hollifield, 2003, The Personal-Tax Advantages of Equity, Journal of Financial Economics 67, 175–216.
Grinstein, Yaniv, and Roni Michaely, 2005, Institutional Holdings and Payout Policy, Journal of Finance 60, 1389–1426.
Kalay, Avner, 1982, The Ex-dividend Day Behavior of Stock Prices: A Re-examination of the Clientele Effect,Journal of Finance 37, 1059–1070.
Karhunen, Jussi, and Matti Keloharju, 2001, Shareownership in Finland 2000, Finnish Journal of Business Economics 50, 188–226.
Lewellen, Wilbur G., Kenneth L. Stanley, Ronald C. Lease, and Gary G. Schlarbaum, 1977, Some Direct Evidence on the Dividend Clientele Phenomenon,Journal of Finance 33, 1385–1399. Litzenberger, Robert H., and Krishna Ramaswamy, 1979, The Effects of Personal Taxes and
Divi-dends on Capital Asset Prices: Theory and Empirical Evidence,Journal of Financial Economics 7, 163–195.
Michaely, Roni, Richard H. Thaler, and Kent L. Womack, 1995, Price Reactions to Dividend Initiations and Omissions: Overreaction or Drift?,Journal of Finance 50, 573–608.
Michaely, Roni, and Jean-Luc Vila, 1996, Trading Volume with Private Valuation: Evidence from the Ex-Dividend Day,Review of Financial Studies 9, 471–509.
Miller, Merton H., 1977, Debt and Taxes,Journal of Finance 32, 261–275.
Miller, Merton H., and Franco Modigliani, 1961, Dividend Policy, Growth and the Valuation of Shares,Journal of Business 4, 411–433.
Miller, Merton H., and Myron Scholes, 1978, Dividends and Taxes,Journal of Financial Economics 6, 333–364.
Miller, Merton H., and Myron Scholes, 1982, Dividends and Taxes: Empirical Evidence, Journal of Political Economy 90, 1118–1141.
Morck, Randall, 2005, How to Eliminate Pyramidal Business Groups–The Double Taxation of Inter-Corporate Dividends and Other Incisive Uses of Tax Policy, in James M. Poterba, ed.: National Bureau of Economic Research Tax Policy Annual(University of Chicago Press, Chicago). Pettit, R. Richardson, 1977, Taxes, Transaction Costs and the Clientele Effect of Dividends,Journal
of Financial Economics 5, 419–436.
Polkovnichenko, Valery, 2005, Household Portfolio Diversifcation: A Case for Rank-Dependent Preferences,Review of Financial Studies 18, 1467–1502.
Poterba, James M., and Andrew A. Samwick, 2002, Taxation and Household Portfolio Composition: US Evidence from the 1980s and the 1990s,Journal of Public Economics 87, 5–38.
Protopapadakis, Aris, 1983, Some Indirect Evidence on Effective Capital Gains Tax Rates,Journal of Business 56, 127–138.
Scholz, John Karl, 1992, A Direct Examination of the Dividend Clientele Hypothesis, Journal of Public Economics 49, 261–285.
Sundaresan, Suresh M., 2002, Fixed Income Markets and their Derivatives, 2nd edition. (South-Western College Publishing).
Table 1: Firms and Dividend Payout
2001 2002 2003 2004 2005
Number of firms 288 280 276 265 254 Market value of firms 2,650 1,909 1,760 2,331 2,802 Number of firms paying dividends 159 141 138 141 146 (in % of total) (55.2) (50.4) (50.0) (53.2) (57.5) Market value of firms paying dividends 2,465 1,674 1,511 1,851 2,663 (in % of total) (93.0) (87.7) (85.8) (79.4) (95.0) Dividends 66.6 50.6 56.9 66.9 91.3 Dividend yield 2.04 2.02 3.45 3.06 3.15
The table presents summary statistics for the firms in the sample over the period 2001–2005. All values are reported in SEK billion. Dividend yields are reported in %.
Table 2: Organization and Tax Status
Organization Tax form Tax status Classification method
Bank corporations 2 A Mutual savings banks 2 A
Public sector 3 A
Religious associations 3 A For-profit associations 2 B Condominium associations 2 B Common interest property 2 B Family foundations 3 B Individuals & sole proprietorships 1 B
Estates 1 B
Multi-person proprietorships None B Investment funds 2 C
Insurance corporations 2 A,B Life (A), non-life (B) Mutual insurance companies 2 A,B Life (A), non-life (B)
Other corporations 2 A,B,C Control/trader (A), fund (C), other (B) Other non-profit associations 3 A,B Pension (A), name-based (A or B) Other foundations & funds 3 A,B Pension (A), name-based (A or B)
Partnerships 4 n/a
Foreign institutions 2 n/a Other organizations 3 n/a Under investigation 2/3 n/a
The table presents the official tax form number and our inference on the tax status of organizations and individuals. The official tax forms are for individuals (1), businesses (2), charities and non-profits (3), and partnerships (4). The tax status is based on equation (1): Tax neutral (A), businesses and individuals (B), and investment funds (C). Life insurance is separated from non-life insurance by the organizations name. Controlling shares are identified by the cutoffs 10% and 25% of the voting rights. Brokerage houses and closed-end funds are separated from other corporations by the organizations name. The tax status of non-profit organizations is based on the organizations name: Tax neutral (A) if the organization name contains words associated with pension fund, children, animal protection, nature, religion, scientific, education, defense, museum, sports, arts, music, culture, political party, and health care; Business taxation (B) if the organization name contains words associated with business activity, labor union, stock club, employee profit plan, and social club, or the association is named after a person or family.
T a ble 3 : Summary Statistics of Individual In v e stors Av erage Dividend yield W e igh t in dividends Beta (mark e t) Beta (HML) Beta (SMB) Idiosync- ratic risk Num b er of sto cks Va lu e Num b er of in v e stors Mark et share A. T a x n eutral Life insurance 2 .84 88.8 1 .05 –0.20 0.14 8.9 4 8.2 8 ,546.5 1 9 7 .2 Con trol 3 .15 67.0 0 .82 –0.09 0.19 32.1 1 .2 1,508.9 8 1 5 .1 Public sector 3.05 89.7 1 .05 –0.14 0.10 10.6 1 9.2 1 ,408.2 150 9.2 Banks & brok e rs 3.69 92.7 0 .97 0 .20 –0.16 13.4 1 5.7 408.7 115 2.0 P e nsion funds 2.24 74.0 1 .14 –0.65 0.23 18.0 7 .7 56.8 765 1.9 Ch urc h & ch arit y 2 .93 84.9 1 .10 –0.30 0.14 14.5 8 .3 34.8 1 ,478 2.2 B. Businesses & individuals Non-life insurance 3 .06 86.6 1 .04 –0.19 0.08 12.3 1 5.0 239.4 121 1.3 Public firms 2 .12 63.3 1 .05 –0.53 0.31 20.7 2 .3 229.4 128 1.3 Asso ciations & 2 .92 85.1 1 .09 –0.28 0.13 14.9 7 .3 30.8 1 ,216 1.7 foundations Priv ate firms 1 .45 55.1 1 .15 –1.03 0.31 27.5 3 .7 2.1 28,511 2.7 Estates & sto ck clubs 1.48 52.4 1 .14 –1.02 0.31 29.6 2 .6 0.6 1 ,193 0.0 Individuals 2.45 79.3 0 .96 –0.44 0.14 21.5 2 .8 0.2 2 ,048,348 14.5 C. In v e stmen t funds Closed-end funds 2.35 76.1 1 .06 –0.08 0.23 20.0 1 0.2 6 ,323.0 1 7 4 .6 Mutual funds 2.44 82.4 1 .09 –0.31 0.17 11.2 2 4.7 696.9 348 10.6 The table presen ts the ch aracteristics o f p ortfolios h eld b y in v estors in differen t tax c lien teles. The a v e rages a re equally w eigh ted o v e r a ll in v e st ors a nd all y ears. P o rtfolio v alues a re expressed in SEK m illion. T he b e tas a re the factor loadings in a three factor regression m o d el (mark e t; high-min us-lo w b o ok-to-mark et ratio, HML, or v a lue-min u s-gro w th; small-min us-big mark et capitalization, SMB) a nd idiosyncratic risk is the (ann ualized) standard deviation o f the res iduals from the same regression rep o rted in %. Dividend yields, p ortfolio w e igh ts in d ividend-pa ying sto ck, and m ark e t shares a re rep o rted in %.
Table 4: Summary Statistics of Aggregate Investors
Dividend
yield Weight individends Marketvalue Marketshare Number ofinvestors
A. Tax neutral 3.07 93.1 630.0 27.6 2,608 B. Businesses & individuals 2.72 86.0 488.7 21.4 2,079,517 C. Investment funds 2.67 88.3 346.4 15.1 365
A–C 2.86 89.6 1,465.1 64.0 2,082,490
X. Foreign investors 2.50 85.4 775.6 33.9 123,468 X. Unclassified 3.37 90.5 49.8 2.2 24,032
Total sample 2.74 88.2 2,290.5 100.0 2,229,990 The table presents statistics, averaged over years, for the aggregate tax clienteles in the sample. Market values are reported in SEK billion. Dividend yields and market shares are reported in %.
Table 5: Dividend Yields and Tax Preferences 1a 2a 3a 4a 5a 2001 dummy 2.828 4.731 4.219 2.722 2.620 (0.028) (0.025) (0.039) (0.104) (0.108) 2002 dummy 2.355 4.344 3.823 2.335 2.224 (0.028) (0.023) (0.037) (0.103) (0.107) 2003 dummy 2.879 4.813 4.287 2.804 2.689 (0.028) (0.023) (0.036) (0.104) (0.106) 2004 dummy 2.677 4.575 4.049 2.566 2.451 (0.027) (0.023) (0.037) (0.102) (0.106) 2005 dummy 3.153 5.042 4.526 3.033 2.927 (0.027) (0.023) (0.037) (0.102) (0.106) B. Businesses –1.257 –0.303 –0.230 (0.027) (0.021) (0.020) C. Investment funds –0.335 –0.592 –0.534 (0.045) (0.032) (0.033) Tax preferenceθ 2.008 1.606 (0.116) (0.113) Beta (Market) –1.031 –0.557 –1.031 –0.558 (0.013) (0.022) (0.013) (0.023) Beta (HML) 1.185 1.184 (0.009) (0.009) Beta (SMB) 0.297 0.297 (0.025) (0.025) Idiosyncratic risk –0.029 –0.026 –0.029 –0.026 (0.001) (0.001) (0.001) (0.001) Adjusted R2 4.6 43.2 45.1 43.2 45.1 N 164,743 164,743 164,743 164,743 164,743 N0 29.9 29.9 29.9 29.9 29.9
The table presents the results of pooled least square regressions of dividend yield on portfolio char-acteristics over 2001–2005, as in regression equations (2) and (4). B. Businesses and C. Investment funds refer to dummy variables, which are equal to one if an investor belongs to clientele B and C, respectively, and otherwise zero. Clientele B includes Businesses and excludes individuals. The tax preference θ is defined as in expression (1). The betas are the factor loadings in a market model regression or in a three factor model regression (market; high-minus-low book-to-market ratio, HML, or value-minus-growth; small-minus-big market capitalization, SMB). Idiosyncratic risk is the (annualized) standard deviation of the residuals from the same regressions. Standard er-rors based on a pairwise bootstrap (500 replications) accounting for conditional heteroskedasticity and serial correlation are reported in parentheses. The adjusted R-squares in the regressions are reported in %. N is the total number of observations available; N0 is the number of observations with zero dividend yield expressed in % of total number of observations.
Table 6: Dividend Yields and Tax Preferences in Trimmed Samples
Number of stocks≥5 Portfolio value≥SEK 250,000 Clienteles A and C only
1b 3b 5b 1c 3c 5c 1d 3d 5d 2001 dummy 2.530 4.724 3.883 2.718 4.245 3.026 2.369 4.583 2.793 (0.025) (0.056) (0.091) (0.030) (0.068) (0.136) (0.037) (0.152) (0.165) 2002 dummy 2.209 4.206 3.368 2.574 3.755 2.536 2.236 4.279 2.605 (0.024) (0.052) (0.089) (0.029) (0.065) (0.134) (0.034) (0.149) (0.158) 2003 dummy 3.495 4.907 4.074 3.610 4.552 3.334 3.399 5.096 3.306 (0.027) (0.049) (0.087) (0.029) (0.063) (0.133) (0.038) (0.144) (0.151) 2004 dummy 3.051 4.575 3.742 2.967 4.203 2.985 2.861 4.640 2.833 (0.024) (0.051) (0.089) (0.030) (0.067) (0.133) (0.040) (0.150) (0.160) 2005 dummy 3.202 4.827 3.992 3.202 4.527 3.309 3.011 4.864 3.051 (0.023) (0.048) (0.088) (0.029) (0.066) (0.132) (0.041) (0.156) (0.165) B. Businesses –0.642 –0.045 –0.837 –0.145 (0.025) (0.016) (0.029) (0.025) C. Investment funds –0.342 –0.457 –0.562 –0.504 –0.337 –0.559 (0.037) (0.025) (0.044) (0.033) (0.044) (0.033) Tax preferenceθ 0.887 1.247 1.800 (0.088) (0.132) (0.103) Beta (Market) –0.900 –0.909 –0.602 –0.605 –1.033 –1.033 (0.045) (0.047) (0.043) (0.043) (0.139) (0.139) Beta (HML) 1.568 1.560 1.323 1.318 1.450 1.450 (0.020) (0.020) (0.023) (0.022) (0.036) (0.036) Beta (SMB) 0.642 0.664 0.414 0.418 0.742 0.742 (0.048) (0.046) (0.053) (0.054) (0.106) (0.105) Idiosyncratic risk –0.047 –0.046 –0.030 –0.029 –0.024 –0.024 (0.001) (0.001) (0.002) (0.002) (0.002) (0.002) Adjusted R2 12.1 54.5 54.3 5.8 41.4 41.4 4.9 41.4 41.4 N 44,426 44,426 44,426 74,513 74,513 74,513 14,865 14,865 14,865 N0 2.5 2.5 2.5 7.6 7.6 7.6 8.2 8.2 8.2
The table presents the results of pooled least square regressions of dividend yield on portfolio characteristics over 2001–2005. Specifications 1b, 3b, and 5b only include portfolios with five holding or more; specification 1c, 3c, and 5c only include portfolios with a market value of SEK 250,000 or more; specification 1d, 3d, and 5d only include tax clienteles A and C. The variables are defined as in Table 5. Standard errors based on a pairwise bootstrap (500 replications) accounting for conditional heteroskedasticity and serial correlation are reported in parentheses. The adjusted R-squares in the regressions are reported in %. N is the total number of observations available; N0 is the number of observations with zero dividend yield expressed in % of total number of observations.
Table 7: Dividend Yield and Tax Preferences in a Tobit Model 1e 2e 3e 4e 5e 2001 dummy 3.037 5.761 5.321 4.588 4.688 (0.026) (0.043) (0.059) (0.109) (0.144) 2002 dummy 2.012 4.659 4.236 3.487 3.603 (0.027) (0.032) (0.050) (0.106) (0.140) 2003 dummy 2.483 5.103 4.673 3.933 4.041 (0.026) (0.030) (0.047) (0.106) (0.136) 2004 dummy 2.336 4.877 4.452 3.706 3.821 (0.028) (0.031) (0.051) (0.105) (0.137) 2005 dummy 3.410 6.072 5.632 4.900 5.000 (0.025) (0.040) (0.059) (0.108) (0.141) B. Businesses –1.712 –0.084 0.004 (0.027) (0.025) (0.026) C. Investment funds –0.256 –0.824 –0.699 (0.041) (0.044) (0.042) Tax preferenceθ 1.234 0.700 (0.117) (0.148) Beta (Market) –0.711 –0.423 –0.715 –0.426 (0.021) (0.032) (0.022) (0.037) Beta (HML) 1.417 1.412 (0.015) (0.015) Beta (SMB) 0.525 0.525 (0.030) (0.032) Idiosyncratic risk –0.088 –0.087 –0.087 –0.086 (0.001) (0.001) (0.001) (0.002) Pseudo R2 4.1 45.4 47.7 45.4 47.6 N 164,743 164,743 164,743 164,743 164,743 N0 29.9 29.9 29.9 29.9 29.9 E(Yit|B,X¯it)−E(Yit|A,X¯it) –1.426 –0.082 0.004 –0.179 –0.102 (0.025) (0.024) (0.025) (0.017) (0.022) E(Yit|C,X¯it)−E(Yit|A,X¯it) –0.230 –0.780 –0.667 –0.357 –0.204 (0.037) (0.040) (0.040) (0.034) (0 043) The table presents the results of a pooled Tobit model where the dividend yield is regressed on portfolio characteristics over 2001–2005. The variables are defined as in Table 5. Standard errors based on a pairwise bootstrap (500 replications) accounting for conditional heteroskedasticity and serial correlation are reported in parenthesis. The pseudo R-square is the squared correlation between predicted and observed dividend yields and is reported in %. N is the total number of observations available; N0 is the number of observations with zero dividend yield expressed in % of total number of observations. The lower part of the table presents how the expected dividend yield on portfolios held by tax-exempt investors (clientele A) differs from the yields on other portfolios. The expected yields are calculated conditional on the typical characteristics of portfolios held by tax-exempt investors. Standard errors, calculated from the bootstrapped variance-covariance matrix in the Tobit estimation, are reported in parentheses.
T a ble 8 : R egressions o f O wnership F r actions o n F irm C haracteristics A. T a x n eutral B. Businesses & individuals C. In v e stmen t funds X. F o reigners & U nclassified 2001 dumm y 11.075 16.079 16.003 55.374 52.253 52.841 7.054 7.656 7.067 26.497 24.012 24.089 (1.158) (2.320) (2.314) (1.723) (3.260) (3.234) (0.697) (1.482) (1.573) (1.433) (2.787) (3.130) 2002 dumm y 12.448 17.253 17.148 53.404 50.480 51.075 8.305 8.837 8.207 25.844 23.430 23.571 (1.132) (2.172) (2.195) (1.639) (3.159) (3.106) (0.724) (1.430) (1.502) (1.358) (2.793) (3.014) 2003 dumm y 11.550 16.307 16.187 54.161 51.265 51.879 8.896 9.424 8.778 25.393 23.004 23.156 (1.175) (2.192) (2.175) (1.611) (3.114) (3.032) (0.729) (1.435) (1.488) (1.365) (2.817) (3.006) 2004 dumm y 13.614 18.425 18.316 51.413 48.500 49.148 8.983 9.507 8.869 25.990 23.568 23.667 (1.264) (2.277) (2.271) (1.711) (3.115) (3.101) (0.705) (1.435) (1.485) (1.388) (2.777) (3.064) 2005 dumm y 13.485 18.420 18.324 50.428 47.351 47.994 8.380 8.972 8.347 27.707 25.256 25.335 (1.253) (2.221) (2.234) (1.824) (3.166) (3.171) (0.748) (1.444) (1.517) (1.479) (2.898) (3.160) Dividend dumm y 10.611 7.639 7.303 –12.662 –9.879 –9.441 5.935 5.005 4.609 –3.884 –2.765 –2.471 (1.423) (1.670) (1.673) (1.917) (2.225) (2.402) (0.840) (1.051) (1.015) (1.518) (1.887) (2.077) Beta (Mark e t) 0.573 0.819 –5.754 –5.938 3.393 4.104 1.778 1.015 (1.130) (1.248) (1.683) (2.052) (0.741) (0.817) (1.593) (1.660) Beta (HML) 0.486 2.531 –1.144 –1.873 (1.493) (2.379) (0.891) (2.053) Beta (SMB) – 0.298 –1.470 –1.432 3.200 (1.456) (2.808) (0.999) (2.270) Idiosyncratic risk –8.415 –8.236 16.120 17.518 –7.709 –7.326 0.004 –1.957 (2.449) (2.699) (3.125) (3.995) (2.092) (2.194) (3.330) (4.145) Adjusted R 2 8.3 10.1 10.1 7 .0 11.4 13.1 7 .3 12.8 13.6 0 .9 1.0 3 .2 N 1 ,306 1,306 1,306 1,306 1 ,306 1,306 1,306 1,306 1,306 1,306 1,306 1,306 The table presen ts the results o f p o o led least square regressions o f p ercen tage o w nership fraction o n firm ch aracteristics o v e r 2 001–2005, as in regr ession equation (5). The d ividend dumm y equals one if a firm pa ys dividends, a nd zero otherwise. The b etas are the factor loadings in a m ark e t m o d el regression or in a three factor m o d el regression (mark e t; high-min us-lo w b o ok-to-mark et ratio, HML, or v a lue-min u s-gro w th; small-min us-big mark et capitalization, SMB). Idiosyncratic risk is the (ann u alized) standard deviation o f the residuals from the same regressions. S tandard errors based on a p airwise b o o tstrap (500 replications) a ccoun ting for c onditional heterosk edasticit y and serial c orrelation are rep orted in p aren theses. T he ad justed R-squares in the regressions a re rep o rted in %. N is the total n um b e r o f o bserv a tions a v a ilable.
Table 9: Market Value of Stock Portfolio Relative to Book Value of Assets
0-25% 26-50% 51-75% 76-100% ≥101% Sum Non-financial firms 19,294 4,010 1,841 916 695 26,756
[72.1] [15.0] [6.9] [3.4] [2.6] [100.0] Assets<SEK 2 million 7,719 2,311 1,100 602 486 12,218 [63.2] [18.9] [9.0] [4.9] [4.0] [100.0] Assets≥SEK 2 million 11,575 1,699 741 314 209 14,538 [79.6] [11.7] [5.1] [2.2] [1.4] [100.0]
Financial firms 626 389 237 144 144 1,540
[40.6] [25.3] [15.4] [9.4] [9.4] [100.0] The table presents the number of observations of the ratio of the market value of the stock portfolio to the book value of total assets. The frequencies of the observations (in %) are given in square brackets. Non-financial firms are further divided into firms with assets below and above SEK 2 million.
Figure 1: Beta (HML) Loadings in In v e stors’ P o rtfolios The fi gure displa ys p e rcen t frequency histograms of the b eta (HML) loadings of p o rtfolios held b y tax c lien teles A –C. C lien tele B is further d ivided in to B1 (Businesses) and B 2 (Individuals).
2: Num b er of Sto c ks in In v e stors’ P o rtfolios fi gure displa ys p e rcen t frequency histograms o f the n u m b er of sto cks in p o rtfolios held b y tax c lien teles A –C. C lien tele B is further d ivided in to B 1 and B 2 (Individuals).
Figure 3: V a lue o f In v e stors’ P o rtfolios The fi gure displa ys p e rcen t frequency histograms o f the log v alue of the sto ck s in p ortfolios h eld b y tax clien teles A–C. Clien tele B is further divided in to B1 (Businesses) and B 2 (Individuals). The b ase for the log is 10, whic h m eans that 3 e quals 1 ,000, 4 e quals 10,000, e tc.
SIFR Research Report Series
All reports can be downloaded from our website www.sifr.org, under the heading Re-search. Reports no. 1-15 are also available in print. In order to obtain copies of printed reports, please send your request to info@sifr.org with detailed ordering information.
1. Foreigners’ Trading and Price Effects Across Firms
Magnus Dahlquist and G ¨oran Robertsson, December 2001
2. Hedging Housing Risk
Peter Englund, Min Hwang, and John M. Quigley, December 2001
3. Winner’s Curse in Discriminatory Price Auctions: Evidence from the Norwegian Treasury Bill Auctions
Geir Høidal Bjønnes, December 2001
4. U.S. Exchange Rates and Currency Flows
Dagfinn Rime, December 2001
5. Reputation and Interdealer Trading. A Microstructure Analysis of the Treasury Bond Market
Massimo Massa and Andrei Simonov, December 2001
6. Term Structures in the Office Rental Market in Stockholm
˚
Ake Gunnelin and Bo S ¨oderberg, April 2002
7. What Factors Determine International Real Estate Security Returns?
Foort Hamelink and Martin Hoesli, September 2002
8. Expropriation Risk and Return in Global Equity Markets
Ravi Bansal and Magnus Dahlquist, November 2002
9. The Euro Is Good After All: Corporate Evidence
Arturo Bris, Yrj ¨o Koskinen, and Mattias Nilsson, November 2002
10. Which Investors Fear Expropriation? Evidence from Investors’ Stock Picking
Mariassunta Giannetti and Andrei Simonov, November 2002
11. Corporate Governance and the Home Bias
Magnus Dahlquist, Lee Pinkowitz, Ren´e M. Stulz, and Rohan Williamson, November 2002
12. Implicit Forward Rents as Predictors of Future Rents
Peter Englund, ˚Ake Gunnelin, Martin Hoesli, and Bo S ¨oderberg, November 2002
13. Accounting Anomalies and Information Uncertainty
Jennifer Francis, Ryan LaFond, Per Olsson, and Katherine Schipper, June 2003