Transparency and the sustainability
reporting practice of Norwegian
Companies
Benjamin Drivdal
Supervisor: Lars Jacob Tynes Pedersen
CSI Center for Service Innovation at NHH
NORWEGIAN SCHOOL OF ECONOMICS
This thesis was written as a part of the Master of Science in Economics and Business Administration at NHH. Please note that neither the institution nor the examiners are responsible − through the approval of this thesis − for the theories and methods used, or results and conclusions drawn in this work.
Norwegian School of Economics
Bergen, Fall, 2015
EXECUTIVE SUMMARY
The world’s climate is changing, and companies around the world are irreversibly impacting societies and the environment. Regulators are increasingly turning to non-financial disclosure regulations as a tool to increase corporate transparency about social and environmental issues. The goal is to make companies accountable for their impact on their environment and to incentivize better corporate social and environmental performance. To achieve this,
stakeholders need information on how well corporations perform on these issues. This study is aimed at finding out how transparent corporations are in disclosing quantitative
performance measures. This is done in a Norwegian context, drawing a sample of companies affected by the 2013 amendment to the Norwegian Accounting Act. The amendment added requirements for non-financial disclosure for large companies in Norway. This study used a transparency framework to assess the transparency of annual reports from 2014. This revealed a varying degree of transparency on the different categories in the framework. Most
importantly, this study found that transparency on environmental issues is alarmingly low. Secondly, it found that the specificity of the Accounting Act may play a role in the variability of transparency across different issues. Therefore, there is a need for more knowledge on how the regulators’ tools are affecting performance.
Keywords: Transparency, CSR, Sustainability, Corporate Reporting, Non-financial Disclosure, Disclosure Regulation
EXECUTIVE SUMMARY ... 2
1 INTRODUCTION ... 6
1.1RESEARCH QUESTION ... 7
2 CONCEPTUAL FRAMEWORK ... 10
2.1CORPORATE RESPONSIBILITY ... 10
2.1.1 The Scope of Corporate Responsibility ... 10
2.1.2 What is responsibility? ... 11
2.1.3 Level 1 Responsibility: Causal Responsibility ... 12
2.1.4 Level 2 Responsibility: Society and Prerequisites ... 13
2.1.5 Level 3 Responsibility: Philanthropy ... 14
2.2TRANSPARENT REPORTING ... 15
2.2.1 What is transparency? ... 15
2.2.2 What are the Advantages of Transparency? ... 16
2.2.3 What are the Disadvantages of Transparency? ... 16
3 HISTORICAL BACKGROUND FOR CORPORATE SUSTAINABILITY REPORTING ... 18
3.1DRIVERS FOR NON-FINANCIAL REPORTING ... 18
3.2INTERNATIONAL NON-FINANCIAL REPORTING INITIATIVES ... 18
3.2.1 United Nations Global Compact (UNGC) ... 19
3.2.2 The Global Reporting Initiative (GRI) ... 20
3.3NON-FINANCIAL DISCLOSURE REGULATION IN NORWAY ... 20
4 EXISTING RESEARCH ... 22
4.1.1 CSR’s Four Different Mediating Effects on Firm Performance ... 23
4.2DOES REPORTING ON CSRISSUES LEAD TO BETTER PERFORMANCE ON CSRISSUES? ... 24
4.3DOES NON-FINANCIAL DISCLOSURE REGULATIONS IMPROVE REPORTING? ... 24
4.3.1 Is Disclosure Volume Increased? ... 24
4.3.2 Are Reports Compliant with Regulations? ... 25
4.3.3 Are Reports Using International Reporting Frameworks? ... 25
4.3.4 Is Disclosure Transparent and Comparable? ... 26
4.4WHAT IS THE STATE OF NON-FINANCIAL REPORTING IN NORWAY? ... 26
4.4.1 Disclosure Volume and Quality ... 26
4.4.2 Compliance with Regulations ... 27
4.4.3 Disclosure Transparency and Comparability ... 28
5 METHODOLOGY ... 29
5.1 RESEARCH DESIGN ... 29
5.1.1 Design choices ... 29
5.1.2 Limits of design ... 30
5.1.3 Challenges: Objectivity, reliability and validity ... 30
5.2RESEARCH SAMPLE ... 31
5.3 DATA SOURCES ... 33
5.3.1 Annual reports for the accounting year of 2014 ... 33
5.3.2 Limited to public information ... 33
5.3.3 Challenges with secondary information ... 33
5.3.4 Is the information in the data sources valid? ... 34
5.4.1 Advantages of basing the study on an existing framework ... 35
5.4.2 Specifying rules ... 36
5.4.3 Analysis of the reports ... 36
6 FINDINGS ... 38
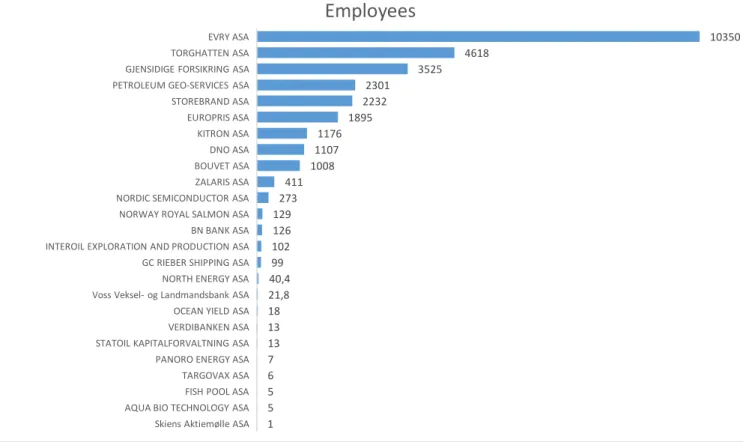
6.1ABOUT THE SAMPLE ... 38
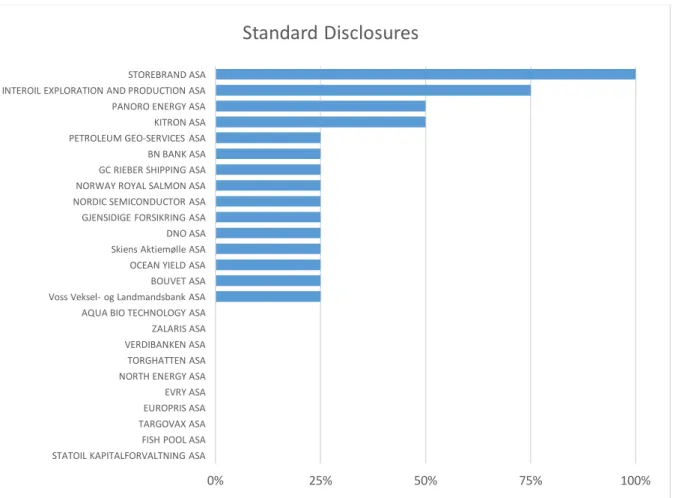
6.2STANDARD DISCLOSURES ... 42
6.3GOVERNANCE ... 44
6.4LABOR ... 46
6.5HEALTH AND SAFETY ... 48
6.6ENVIRONMENT ... 50
7 DISCUSSION ... 51
7.1ANALYSIS OF FINDINGS ... 52
7.1.1 Transparency on Governance versus Environment Indicators ... 52
7.1.2 Further Analysis of Disclosure of Environmental Information ... 53
7.1.3 Standard Disclosures, Labor, and Health and Safety Indicators ... 55
7.2WHAT IS THE RELATIONSHIP BETWEEN REGULATION SPECIFICITY AND TRANSPARENCY? ... 56
7.3THE MOST/LEAST TRANSPARENT COMPANIES ... 56
7.4LIMITATIONS AND SUGGESTIONS FOR FURTHER RESEARCH ... 58
7.5CONCLUSIONS ... 59
8 SUMMARY ... 60
1 INTRODUCTION
The world is on a dangerous path. We are continuously emitting greenhouse gasses that are causing global warming (IPCC, 2014). This in turn is irreversibly impacting ecosystems and increasing the risk of extreme weather conditions such as droughts and cyclones. The
emissions are largely driven by our economic activity and energy use to fuel our lifestyle and increase wealth and living standards (IPCC, 2014).
While companies on one hand are providing jobs, goods and services our society demands, many companies on the other hand are further worsening the current environmental crisis. An important problem is that when information on companies’ environmental footprint1 is not available to customers, investors or society, then companies can exploit our largest common good with little or no consequences. In order to offset this information asymmetry, reporting requirements are implemented by governments around the globe (GRI, 2013). Systematic and transparent reporting can incentivize sustainable development because customers and
investors may move spending and investments to more sustainable companies when such information is available (Pedersen & Døskeland, 2015), and because more transparent companies specifically attract large long-term oriented institutional investors (Eccles, Grant, & van Riel, 2006).
In the last decade there has been a large growth in the number of sustainability initiatives globally (Kiron, Kruschwitz, Haanaes, & von Streng Velken, 2012). International reporting standards are being developed and national and transnational political processes are at work to revise the reporting requirements for companies. In the last few years there has been a large increase in the number of companies publishing financial reports or including non-financial information in their annual reports (Ditlev-Simonsen, 2014), and today 93% of the largest 250 companies in the world report on their sustainability performance (GRI, 2015). Two of the most widely used reporting frameworks are the United Nations Global Compact and the Global Reporting Initiative (Ditlev-Simonsen, 2014).
1 Such performance is variably referred to as “sustainability performance”, “CSR
performance” or “ESG performance”. In this paper, the terms “sustainability”,
“environmental, social and governance” (ESG), “non-financial” and “corporate social responsibility” (CSR) are used interchangeably, to describe reports with different degrees of focus on environmental, social and governance issues, or firms’ performance in these areas.
Political processes in the EU have resulted in several sustainability initiatives and in 2014 the EU Commission revised reporting requirements for the companies in the region (UNEP, GRI, KPMG and the Centre for Corporate Governance in Africa, 2013). The amended act requires non-financial reporting for the around 6000 companies listed on stock exchanges in the member states and the EFTA countries (Ditlev-Simonsen, 2014). Several countries have also amended their financial statements acts to require extensive non-financial reporting (UNEP, GRI, KPMG and the Centre for Corporate Governance in Africa, 2013). Norway added such requirements in 2013 (§3-3, 2013) affecting around 450 companies (Ditlev-Simonsen, 2014). The Norwegian Accounting Act § 3-3 c now requires large companies to report on how they integrate human rights, labor rights and social conditions, the environment, and
anti-corruption into their strategies and operations. One purpose of such requirement on non-financial reporting is to increase companies’ transparency and provide information necessary for decision-making to stakeholders such as customers, investors, creditors and regulators (Norwegian Ministry of Foreign Affairs, 2009). Another purpose is that it can work as an incentive to integrate environmental and social responsibility into companies’ strategies and governance (ibid.) (Eccles, Ioannou, & Serafeim, 2014).
Earlier research have studied the effect of non-financial reporting legislation on stock market variables (Cheng, Ioannou & Serafeim, 2014), sustainability disclosure legislations’ effects on reporting volume and quality (Serafeim & Ioannou, 2014), and compliance with the specific requirements of the Norwegian legislation (Ruud, Ehrenclou & Gramstad, 2008; Olsen & Orderdalen, 2014). The research in the Norwegian context found varying efforts on
sustainability reporting, and Olsen and Orderdalen (2014) noted that reports did generally not include comparable results from the companies’ sustainability efforts making it nearly
impossible to assess their sustainability performance. The regulators in Norway do not prescribe the use of a specific non-financial reporting standard to ensure comparability between companies. Incomparable reports may limit the impact and usefulness of non-financial reporting (Eccles, Serafeim, & Krzus, 2011) despite the reports being compliant to the law. To my knowledge, there is done little research on the comparability and transparency of non-financial reporting in a Norwegian context.
1.1 Research Question
The purpose of this study is to explore how open or transparent Norwegian companies are on their ESG performance, thus analyzing a fundamental purpose of the requirement of
non-financial reports from Norwegian corporations affected by the amendment put into effect in 2013. This is important because the non-financial reports have not always fulfilled the requirements of the law (Olsen & Orderdalen, 2014; EY, 2014) and the information has not always been readily available or easily comparable for most stakeholders of the companies issuing these kinds of reports (Rea, 2015).
One key issue is that the Norwegian Accounting Act does not require the use of a specific standard or framework (§3-3, 2013), thus giving reporting companies many different possible ways of how to write the reports. This means companies can almost freely decide what indicators to use, what level of detail to write, and whether or not to include quantitative and comparable performance results. The risk is therefore that the usefulness and comparability of the reports may be undermined by the decisions and interests of the reports’ authors (Langer, 2006). By reviewing 25 non-financial reports and evaluating them from a transparency point of view, I will shed light on how well the reports fulfill the accounting law’s intention of providing “stock holders, customers and the society with better information on the company’s approach to CSR” (Norwegian Ministry of Foreign Affairs, 2009, p. 83, author's translation). With this in mind I have formulated the following research question:
“How transparent are Norwegian companies about their CSR performance in the annual reports for the accounting year 2014”.
Transparency in business is defined by Transparency International (2015) as making available information on rules, plans, processes and actions. It is generally held that transparent
organizations’ actions and results should be visible so that the organizations can be held accountable for the actions being performed. In this paper, transparency is further narrowed down to include only quantitative and easily comparable information to better be able to distinguish between general non-descriptive statements and actual performance.
The Norwegian Accounting Act § 3-3 c breaks down corporate responsibility into issues regarding human rights, labor rights and social conditions, the environment, and
anti-corruption. Frameworks such as the Global Reporting Initiative’s G4 and the principles of the UN Global Compact cover these issues and enable reporting companies to establish a
standardized non-financial disclosure practice. With this in mind, I investigate the following sub-question to clarify the terms in the research question and to analyze transparency about CSR performance along four dimensions for which it is reasonable to expect companies to have quantitative data:
“How much quantitative and easily comparable information is publically disclosed by Norwegian companies about their corporate governance, labor conditions, health and safety, and environmental impact?”
This is investigated by reviewing the non-financial reports or integrated annual reports of a sample of the companies affected by the Norwegian Accounting Act § 3-3 c. The law is applicable for large companies. It is estimated that the law affected roughly 450 companies from 2013. A sample of 25 companies is selected from this population. The reports are
evaluated using a set of questions regarding each of the four dimensions it is expected that the companies should have quantitative and comparable data, and each report is given a
transparency score on the basis of how many of the questions that the public reports can answer.
This study is limited to public available reports for the accounting year of 2014, to reflect the information available to the companies’ stakeholders. I have not attempted to verify the accuracy or validity of the published information, since this would not reflect available information used by stakeholders in their decision-making.
The rest of the paper is structured as follows. Chapter 2 is devoted to presenting the
conceptual framework of the paper. Chapter 3 outlines a short historical background for the development of international reporting frameworks and disclosure regulations. Chapter 4 covers a review of recent literature analyzing the effects of disclosure regulation on
transparency and performance. Chapter 5 outlines the methodology for the empirical research of this paper and discusses the relevance of the framework used. Chapter 6 presents the results of the study, and the findings are discussed in chapter 7.
2 CONCEPTUAL FRAMEWORK
The term “corporate sustainability” is defined by Soppe (2007) as “a company’s ability to create long-term value by taking risks and opportunities from the economic, environmental and social developments”.
In this paper, the terms “sustainability”, “environmental, social and governance” (ESG), “non-financial” and “corporate social responsibility” (CSR) are used interchangeably, to describe reports with different degrees of focus on environmental, social and governance issues, or firms’ performance in these areas. term
2.1 Corporate Responsibility
In this section I will discuss the conceptions of what corporate responsibility consists in, before outlining a broad definition of what responsibility means. The discussion leads to a framework of different levels or areas of responsibility for business. Because regulators want to increase performance and awareness through non-financial reporting regulations
(Norwegian Ministry of Finance, 2012), it is important to understand what types of responsibility regulators are aiming at.
2.1.1 The Scope of Corporate Responsibility
“Few trends could so thoroughly undermine the foundations of our free society as the acceptance by corporate officials of a social responsibility other than to make as much money for their shareholders as possible.” (Milton Friedman, 1962 quoted in (Morsing & Pruzan, 2007))
When discussing the concept of corporate social responsibility (CSR), it is only natural to begin with the well-known perspective of Nobel Laureate Milton Friedman. His shareholder perspective has dominated economic thinking for more than 40 years (Morsing & Pruzan, 2007). In the article “The Social Responsibility of Business Is to Increase Its Profits” (1970), Friedman argues that the social responsibility of companies is best preserved through
maximizing shareholder profit, while paying taxes to the government and letting them take responsibility for social issues. First and foremost, this is due to Friedman`s division of responsibility between the corporation and governments, which suggests social issues are best handled by governments while business should focus on business. Friedman argues that to maximize shareholder value, it is in the self-interest of managers to treat stakeholders and
customers well to create long-term customer loyalty. Attending to other objectives might then seem as an unnecessary distraction.
The foremost critic of Friedman’s shareholder-centric perspective is Edward Freeman who in 1984 published a stakeholder-centric response (Jørgensen & Pedersen, 2015). Freeman (1984) argued that companies have a fundamental responsibility for the stakeholders affected by the companies’ operations, in the same way companies should be held accountable for their stewardship of their shareholders’ capital. This perspective therefore incorporates externalities as a major factor when considering the limits of companies’ responsibility. While the
shareholder perspective focuses on the legal power of the shareholder within the limits of the law, the stakeholder perspective increases the scope to also take responsibility for the negative effects of the companies’ operations on the social and environmental landscape.
The consequences of the two perspectives becomes clearer in the cases where the interest of the firm would diverge from the interest of the company’s shareholders. A company’s interests lie in the long-term value it can create over its expected lifetime (ref. the definition of corporate sustainability in chapter 2.1), while Quarterly Earnings Calls in listed companies stresses short-term profits and growth in share price for the shareholders (Eccles & Serafeim, 2013). Focusing only on maximizing shareholder value, will therefore not always result in managers creating long-term value. Short-term oriented managers undermine Friedman’s fundamental assumption mentioned above; that managers’ enlightened self-interest will lead them to work for long-term customer loyalty.
2.1.2 What is responsibility?
This and the following three sub-sections explores the fundamental definition of what responsibility is and discusses the difference between having and taking responsibility. This distinction is important for understanding the underlying assumptions in Freeman’s
stakeholder perspective (see chapter 2.2.1) and provides a framework for later discussions. Having responsibility does not mean that you take responsibility
According to the Oxford Dictionary of English (2013) responsibility is defined as a state of being accountable or to blame for something, and as the ability to take decisions.
Responsibility can be divided into several types, depending on whether it is ex ante or ex post responsibility, whether it is direct or indirect, and the scope of the responsibility (Syse & Olsen, 2013).
Ex ante responsibility is a responsibility that is defined prior to the actions taken based on a person’s role. The responsibility can be defined through for example expectations, contracts and regulations. When something has happened and one is looking for who caused the event to happen, or when someone takes on the obligation to clean up, then we are looking for ex post responsibility.
Secondly, responsibility can be divided depending on whether one actor causally made an event happen or if the actor was only partially contributing to it. This distinction can be quite controversial, because it questions what responsibility corporations should have for atrocities not directly caused by the company, but enabled by their operations. For example, should Norwegian companies operating in countries known for severe human-rights violations and large-scale corruption be held accountable for legitimizing or stimulating these violations? Thirdly, responsibility can be narrow or wide in scope. A narrow responsibility means that a company should only be held accountable to the shareholders as long as they stay within legal and contractual limits in the region of operation, a perspective promoted by Milton Friedman. A wide responsibility means extending the accountability to a wider specter of stakeholders, like in the stakeholder perspective of Freeman.
This study focuses on the ex ante responsibility, that is the responsibility of companies by virtue of their role in society.
2.1.3 Level 1 Responsibility: Causal Responsibility
The concept of Corporate Social Responsibility is closely tied to the concept of externalities. Externalities are “indirect effects of consumption or production activity, that is, effects on agents other than the originator of such activity which do not work through the price system.” (Laffont, 2008). The problem of externalities is the foundation of the stakeholder perspective of Freeman (Jørgensen & Pedersen, 2015), and the problem becomes apparent when
considering that companies’ use of common goods like the air or oceans (the natural environment) benefits the companies, but the costs are carried by society as a whole. In the current legal environment companies in many cases do not hold ex ante responsibility for pollution or other externalities from their operations. This is especially apparent when the Norwegian Ministry of Foreign Affairs in the White Paper Corporate Social Responsibility in a Global Economy (2009, s. 7) defines Corporate Social Responsibility (CSR) as what
companies do on a voluntary basis to integrate social and environmental considerations into their operations. This means that companies in Norway are not held legally accountable for
the issues defined as “CSR-related”. On the other hand, this formulation makes very much sense when reviewing the term “license to operate”, a term that is much used when companies place responsibility on the political level that created the rules of the game (De Geer, 2007). If CSR was defined using a specific national legal framework, what responsibility would a multinational company then have when operating within a different country with a shaky legal and political framework? Ex ante social corporate responsibility is therefore not easily defined.
Regardless of how legal frameworks define the ex ante responsibility of companies for their externalities, companies still hold ex post responsibility for the externalities because they caused them. This means that regardless of who are obliged to take responsibility to clean up the external effects of business, business has responsibility because they caused the effects. 2.1.4 Level 2 Responsibility: Society and Prerequisites
An important question when defining corporate responsibility is the division of responsibility between the public and private domain (Morsing & Pruzan, 2007). This is one of the
fundamental questions in the CSR literature (Jørgensen & Pedersen, 2015). There are likely many social, legal and political conditions that are prerequisites for companies to successfully develop profitable operations. Morsing and Pruzan (2007) asks the appropriate question; to what extent should companies contribute to create conditions they themselves benefit from? Corporate responsibility then becomes more complex as the company is treated less like a simple legal entity and more like a corporate citizen (ibid.).
As corporations become increasingly global, the division of responsibility between private companies and the public institutions is challenged. Hans De Geer (2007) points out that there does not exist a global political power defining global legislation. Many companies operate in countries with weak social, political and/or legal structures, and have resources that exceeds the means of many of these countries. De Geer therefore argues that companies must do more than merely comply with the laws in these countries.
De Geer’s view means that especially multinational corporations should contribute to the creation of societal conditions that benefit all companies, instead of exploiting the short-term opportunities found through the weak legal structures. Matten and Crane (2005) calls this kind of responsibility for corporate citizenship, were corporations work as providers, enablers, and channels of social rights. Corporate citizenship in practice involves corporations filling the gap where governments fail to provide or facilitate public services (ibid.). Matten and Crane
however, point to important concerns regarding who a corporate citizen should be held accountable to. Corporations are normally held accountable to their shareholders, and not to the public as the government they fill in for is.
The moral reasoning for Hans De Geer’s position is excellently summarized in the World Commission on Environment and Development’s definition of sustainable development; “sustainable development meets the needs of the present without compromising the ability of future generations to meet their own needs.” (Quoted in (Tencati, 2007)). Exploitation of weak legal structures means that profit is gained by the company today without regard to the present or future generations in these areas. Such opportunism is therefore not compliant with sustainable development.
An important perspective on this level of responsibility is the concept of Creating Shared Values (CSV) by Michael E. Porter and Mark R. Kramer (2011). The CSV perspective is about recognizing that improved social conditions may have benefits for the company. Porter and Kramer illustrate their perspective by contrasting it to the concept of Fair Trade. A Fair Trade approach would reduce company profits (or increase the price to consumers) to offer local farmers higher prices for their crops, typically resulting in a 20-30% increase in their salaries. On the other hand, a CSV approach would be to invest in measures that increase the farmers’ efficiency, yield, product quality and sustainability, benefiting both the farmers and the firm. Instead of focusing on redistribution, a CSV investment “is about expanding the total pool of economic and social value” (Porter & Kramer, 2011, s. 5).
2.1.5 Level 3 Responsibility: Philanthropy
In Jørgensen and Pedersen’s book Responsible and Profitable (2015), they present the view that companies can both shine light and casts shadow onto the social and environmental landscape. Shining light and casting shadows are used as metaphors for positive and negative externalities. While the metaphors are quite useful, the metaphor of shining light is limited in the sense that it makes no clear distinction between actions that affect a company’s
operational efficiency and profitability by creating shared values, and actions of redistribution and philanthropy that only affect a company’s reputation and brand. This distinction is
important because it seems to affect how corporations react to regulation and activism. Malaysian companies for example tend to perceive CSR activities only as philanthropic initiatives, and therefore overlook the opportunity to integrate responsibility initiatives into their core business model (Serafeim & Ioannou, 2014).
Jørgensen and Pedersen (2015) describes three continuums in CSR; motivation (extrinsic and intrinsic), integration (degree in which CSR affects core operations), and effect (degree of effect on profitability). Philanthropic initiatives are separated from Shared Value initiatives based on this continuum, where philanthropic initiatives do not affect the corporations’ core operations. Despite this separation, philanthropy may effect profitability by increasing brand recognition, improving employee morale and productivity, and overcoming regulatory obstacles (Smith, 1994).
In sum, companies can take responsibility for something that they are not obliged to (ex ante responsibility), have not causally responsibility for (ex post responsibility), and that does not have a positive effect on their own core activities (CSV). In other words, we say that
companies take responsibility when they do more than society could expect (Syse & Olsen, 2013). A good example of this type of responsibility is the company TOMS, that donate a pair of shoes to children in need for each pair of shoes sold (TOMS Shoes, 2015).
2.2 Transparent Reporting
Regardless of to what extent companies act responsibly or take on responsibility, they may still differ in the degree to which they are transparent on their social and environmental performance. This section therefore discusses what transparency means, and how systematic and transparent disclosure is one possible solution to the problem that those who are
responsible (ex post/causal responsibility) does not take responsibility (ex ante responsibility). This section positions and focuses the study by giving an account for why transparency is an important tool for achieving better corporate responsibility performance.
2.2.1 What is transparency?
Transparency can be defined as “timely and reliable economic, social and political
information, which is accessible to all relevant stakeholders” (Kolstad & Wiig, 2009), and has long been understood as synonymous to the idea of openness (Ball, 2009).
There can also be several types of organizational transparency (Ball, 2009). Political transparency is openness on the goals and purpose of the organization. Economic
transparency is openness on the technical factors involved in making a decision, for example the elements for calculating a credit score. Procedural transparency is openness on the procedures involved in a decision, for example the board’s voting procedures. Operational transparency is openness on performance. The empirical part of this study will focus mainly
The definition of transparency is excellently summarized by Transparency International: “Transparency is about shedding light on rules, plans, processes and actions. It is knowing why, how, what, and how much.” (2015)
2.2.2 What are the Advantages of Transparency?
Transparency ensures that business leaders and other decision-makers’ actions are visible and that others can hold them accountable (Transparency International, 2015). Legislation
requiring more transparency make society’ expectations clear, and is an important tool to encourage socially and environmentally conscious practice (Norwegian Ministry of Foreign Affairs, 2009). With clear lines of accountability, unacceptable practice becomes more difficult to justify (Bandura, Caprara, & Zsolnai, 2007).
Increased transparency may lead to less moral disengagement from the acts done in the name of corporations and the stakeholders they affect, therefore encouraging more conscious practice (Bandura, Caprara, & Zsolnai, 2007). Transparency is therefore morally important because it enhances an attitude of honesty and commitment to truth (Dubbink, Graafland, & van Liedekerke, 2008), and can transform into more conscious behavior because clearly seeing the consequences of decisions made may evoke empathy (Bandura, Caprara, & Zsolnai, 2007).
Allocative efficiency is enhanced by transparency because it enables customers to choose the products that is better on dimensions that are important to them, and it allows for companies to differentiate themselves from bad CSR performers (Dubbink, Graafland, & van
Liedekerke, 2008).
For business to flourish it is important to build trust and good relations with customers and other stakeholders. Transparency may be a way to show respect to stakeholders and is crucial when implementing initiatives that are aimed at improving reputation (Dubbink, Graafland, & van Liedekerke, 2008). When companies’ activities affect stakeholders’ interests, they should have a reasonable right to information (ibid.). Systematic and transparent reporting can therefore be an important tool for companies to build good stakeholder relations. 2.2.3 What are the Disadvantages of Transparency?
Obtaining information may be costly and difficult for corporations. This may be especially true for CSR related information, because some aspects of CSR are difficult to measure (Dubbink, Graafland, & van Liedekerke, 2008). Several aspects, such as environmental
indicators, are easily quantifiable, but may still be difficult to obtain for many companies because measurement has not yet been standardized to the same degree as financial
information has been. On the other hand, new technology is rapidly diminishing the cost of measurement (ibid.).
Disclosure regulations mandating more transparency may backfire as the regulations in themselves can signal distrust (Dubbink, Graafland, & van Liedekerke, 2008). This signal can therefore promote an attitude of minimum compliance in corporations, creating resistance and distance between management and stakeholders.
Transparent self-disclosure may be used as a “vaccine” against some of the negative effects of being targeted by NGO activism (Reimsbach & Rüdiger, 2013). From a risk perspective, this is an advantage as self-disclosure reduces the risk of being exposed by third-parties. From a responsibility perspective, this is negative because campaigns against perceived bad
3 HISTORICAL BACKGROUND FOR CORPORATE SUSTAINABILITY REPORTING
This chapter will give a brief overview of the most important drivers for the growth in sustainability reporting; market-based, societal, political, regulatory and ethical drivers for non-financial disclosure (Vormedal & Ruud, 2009). Next, this chapter will describe two of the most important international non-financial reporting initiatives. The chapter concludes with a brief review of the political and regulatory drivers in Norway.3.1 Drivers for Non-Financial Reporting
Vormedal and Ruud (2009) explains that demand for non-financial information has increased with the growth in social responsible investment funds, creating market-based pressure on companies to disclose more information and for analysts to use such information. A major market-based driving factor in a Norwegian context has been the Government Pension Fund – Global with its ethical standards for companies in its portfolio (UNEP, GRI, KPMG and the Centre for Corporate Governance in Africa, 2013).
Societal drivers stem from pressure from stakeholder groups (both internal and external) to make companies disclose information on how company operations affect the stakeholders’ interests. This driver is related to the rising arguments that effective stakeholder management increases firm performance, and that transparency helps improve reputation (ibid.).
Politics and regulations have placed expectations on firms to become more transparent, especially through “soft-law” tools were companies are required to disclose information on how corporate responsibility is integrated into the company, or admit that it is not (ibid.). The establishment of international standard-setting organizations for non-financial reporting is relevant in this context, because these standards make non-financial reporting more useful and because they are referenced in the regulations (see Accounting Act § 3-3 c).
Lastly, Vormedal and Ruud (2009) points to the ethical driver, as companies’ boards are gradually accepting the view that companies should be held accountable a wider range of stakeholders.
3.2 International Non-Financial Reporting Initiatives
Initiatives for international non-financial reporting standards originated in the US and Europe during the 1960s and 1970s, driven by a renewed awareness of responsibilities that the governments were not able to fulfill (Serafeim & Ioannou, 2014). Two of the most well
known reporting initiatives, and the only two standards mentioned in the Norwegian
Accounting Act (§3-3, 2013), are the UN Global Compact (UNGC) and the Global Reporting Initiative (GRI). Because reporting instruments that transcend national boundaries can
improve the comparability of reports (UNEP, GRI, KPMG and the Centre for Corporate Governance in Africa, 2013), the two initiatives are discussed below.
3.2.1 United Nations Global Compact (UNGC)
In 1999 the UN initiated the Global Compact (UNGC) with the goal to create a sustainable and inclusive global economy (UNGC, 2015). The UNGC provides a normative framework to help companies shape their sustainability vision (UNEP, GRI, KPMG and the Centre for Corporate Governance in Africa, 2013). The idea is that companies align their operations to ten fundamental principles related to human rights, working conditions, the environment and anti-corruption (see Table 1).
Today UNGC is the largest policy initiative for businesses committed to these principles (UNEP, GRI, KPMG and the Centre for Corporate Governance in Africa, 2013), with 8343 supporting companies at the time of writing (UNGC, 2015). Companies supporting the UN Global Compact (“signatories”) must annually and publicly publish a Communication on Progress, and they recommend the use of the Global Reporting Initiative’s framework for these reports (Norwegian Ministry of Finance, 2012). Failing to publish Communications on
Table 1 The United Nations Global Compact Principles.
Human rights
Principle 1: Businesses should support and respect the protection of internationally proclaimed human rights; and
Principle 2: make sure that they are not complicit in human rights abuses.
Labor
Principle 3: Businesses should uphold the freedom of association and the effective recognition of the right to collective bargaining;
Principle 4: the elimination of all forms of forced and compulsory labor;
Principle 5: the effective abolition of child
labor; and Principle 6respect of employment and occupation. : the elimination of discrimination in
Environment
Principle 7: Businesses should support a precautionary approach to environmental challenges;
Principle 8: undertake initiatives to promote greater environmental responsibility; and
Principle 9: encourage the development and diffusion of environmentally friendly
technologies.
Anti-Corruption
Principle 10: Businesses should work against corruption in all its forms, including extortion and bribery.
eventually lead to expulsion from the list of signatories (UNEP, GRI, KPMG and the Centre for Corporate Governance in Africa, 2013).
3.2.2 The Global Reporting Initiative (GRI)
The Global Reporting Initiative (GRI) was formed in 1997 by the UN Environmental
Program (UNEP) and several of its partners (Global Reporting Initiative, 2015) with the goal of developing a reporting standard for the “triple bottom line” (economic, environmental, and social performance) that would be on the same level as financial reporting (Serafeim & Ioannou, 2014). GRI has developed a framework of detailed reporting indicators to help reporters make valuable non-financial reports that matter to their key stakeholders (Global Reporting Initiative, 2013, s. 3). The idea behind GRI is that an internationally agreed upon framework for financial reporting will make abstract issues more tangible, enable non-financial reports to be accessible and comparable to key stakeholders, and encourage transparency and consistency that is required to make information useful (Global Reporting Initiative, 2013).
GRI launched their first version of the reporting standard in 2000, with the last iteration being released in 2013 which integrated the 10 UNGC Principles into the framework (Global Reporting Initiative, 2015). The framework is extensive with 150 indicators covering economic, environmental and social issues (Global Reporting Initiative, 2013). Companies using the framework are required to perform an analysis identifying the issues that are material to the company and its stakeholders, in order to reduce reporting volume and
increase relevance. In addition, companies can choose to be in accordance with only the core indicators, or the comprehensive list of indicators. All companies using the reporting standard must transition to the latest version (G4) by 31.12.2015 (Global Reporting Initiative, 2015). 3.3 Non-Financial Disclosure Regulation in Norway
The Scandinavian private sector is widely recognized for high quality corporate reporting (Serafeim & Ioannou, 2014) and corporate responsibility (Vormedal & Ruud, 2009). Still, studies show major shortcomings in compliance to non-financial reporting requirements (Olsen & Orderdalen, 2014; Vormedal & Ruud, 2009; Norwegian Ministry of Foreign
Affairs, 2009; EY, 2014; 2015), as well as a lack of understanding of the concept of CSR and little knowledge of international non-financial reporting standards (Norwegian Ministry of Foreign Affairs, 2009).
The well-known White Paper Corporate Social Responsibility in a Global Economy by the Norwegian Ministry of Foreign Affairs (2009) outlined global challenges and put CSR as a central tool for the international competitiveness of Norwegian companies. It discussed companies’ responsibility for the development of society in addition to traditional value creation. To develop and improve companies’ CSR practices the paper stated that systematic reporting was needed, but it was later acknowledged that it is difficult to find legal
mechanisms that directly effects the business sector’s awareness (Norwegian Ministry of Finance, 2012).
On the basis of the White Paper, the Norwegian Ministry of Finance proposed changes to the 1998 Accounting Act to add a requirement for large companies to report on how they
integrate respect for human rights, labor standards and working conditions, taking
environmental concerns into account and combating corruption. The existing law before the proposal required reporting on issues related to working conditions and gender
(non-)discrimination, and reporting on environmental issues was only required if the company had extensive impact on the environment (Norwegian Ministry of Finance, 2012). The
changes to the Accounting Act was put into effect on 1. January 2013 (§3-3, 2013).
One of the purposes of the broadening of the reporting requirements was that the committee claimed it should result in increased awareness and taking of social and environmental responsibility (Norwegian Ministry of Finance, 2012). To achieve this the committee noted that it was important that the reports includes more than just whether the companies have ethical guidelines or not. In essence the committee aimed at increasing openness in non-financial reporting.
Despite the regulator’s efforts to promote non-financial reporting, researchers claim that the government has failed to develop an adequate policy framework (Vormedal & Ruud, 2009) and that the regulations lack adequate guidelines for practical use (Olsen & Orderdalen, 2014).
The Norwegian law is made applicable for large companies according to the definition in the accounting law, covering public limited companies, listed companies, banks, financing companies and their parent companies. An exception is made for certain public companies. This resulted in around 450 companies being affected by the law in 2013. (Norwegian Ministry of Finance, 2012).
4 EXISTING RESEARCH
Several governments claim that increased transparency in and volume of non-financial disclosure will lead to better CSR related efforts (Norwegian Ministry of Foreign Affairs, 2009), and that this will increase the companies’ competitiveness and performance (European Commission, 2014; Erhvervs- og Selskabsstyrelsen, 2011).
This chapter will first explore the question; do such claims hold water? This is done by reviewing literature on several underlying questions; does CSR efforts increase corporate performance? Does reporting increase CSR efforts? And, does non-financial disclosure regulation improve reporting?
Secondly, this chapter will give a brief overview of research on non-financial reporting practice in Norway. The existing research done on these questions lays the foundation for this study, by outlining a possible link between transparency in non-financial reporting and
corporate performance, and by showing where more knowledge is needed in the Norwegian context.
4.1 Does CSR Increase Financial Performance?
Margolis and Walsh (2001) searched through thirty years of academic research to assess whether a positive link between social and financial performance exists. They found much research indicating a positive relationship, but raised methodological concerns regarding many of these studies. It is pointed out that few analyses give way for conclusions on causality, and the difficulty of finding valid measures of social performance is emphasized. Orlitzky et al. (2003) performed a quantitative and “more rigorous” (page 403) meta-analysis of 52 studies in this field. This was done in response to the research concluding that the evidence of a positive relationship between social and financial performance was too variable to draw general conclusions. The study found a positive correlation between social and financial performance, but also that mediating factors, such as reputation, were involved. Previous studies, including Margolis and Walsh (2001), were sharply rebutted by accounting a significant share of the variability in those studies to sampling and measurement errors. Carroll and Shabana (2010) also reviewed several of the many studies that have examined the relationship between CSR initiatives and firm performance. They found studies based on two different views of the relationships between CSR initiatives and firm performance; a narrow view looking for the direct links between CSR and financial performance (as in the Margolis
and Walsh study (2001)), such as direct cost savings or sales increases; and a broad view (as in the Orlitzky et al study (2003)) looking for both direct and indirect links between CSR initiatives and financial performance. The studies with the broader views found more positive relationships between CSR and firm performance through mediating variables, coming to the same conclusion as Orlitzky et al, that the important relationships between social or
environmental and financial performance are not direct. As companies, stakeholder needs, and contexts are very different, it is naturally expected that CSR is approached very differently by companies, and that they in return reap very different results. According to the review, CSR have four different effects on firm performance, and these will be discussed in turn below. 4.1.1 CSR’s Four Different Mediating Effects on Firm Performance
Some studies in the review by Carroll and Shabana (2010) found that CSR initiatives could reduce costs and risks for companies. Reduced operating costs could be obtained partly due to gaining tax benefits or avoiding strict regulations. Proactive engagement on environmental issues could also lower the cost of complying with new environmental regulations. Examples of lawsuits against firms with less than adequate standards in the value chains, showed that proactive engagement could reduce firm risk (ibid.).
CSR initiatives could also strengthen firm legitimacy and reputation, by demonstrating that the firms could meet diverse stakeholder needs. This is argued to strengthen brand loyalty and attract investments. This argument is further enhanced by Eccles et. al. (2006), stating that for example through active communication about a company’s internal control system, a
company can help establish and maintain a strong reputation. In one of the reviewed studies, consumers had explicitly claimed that their purchasing behavior had been influenced by CSR reputation of firms, showing the potential financial reward for firms (Carroll & Shabana, 2010).
Some firms may be able to build competitive advantage based on their CSR efforts, due to attracting more talented employees, gain customer loyalty, and obtaining better product differentiation (Carroll & Shabana, 2010).
By reconciling the differing stakeholder demands and creating win-win situations would also benefit firms financially. This could either be through finding opportunities to profitably satisfy stakeholders’ demands, or by gaining support from stakeholders through its CSR initiatives that allows the firm to pursue new profitable ventures. An example of the latter was the Novo Group that gained support for its business involving genetic modification, while
Monsanto experienced great consumer resistance for its business in a similar field (Carroll & Shabana, 2010).
The above meta-studies showed that finding valid measures for social performance may be difficult for researcher, which may help explain why managers find it difficult to explain the financial importance of sustainability issues or find useful information to back up such claims (Eccles & Serafeim, 2013). The latter two studies seem to agree that there exists a positive relationship between social and financial performance, but that the relationship is indirect. Later studies have further strengthened the above conclusion. Eccles, Ioannou and Serafeim (2014) found that companies that implemented sustainability policies (statistically)
significantly outperformed companies without such policies in the long-term. Khan et al (2015) found that companies with higher performance ratings on material issues outperformed companies with lower ratings. They also found that companies with higher performance ratings on immaterial issues did not outperform the companies with lower ratings on those issues.
4.2 Does Reporting on CSR Issues Lead to Better Performance on CSR Issues?
A performance-disclosure gap was found in one study (Font, Walmsley, Cogotti, McCombes, & Häusler, 2012), indicating that more reporting is not necessarily associated with better performance. On the other hand, this study only focused on the disclosure of policies and not on reporting of results or metrics. This can potentially conceal differences in management approach to CSR related issues.
Another study (Eccles & Serafeim, 2013) focused on the reporting of policies and results in integrated annual reports, and found a positive relationship between reporting on
environmental, social and governance issues and the score on indicators of quality of
management on these issues. Other studies have also found positive associations between the level of voluntary sustainability disclosure and environmental performance (Clarkson, Li, Richardson, & Vasvari, 2008) and commitment to stakeholders (Michelon, 2011)
4.3 Does Non-Financial Disclosure Regulations Improve Reporting? 4.3.1 Is Disclosure Volume Increased?
Studies of companies in China and South Africa have shown that regulations mandating disclosure of non-financial information increased the volume of non-financial information in
corporate reports (Serafeim & Ioannou, 2014). An important question then is; does increased volume of reports imply increased information quality? This question is not directly answered in the reviewed literature, but studies of the effects of non-financial disclosure regulation in Denmark suggest that increased volume was associated with increased reporting quality (Erhvervs- og Selskabsstyrelsen, 2013). Denmark also saw a significant, though expected increase in the number of first-time reporters on CSR-related issues. 43% of the reviewed companies published non-financial reports for the first time in the first year after the regulations (Neergaard & Pedersen, 2009).
4.3.2 Are Reports Compliant with Regulations?
A study of non-financial reporting in Norway before 2013 (Vormedal & Ruud, 2009) revealed that merely 10% of the reviewed companies complied with the regulations of non-financial reporting at the time. Studies of non-financial reporting in Denmark (Erhvervs- og
Selskabsstyrelsen, 2013) following the new regulations on non-financial reporting, found that 44% of the companies were compliant with the regulations. 97% of the reports in the Danish study included some information on the required issues, but all did not disclose information on each of the required dimensions. The staggering number of reports that were incompliant in both Norway and Denmark reveal important issues with the regulations themselves or with difficulties in the reporting process.
The low rate of full compliance could be a symptom of a lack of an adequate policy framework for responsibility and reporting, that media and society has not been enough involved in public scrutiny, or that the regulators insufficiently monitor compliance (Vormedal & Ruud, 2009).
4.3.3 Are Reports Using International Reporting Frameworks?
It is important to note the relevance of the absolute increase in number of reporters of non-financial information in Denmark. If non-non-financial information is to be useful to investors and other stakeholders, it must first be available. Secondly, disclosed information must also be comparable if it should be widely useful (Rea, 2014) (Eccles & Serafeim, 2013). As reporting frameworks are still being developed and varying in use, legislation has proven to work as an important driver for demand for the frameworks (Global Reporting Initiative, 2015), creating a virtuous circle of demand, feedback, and development.
reporting volume before the regulations, and one of the countries had an upswing in adoption of international reporting guidelines while the other saw increased use of CSR related
demands in the supply chain management. In the three consecutive studies in Denmark by Erhvervs- og Selskabsstyrelsen (2013) an increase in the number of signatories to the UN Global Compact and the use of GRI Reporting Guidelines was found. Still the numbers were relatively low, 20% were signatories to the UNGC and 25% used GRI in 2011.
4.3.4 Is Disclosure Transparent and Comparable?
Regarding the transparency of the reports, a good indicator would be if the reports included negative information about the firms’ performance. In the first year after the regulations in Denmark, no reports were found to include negative information, while 29% included such information two years later (Erhvervs- og Selskabsstyrelsen, 2013), indicating a substantial increase in disclosure transparency from the regulation. The researchers also noted in their analysis that 50% of the companies chose to be more transparent in 2010 than in 2009 (Erhvervs- og Selskabsstyrelsen, 2011). It is possible that in an environment where all companies hide information, it would be very damaging for the first companies to disclose negative information. When regulation mandates all large companies to disclose non-financial information, such an environment might change, like the studies seem to reveal in Denmark. The three studies from Erhvervsstyrelsen (2013) showed that quantitative indicators were used by 38% of the reviewed companies in 2009, and this number did not increase in the subsequent two years after the regulations. On the other hand, the share of these companies using the GRI guidelines increased significantly. This shows a relatively low transparency on actual performance (low usage of quantitative indicators), but an increasing comparability of the information from those who disclose such information (high usage of standardized reporting framework amongst those who use quantitative indicators).
4.4 What Is the State of Non-Financial Reporting in Norway? 4.4.1 Disclosure Volume and Quality
A EY study (2014) found a substantial increase in the number of CSR reports in the first year (2013) after the non-financial disclosure regulations took effect in Norway compared to the year before. EY found a significant improvement from 2012 to 2013 in the reporting on guidelines, a good improvement in reporting on implementation and results, and only marginal improvements in reporting on ambitions and expectations for the future. They did not find any increase in reporting volume in 2014 (EY, 2015). A PwC study (2015) of the 100
largest companies in Norway found that the quality of the reports varied a great deal, with 65 of the 100 companies being classified as low or mediocre on “reporting maturity” for the accounting year 2014. In sum, the three studies found a relatively low volume and quality of non-financial disclosure in Norway in and prior to 2014.
4.4.2 Compliance with Regulations
A study of non-financial reporting developments from 2012 to 2013 (Olsen & Orderdalen, 2014) showed that only 16% (5 companies in the sample) were compliant with the new regulations. In addition, two of these companies fulfilled the requirements by stating that they did not have any guidelines on the five dimensions of the Accounting Act § 3-3 c: human rights, labor rights and social conditions, the environment, anti-corruption. The study also noted that the only three companies that were fully compliant with the new regulations
(disclosed information on all dimensions), were also compliant in the year before the law took effect. These findings put the effects of the law into question, since the “good” reporters were already “good” before the regulations, and no other companies improved enough to comply with the new regulations in the first year. These findings support the findings of Vormedal and Ruud (2009) that found only 10% compliance rate before the new regulations.
PwC (2015) noted in a similar study for the accounting year 2014 that 43 of the 100 sampled companies in their study were affected by the Accounting Act § 3-3 c, but as many as 15 (35% of the affected companies) of them were completely lacking information on one or more of the categories required by the Act (human rights, labor rights and social conditions, the environment, anti-corruption). This means that at least 15% of the reviewed companies were not compliant with the regulations in 2014. In the EY (2015) study for the same year, 40% of the studied companies did not adequately report their guidelines on the four CSR dimensions in the law or how these were implemented, 46% did not adequately report results, and 60% did not report adequately on ambitions for future improvements. This result reveals that as many as 60% of the companies affected by the non-financial disclosure regulations may have not been compliant in 2014.
Despite the depressing results on compliance from the studies discussed above, the assurance statements attached to the reports still claimed that the reports were compliant (Olsen & Orderdalen, 2014).
Vormedal and Ruud (2009) point out that the Norwegian government has not further developed the disclosure requirements with an adequate policy framework or practical
guidance, and also lack in compliance monitoring. This fact is in contrast with Danish government’s quick publication of explanations and guidelines for their corresponding regulation (Olsen & Orderdalen, 2014), and gradually increasing compliance (Erhvervs- og Selskabsstyrelsen, 2013).
4.4.3 Disclosure Transparency and Comparability
PwC (2015) found that 51% referenced the GRI Guidelines, and also found that 44% of the companies had quantitative goals and KPIs, but it is unclear how many of these companies disclosed any of these quantitative results. Olsen and Orderdalen (2014) found that several companies in their sample were using standard phrases stating that the company did have guidelines for caring for the environment, and that they were integrated into all parts of the organization, but that later failed to describe how the guidelines were implemented and results. Only half the companies that stated that they had guidelines for the four categories included information on how these guidelines were implemented and results from this. In sum, there seems to be ample room for improvement on transparency in general and on quantitative indicators in particular.
5 METHODOLOGY
This chapter covers the methodological choices made in the study. In the first section, I will lay out the research design used in the study. Thereafter, I will discuss the sampling procedure used when choosing which companies to analyze. Third, I will discuss the data sources used. Finally, I will discuss the process and rules used for quantification of the data sources. 5.1 Research Design
5.1.1 Design choices
According to Ghauri & Grønhaug (2010, s. 56) research problems have different levels of structure depending on how well the problem is understood and the amount of flexibility the researcher needs in order to find an answer. While earlier research have indicated that finding valid measures for ESG performance is difficult (Margolis & Walsh, 2001), newer research have found that this is improving (Khan, Serafeim, & Yoon, 2015). Therefore, this study can take a more structured approach to the research problem using a variables from earlier research, and it may be appropriate with a descriptive research design (Grønhaug & Ghauri, 2010, s. 56).
This study will analyze written reports which mostly consists of qualitative textual data, as well as some quantitative data. The focus will be on a qualitative review of data in its natural context, and apply the transparency framework to give a score on how well each category and concept in the framework is covered in each of the non-financial reports.
By reviewing several non-financial reports and evaluating them from a transparency point of view, it might be revealed how well the reports fulfill the accounting law’s intention of providing “stock holders, customers and the society with better information on the company’s approach to CSR” (Norwegian Ministry of Foreign Affairs, 2009, p. 83, author's translation) The analytical process must handle the data in such a way that it is possible to draw
conclusions (Grønhaug & Ghauri, 2010). In this study, the purpose is not to develop new categories, but rather applying existing categories to the data. It is therefore important to create and follow specific procedures and rules when performing the review (Grønhaug & Ghauri, 2010). For each category the responses in the reports are given a score to
dimensionalize and give more meaning to the use of the categories (Grønhaug & Ghauri, 2010). This may also help identify how far the reports have to go in order to be sufficiently
5.1.2 Limits of design
Because this study uses a cross-sectional design it is only capable of giving a snapshot or the status quo of a few large companies’ reports. This limits the scope of conclusions that will be possible to draw based on the results. On the other hand, the study may have the potential to reveal to stakeholders the state of reporting of some of the largest companies in Norway. In this way, the study might provide insights on how much relevant and comparable information the companies provide to their shareholders, society and other stakeholders, compared to the other companies in the sample. By comparing the non-financial reports, it is also possible to get an indication of what information is left out.
This study will use a set of indicators based on an existing transparency index (Sustainability Data Transparency Index - SDTI (Rea, 2015)). By doing this, the study is relying on the validity and reliability of the concepts, factors and measures in the existing SDTI index. The SDTI has been peer-reviewed by industry actors and experts in South Africa (Rea, 2015), and I have therefore not attempted to reassess the SDTI’s validity claims. The current author acknowledges that future analyses invalidating certain aspects of the SDTI would undermine some of the theoretical foundation for this study.
5.1.3 Challenges: Objectivity, reliability and validity
To achieve a high level of objectivity in this study, I will try to avoid a more subjective scoring system. If I for example would give scores based on the underlying performance stated in the reports, I would not only risk being influenced by existing impressions of the companies, but would also give significant room for disagreement on the criteria for the scoring system. Comparison on the basis of “raw ratio scale data” (i.e. emissions of CO2
equivalents in absolute tons) can also be problematic, even though many reports contain such data and it allows for advanced statistical analysis (Grønhaug & Ghauri, 2010). The main issue is connected to what standard of comparison to use, and how to score a company’s emissions in relation to other companies. It is expected that CO2 emissions would vary
depending a number of factors, including company size, industry, and efficiency.
Trying to establish a common standard of comparison for all indicators in the framework would not be suitable within the limits of a master thesis. Therefore, the study will be focused on whether or not easily comparable information is present in the reports, rather than
evaluating the underlying performance. Evaluating the underlying performance would significantly increase the scope of the research, and therefore drastically reduce the possible
size of the sample and eliminating the usefulness of this report. The more “objective” way of scoring the information is intended to reduce the threat to internal validity caused by
subjective researcher bias, increasing confidence that the results given are indeed true (Grønhaug & Ghauri, 2010).
5.2 Research sample
From 2013 around 450 large companies in Norway have been required to publish a non-financial report (Norwegian Ministry of Finance, 2012). These reports must be sent to The Accounting Registry [Regnskapsregisteret] within one month of approval (§ 8-2 first section). The service Proff Forvalt (www.proff.no) provided a list the population of companies that fit the criteria of the law, and the public annual reports was found on the investor information pages of the sampled companies.
Since the population consists of around 450 companies, a review of a sample of 25 companies (>5% of the population) would be considered sufficient to be able to find characteristics regarding the population. This sample size would also be suitable in the master thesis format, given the time and resource constraints.
The method used to draw the sample from the population is called “systematic sampling” (Grønhaug & Ghauri, 2010). The aim is to draw a sample that is representative for the whole population, and this is done by sorting the population of companies by operating revenue and choosing every 18th company in the list to get a sample of 25. A successful sample draw should have a sufficient spread in operating revenue and represent as many of the
population’s industries as possible.
The sample is shown in Table 2 below. An asterisk (*) represent companies traded out of the sample for various reasons; # 1 Aker Contracting was traded because the company is a subsidiary of #17 Ocean Yield. #5 Cellcura was recently acquired and the annual report for 2014 was not made available at the time of data collection. #26 Voss of Norway did not have a publically available annual report for 2014 at the time of data collection.
A double asterisk (**) represent companies replacing the companies marked with a single asterisk (*). The companies removed from the sample were replaced by companies beneath them in the population list when sorted by company revenue.
Table 3 presents an overview of the industries represented in the sample, as well as the number of companies drawn from each industry. Since the intention of the sample drawing
many industries as possible, and each industry would be represented by few companies (low clustering).
Table 2 Sample with identifier and name of companies.
# Identifier Name Operating Revenue
* 1 989061879 AKER CONTRACTING FP ASA 116 565
2 886582412 AQUA BIO TECHNOLOGY ASA 22 461
3 914864445 BN BANK ASA 647 000 4 974442167 BOUVET ASA 1 132 598 * 5 980040461 CELLCURA ASA 4 356 6 921526121 DNO ASA 3 916 218 7 997639588 EUROPRIS ASA 4 258 837 8 934382404 EVRY ASA 12 773 000
9 982985110 FISH POOL ASA 12 992
10 987974532 GC RIEBER SHIPPING ASA 881 568
11 995568217 GJENSIDIGE FORSIKRING ASA 23 098 700
12 988247006 INTEROIL EXPLORATION AND PRODUCTION ASA 358 213
13 976605713 KITRON ASA 1 751 300
14 966011726 NORDIC SEMICONDUCTOR ASA 1 447 173
** 15 891797702 NORTH ENERGY ASA 3 493
16 864234232 NORWAY ROYAL SALMON ASA 2 599 799
17 991844562 OCEAN YIELD ASA 249 300
18 994051067 PANORO ENERGY ASA 0
19 916235291 PETROLEUM GEO-SERVICES ASA 1 454 000
20 915929265 Skiens Aktiemølle ASA 1 164
** 21 981363876 STATOIL KAPITALFORVALTNING ASA 114 685
22 916300484 STOREBRAND ASA 63 669 000
23 996162095 TARGOVAX ASA 72
24 916819927 TORGHATTEN ASA 8 187 448
25 986144706 VERDIBANKEN ASA 34 718
* 26 980067645 VOSS OF NORWAY ASA 336 888
27 817244742 Voss Veksel- og Landmandsbank ASA 93 225
** 28 981953134 ZALARIS ASA 326 145
Table 3 Distribution of companies in sample across industries
Industry Companies in
Sample Office administrative, office support and other business support activities 1
Electricity, gas, steam and hot water supply. 1
Wholesale trade (not motor vehicles) 2
Financial Service Activities 4
Insurance 1
Research and Development 2
Activities of head office and management consultancy 1
Real Estate activities 1
Manufacture of computer, electronic and optical products 2
Manufacture of food products 1
Technical testing and analysis 1
Administration of financial markets 2
Computer programming, consultancy and related activities 2
Extraction of crude petroleum and natural gas 2
Transporting and storage 2