Aus dem Institut f¨
ur Pflanzenbau und
Pflanzenz¨
uchtung II
der Justus-Liebig-Universit¨
at Gießen
Professur f¨
ur Biometrie und Populationsgenetik
Prof. Dr. Matthias Frisch
Prediction of hybrid performance in
maize with transcriptome data
Dissertation zur Erlangung des akademischen Grades eines
Doktors der Agrarwissenschaften
Dr. agr.
-im Fachbereich
Agrarwissenschaften, ¨
Okotrophologie und Umweltmanagement
der Justus-Liebig-Universit¨
at Gießen
vorgelegt von
Carola Zenke-Philippi
aus Korbach, Hessen
Gießen, im April 2017
Contents
1 General introduction 1
2 Prediction of hybrid performance in maize with a ridge
re-gression model employed to DNA markers and mRNA
tran-scription profiles 1 11
3 Transcriptome-based prediction of hybrid performance with
unbalanced data from a maize breeding programme 2 20
4 General discussion 28
5 Summary 39
6 Zusammenfassung 42
7 Literature 45
1Zenke-Philippi, C., A. Thiemann, F. Seifert, T. Schrag, A. E. Melchinger, S. Scholten, and M. Frisch (2016) Prediction of hybrid performance in maize with a ridge regression model employed to DNA markers and mRNA transcription profiles. BMC Genomics
17:262.
2Zenke-Philippi, C., M. Frisch, A. Thiemann, F. Seifert, T. Schrag, A. E. Melchinger, S. Scholten, and E. Herzog (2017) Transcriptome-based prediction of hybrid performance with unbalanced data from a maize breeding programme. BMC Genomics 17:262. Plant Breeding 136:331–337
Abbreviations
AFLP Amplified fragment length polymorphism BLUP best linear unbiased prediction
DNA desoxyribonucleic acid GCA general combining ability GDMC grain dry matter content GWP genome-wide prediction GY grain yield
LD linkage disequilibrium MAS marker-assisted selection mRNA messenger ribonucleic acid QTL quantitative trait locus
REML restricted maximum likelihood
RFLP restriction fragment length polymorphism RR-BLUP ridge regression BLUP
SCA specific combining ability SNP single nucleotide polymorphism SSR simple sequence repeat
General introduction
Chapter 1
General introduction
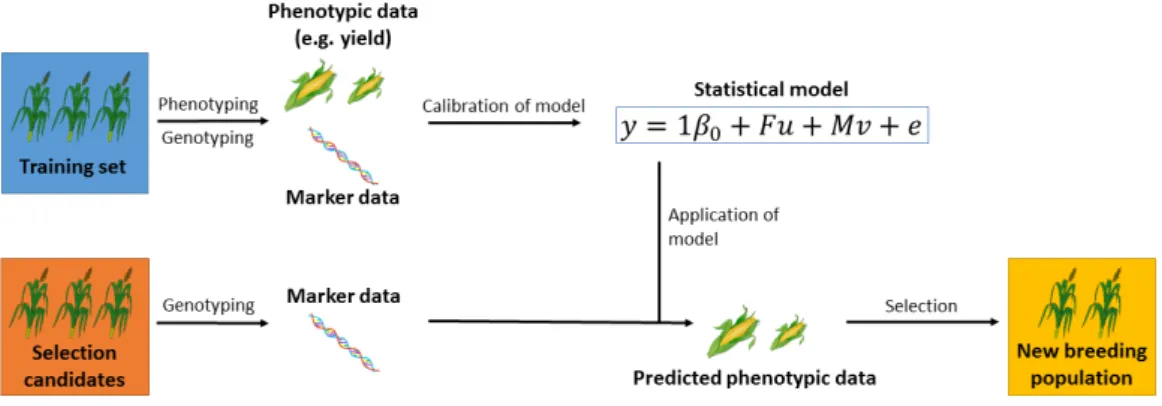
Since the beginning of hybrid production in maize (Shull 1908), a major focus of breeding programs has been to identify the most promising parental inbred lines from all breeding material available. This can be done by con-ducting field trials to generate phenotypic data and using relationship coef-ficients to predict the performance of untested lines or hybrids (Crossa et al. 2010). The doubled haploid technology enables breeders to create large num-bers of maize inbred lines very fast (Smith et al. 2008), exacerbating the question which of them should be tested in the field. With constant or even increasing phenotyping costs (Desta and Ortiz 2014) and steadily decreasing genotyping costs (Zhao et al. 2015), it suggests itself to use the genotype of a plant, which can be evaluated in a very early developmental stage, to predict its phenotype.
For prediction with genetic markers (Figure 1.1), genotypic and pheno-typic data are collected for a training population (training set). Marker effects are estimated with a statistical model to describe the relationship be-tween marker data and phenotype with genotypic data as predictors for the phenotype. The individuals of a new population (validation set) are then genotyped and the phenotypes are predicted with the model that was estab-lished previously. In an actual breeding program, promising genotypes would be selected based on these predictions. The importance of field trials for the
General introduction
Figure 1.1. Prediction of performance with genetic markers. Individuals
in the training set are genotyped and phenotyped. The phenotype ist linked to the genotype with a statistical model. The selection candidates are genotyped and their phenotype is predicted with this model. The best-performing individuals are then transferred to the next stage of the breeding program.
evaluation of genotypes is thereby expanded to updating the model used for prediction with genomic data.
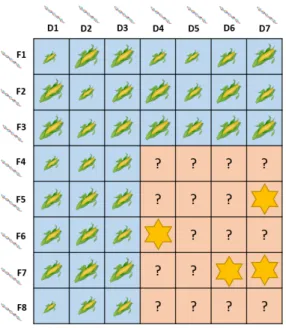
In the prediction of hybrid performance, not the hybrids themselves are genotyped but genotypic data are collected for the parental inbred lines in-stead. Testcrosses can then either be used to estimate general combining ability (GCA) and specific combining ability (SCA) of those inbred lines or hybrid performance can be targeted directly (Figure 1.2). For the latter ap-proach, parental lines from two distinct heterotic pools,e.g., Flint and Dent, are crossed, the phenotypes of the crosses are evaluated, and a statistical model links the parental genotypes to hybrid performance. Untested crosses can then be predicted from the parental genotypes and the most promising combinations can be tested in the field.
In order to evaluate the quality of the prediction, phenotypic data are also collected for the predicted individuals in the validation set and the correlation between these real phenotypic data and the predicted values is calculated.
General introduction
Figure 1.2. Example for hybrid prediction in a set of factorial crosses.
All inbred lines are genotyped. Hybrids from the training set (blue) are phenotyped and the statistical model is calibrated based on their perfor-mance. The performance of the hybrids in the validation set (orange) is then predicted based on the parental genotypes and the most promising hybrids (marked with stars) are selected for the next stage of the breeding program.
General introduction
This correlation is called prediction accuracy. In order to successfully iden-tify the most promising individuals, the prediction accuracy has to be as high as possible. It is dependent on the statistical model used for the predictions, on marker type and density, on sizes and compositions of the training and the validation set and their relatedness to one another, on heritability and genetic architecture, on gene effects, on extent and distribution of linkage disequilibrium (LD) between markers and quantitative trait loci (QTL) and on the trait to be predicted (Dan et al. 2016; Desta and Ortiz 2014; Wind-hausen et al. 2012). In my thesis, I focused on the importance of statistical models, markers types and densities, and the relatedness between training set and validation set for the accuracy of hybrid predictions.
Statistical models for hybrid prediction
Hybrids are created to exploit the heterosis that occurs if two sufficiently different inbred lines are crossed (Shull 1908). While the underlying genetic mechanism for heterosis is subject to an ongoing debate (cf. Chen 2013), heterotic traits are generally thought to be controlled by many loci, each with only a small effect on the target trait (infinitesimal model, cf. Lorenz et al. 2011). Researchers and breeders are therefore confronted with the sit-uation that the number of markersp(i.e., predictors) exceeds the number of genotypesn (i.e., observations) by far. This is a problem for common linear regression since it only allowsn−1 predictors in the model. Marker-assisted selection (MAS) emerged in the 1990s to identify markers with a significant influcence on the target trait (Lande and Thompson 1990). It aims to iden-tify relevant loci by investigating the association with the target trait. Only significant markers are selected. Since the selection of the significance thresh-old is arbitrary, MAS usually leads to the over-estimation of the effects of the selected markers while the influence of all other loci is neglected (Meuwissen et al. 2001). This is called the Beavis effect (Xu 2003). The underlying ge-netic architecture of polygenic traits like grain yield is therefore not captured
General introduction
very well by MAS. Under the infinitesimal model, statistical approaches are needed which include all markers in the model.
A different way of making use of marker information was proposed as GBLUP by Bernardo (1994) who used a relationship matrix estimated from genetic markers rather than from pedigree information like in best linear unbiased prediction (BLUP) as often used in animal breeding (Henderson 1975). Meuwissen et al. (2001) then suggested to estimate all marker effects simultaneously. A simple model for such an estimation is ridge regression BLUP (RR-BLUP). RR-BLUP uses a shrinkage factorλ to shrink all marker effects equally towards zero, assuming random marker effects drawn from a normal distribution with a common variance for all markers. This leads to homoscedastic marker variances (Meuwissen et al. 2001). Ifλ is set to error varianceσe/ genetic varianceσm at a marker m, the estimates of RR-BLUP
are equivalent to those obtained with GBLUP (De Vlaming and Groenen 2015). Variances can be estimated with the restricted maximum likelihood algorithm (REML).
Ridge regression is often criticized for its assumption of homoscedastic marker variances, reflecting a genetic architecture with genetic effects evenly spread throughout the genome. This would lead to reduced prediction ac-curacies for traits with genetic variance present at few and absent at many loci (Meuwissen et al. 2001). Bayesian models have been proposed to incor-porate heteroscedastic marker variances (Meuwissen et al. 2001). However, these methods suffer from their high computational demands (Lorenz et al. 2011) and pose the difficulty of choosing an appropriate prior distribution (Piepho 2009). Additionally, most studies with empirical data showed no significant improvement in prediction accuracy if heterocesdastic instead of homoscedastic marker variances were assumed (cf.Heslot et al. 2012; Wim-mer et al. 2013). Ridge regression is therefore often recommended for ge-nomic prediction since it is thought to be robust and reliable (Zhao et al. 2015). In addition, new ridge regression methods were developed recently which combine the lower computational demands of ridge regression
com-General introduction
pared to Bayesian methods with the possibility to include heteroscedastic marker variances (Shen et al. 2013; Hofheinz and Frisch 2014).
Hybrid prediction with ridge regression models has, for example, been done for maize (Technow et al. 2012; Massman et al. 2013; Zenke-Philippi et al. 2016), sunflower (Reif et al. 2013), barley (Philipp et al. 2016), sugar beet (W¨urschum et al. 2013) and wheat (Zhao et al. 2013c,b, 2014). How-ever, most studies focused on the prediction of testcross performance or crosses from biparental populations rather than on the prediction of fac-torial hybrids, e.g., in maize (Lorenzana and Bernardo 2009; Albrecht et al. 2011; Riedelsheimer et al. 2012; Windhausen et al. 2012; Zhao et al. 2012a; Riedelsheimer et al. 2013; Zhao et al. 2013a; Albrecht et al. 2014; Lehermeier et al. 2014), canola (Jan et al. 2016), rye (Wang et al. 2014; Auinger et al. 2016), and sugar beet (Hofheinz et al. 2012).
Alternative statistical methods for hybrid prediction in maize include partial least squares regression, support vector machine regression (Fu et al. 2012), and genetic distances. Genetic distances measure the difference be-tween two inbred lines based on their marker profile and aim to predict the performance of the resulting hybrid from this difference. The theoretical background of this approach is the notion that for heterosis to occur, a cer-tain level of genetic dissimilarity between the two parental lines is necessary and that the level of heterosis increases with increasing genetic distance be-tween the parental lines (Lanza et al. 1997; Marsan et al. 1998; Chen 2013). Genetic distances have been used for hybrid prediction since the advent of genetic markers, e.g., in oilseed rape (Diers et al. 1996), sorghum (Jordan et al. 2003), sunflower (Cheres et al. 2000), and maize (Lanza et al. 1997). In these studies, different genetic markers and different measures for the genetic distances were examined. In general, the achieved prediction accuracies were significant but not sufficient for reliable hybrid prediction.
Distance measures between parental lines can also be estimated from mRNA transcript abundance levels, i.e., expression levels of genes (Frisch
General introduction
et al. 2010). First, genes in which differential expression in the training set is associated with the target trait have to be identified. The binary distanceDB
between two inbred lines is then estimated from the number of these genes that are differentially expressed between the two lines. Only genes whose expression difference exceeds a certain threshold are included in the binary distance DB, but all those genes are then included with the same weight.
This corresponds well to the infinitesimal model (Frisch et al. 2010). Binary trancriptome-based distancesDB were well-suited to separate Dent and Flint
lines in two pools, so they were used as predictors for hybrid performance of a set of 98 factorial crosses in maize (Fu et al. 2012). They were inferior to multiple linear regression, partial least squares regression, and support vector machine regression for predicting grain yield of hybrids with testcross data for both parents but superior for the prediction of hybrids for which no parental testcross data were available (Fu et al. 2012). The question remained whether the method would perform equally well in larger factorials, and with fewer genes to select from. In my thesis, I addressed this issue as well as the question whether it would be possible to transfer a core set of genes for which differential expression was correlated with the trait of interest in one set of factorial crosses to another set of factorial crosses.
Hybrid prediction with genomic,
transcrip-tomic and metabolomic data
Genetic markers like restriction fragment length polymorphisms (RFLPs), amplified fragment length polymorphisms (AFLPs), simple sequence repeats (SSRs) or single nucleotide polymorphisms (SNPs) are the basis for hybrid prediction with RR-BLUP in which effects are estimated for each marker. Especially SNP markers have the advantage that they are relatively cheap and easy to generate with modern next-generation sequencing methods. In maize, a very high genome coverage can be achieved with the 600 k SNP chip (Unterseer et al. 2014).
General introduction
Since marker data seem to capture mainly relatedness between individu-als rather than additional information, metabolomic data have recently been used for hybrid prediction in maize (Riedelsheimer et al. 2012; Feher et al. 2014) and rice (Dan et al. 2016; Xu et al.). Genomic and metabolomic dis-tances were shown to be only weakly correlated, thus providing access to con-nected, but nevertheless different layers of infomation (Riedelsheimer et al. 2012). In a different statistical framework of prediction with support vec-tor machine regression, partial least squares regression, and distance-based methods, mRNA transcription profiles were identified as promising predic-tors for hybrid performance in maize (Frisch et al. 2010; Fu et al. 2012). Transcriptomic data are biologically located between genetic and metabolic information since they are the template for the translation of genes into pro-teins. Compared to genomic data, they have the advantage that they do not rely on LD between marker and gene and are therefore better suited for the prediction across heterotic pools (Frisch et al. 2010). The low corre-lation of transcriptome-based distances and genetic distances suggests that the mRNA expression profiles do indeed carry additional information (Frisch et al. 2010). Our goal was to investigate whether transcriptomic data can successfully be used for hybrid prediction in genomic selection models and, if so, if the number of data points required for a successful prediction is equal for mRNA transcription profiles and AFLP markers.
Evaluation of prediction accuracy
The prediction accuracy of a statistical model can be assessed with cross-validation (cf.Schrag et al. 2009) in which the data set is randomly divided into a training set and a validation set. The statistical model is calibrated based on the training set and phenotypic values are predicted for the valida-tion set. The correlavalida-tions between actual and predicted phenotypic perfor-mance of hybrids in the validation set are recorded as the prediction accu-racies. In order to account for random sampling effects, the cross-validation
General introduction
procedure is usually repeated many times. A different validation approach is validation with independent factorials (cf.Zenke-Philippi et al. 2017). Here, a whole factorial is used as the training set, and another factorial (or several others) as the validation set. This approach more closely resembles a situa-tion in which predicsitua-tions are made with data from previous breeding cycles and is therefore closer to reality: Genomic prediction is appealing because via genotyping the plants at an early developmental stage, generation intervals can be shortened tremendously. However, this application of genomic selec-tion can only be successful if phenotypic and genotypic data from previous generations can be used.
In hybrid prediction, division of the complete data set into training and validation set leads to different situations regarding the parents of a hybrid that is to be predicted: They can either both be included in the training set (type 2 hybrid), or only one parent is part of the training set but the other one is not (type 1 hybrid), or none of the parental lines is included in the training set (type 0 hybrid) (Fu et al. 2012). If the prediction accuracies for the hybrids are separated based on the hybrid type, it becomes apparent that type 2 hybrids can generally be predicted quite reliably, whereas the prediction of type 0 hybrids is challenging (Fu et al. 2012). Apparently, the prediction accuracy heavily depends on the genetic relatedness between the training and the validation set. Only if the validation set resembles the training set closely, high prediction accuracies can be achieved (Albrecht et al. 2014). This means that if the performance of a hybrid from two parental lines is to be predicted, it is crucial that either both parental lines or close relatives are included in the training set. It would therefore be of great interest to breeders if a method could be established that was able to also predict type 0 hybrids reliably.
General introduction
Objectives
The main goal of my thesis research was to investigate the efficiency of mRNA transcription profiles for hybrid prediction of maize in a data set originating from an ongoing maize breeding program. Specifically, my objectives were to:
(1) compare the prediction accuracy of AFLP markers with that of mRNA transcription profiles for hybrid prediction,
(2) investigate the number of mRNA transcripts required for accurate pre-diction,
(3) investigate the transferability of a core set of genes correlated to the trait of interest from one set of factorial crosses to another,
(4) compare prediction accuracy of transcriptome-based distances with ridge regression approaches, and
(5) compare the prediction accuracies of these methods with cross-validation vs. independent cross-validation.
Chapter 2
Prediction of hybrid
performance in maize with a
ridge regression model
employed to DNA markers and
mRNA transcription profiles
1
1Zenke-Philippi, C., A. Thiemann, F. Seifert, T. Schrag, A. E. Melchinger, S. Scholten, and M. Frisch (2016) Prediction of hybrid performance in maize with a ridge regression model employed to DNA markers and mRNA transcription profiles. BMC Genomics
Zenke-Philippiet al. BMC Genomics (2016) 17:262
DOI 10.1186/s12864-016-2580-y
R E S E A R C H A R T I C L E Open Access
Prediction of hybrid performance in maize
with a ridge regression model employed to
DNA markers and mRNA transcription profiles
Carola Zenke-Philippi1, Alexander Thiemann2, Felix Seifert2, Tobias Schrag3, Albrecht E. Melchinger3, Stefan Scholten2,3and Matthias Frisch1*Abstract
Background: Ridge regression models can be used for predicting heterosis and hybrid performance. Their application to mRNA transcription profiles has not yet been investigated. Our objective was to compare the prediction accuracy of models employing mRNA transcription profiles with that of models employing genome-wide markers using a data set of 98 maize hybrids from a breeding program.
Results: We predicted hybrid performance and mid-parent heterosis for grain yield and grain dry matter content and employed cross validation to assess the prediction accuracy. Prediction with a ridge regression model using random effects for mRNA transcription profiles resulted in similar prediction accuracies than employing the model to DNA markers. For hybrids, of which none of the parental inbred lines was part of the training set, the ridge regression model did not reach the prediction accuracy that was obtained with a model using transcriptome-based distances.
Conclusion: We conclude that mRNA transcription profiles are a promising alternative to DNA markers for hybrid prediction, but further studies with larger data sets are required to investigate the superiority of alternative prediction models.
Background
The resources for field trials in a hybrid breeding program are restricted and only a fraction of all possible hybrids that could potentially be generated by crossing the inbred lines developed in each cycle of the breeding program can be phenotypically evaluated. The principle of hybrid prediction is to link the performance of phenotypically evaluated hybrids to predictors, such as DNA markers or mRNA transcription profiles, that can be assessed in the parental lines of the hybrids. For each state of the predictor, its effect on the phenotype is estimated and these effects are then used to predict the performance of new hybrids.
DNA markers were employed for hybrid prediction in maize and proved to be superior to prediction approaches based solely on pedigree and phenotypic data [1–5]. First
*Correspondence: [email protected]
1Institute of Agronomy and Plant Breeding II, Justus Liebig University, 35392 Giessen, Germany
Full list of author information is available at the end of the article
results on using the mRNA transcriptome for hybrid pre-diction with distance-based approaches [6] or regression-based approaches [7] showed promising results. Genome-wide prediction of general combining ability (GCA) or testcross performance [8–10] can be regarded as a special case of hybrid prediction where one parental component (the tester) is known and the effects of the predictors assessed at the second parental component are used for hybrid prediction. In this context, first results of using metabolites as predictors were successful [10] but showed a lower prediction accuracy than using SNP markers as predictors.
Two important situations can be distinguished in hybrid prediction. The first is that the parental lines of a poten-tial hybrid have already been evaluated for testcross performance with other lines of the breeding pool. If such testcross data are available for both parental lines but the hybrid itself is not yet generated, then we refer to the hybrid as type 2 hybrid (testcross data for two par-ents available). The second situation is that the parental
© 2016 Zenke-Philippi et al.Open AccessThis article is distributed under the terms of the Creative Commons Attribution 4.0 International License (http://creativecommons.org/licenses/by/4.0/), which permits unrestricted use, distribution, and reproduction in any medium, provided you give appropriate credit to the original author(s) and the source, provide a link to the Creative Commons license, and indicate if changes were made. The Creative Commons Public Domain Dedication waiver (http://creativecommons.org/publicdomain/zero/1.0/) applies to the data made available in this article, unless otherwise stated.
Zenke-Philippiet al. BMC Genomics (2016) 17:262 Page 2 of 8
lines are entirely new and have not yet been evalu-ated in any test cross. Such hybrids are referred to as type 0 hybrids (testcross data for none of the parents available). The application of ridge regression models in combination with mRNA transcription profiles for the prediction of type 0 and type 2 hybrids has not yet been investigated.
The goal of our study was to investigate the prediction of grain yield and grain dry matter content using field data of 98 maize hybrids and AFLP (amplified fragment length polymorphism) marker data as well as mRNA transcrip-tion profiles of their 21 parental lines. In particular, our objectives were to (1) assess the accuracy of predicting hybrid performance with a random effects model using mRNA transcription profiles, (2) investigate the num-ber of mRNA transcripts that are required for precise hybrid prediction, (3) compare the prediction accuracy of a random model employing mRNA with the predic-tion accuracy obtained with AFLP markers as well as the prediction accuracy of previously published approaches, and (4) draw conclusions on possible application in breed-ing programs for prediction of hybrid performance and heterosis of type 2 and type 0 hybrids.
Methods
Field data
The field data were presented in detail by [11], where the factorial we used for the present study was referred to as Experiment 1. Here we give only a brief overview. Seven flint and 14 dent elite inbreds developed in the maize breeding program of the University of Hohenheim were used as parental inbreds for 98=7×14 factorial crosses between both groups of inbreds. The inbreds comprised eight dent lines with Iowa Stiff Stalk Synthetic background and six with Iodent background. Four flint lines had a European Flint background and three a Flint/Lancaster background.
The factorial crosses were evaluated in 2002 at six agroecologically diverse locations in Germany (Bad Krozingen, Eckartsweier, Hohenheim, Landau, Sunching, Vechta). The trials were evaluated in two-row plots using
αdesigns with two to three replications. Hybrid perfor-mance for grain yield was assessed in Mg ha−1adjusted to 155 g kg−1grain moisture and for grain dry matter
con-tent in percent. The mean hybrid performance for grain yield was 11.72 Mg ha−1and for grain dry matter content
67.7 % with broad sense heritabilities of 0.80 (grain yield) and 0.91 (grain dry matter content). The GCA (general combining ability) and SCA (specific combining ability) variance components as well as their interactions with the locations were significantly different from zero (α = 0.05) for both traits. The ratios of SCA:GCA variance components were 1.12 (grain yield) and 0.42 (grain dry matter content).
AFLP marker data
The inbred lines were assayed for AFLP markers with 20 primer combinations as described in detail by [11]. After removing markers with more than 10 % missing values and a gene diversity smaller than 0.2 the number of 970 high quality markers remained for the analysis.
Gene expression data
Five seedlings of each of the 21 diverse dent and flint maize inbred lines were grown for seven days under controlled conditions (25 °C 16 h day, 21 °C 8 h night, 70 % air humidity). Whole seedling tissue of five biological replicates was frozen in liquid nitrogen, homog-enized, and pooled before target labeling and hybridiza-tion. Total RNA was isolated, precipitated with LiCl (8M) and purified with the “NucleoSpin RNA Clean-up Kit” (Macherey-Nagel, Düren, Germany) and used to synthesize aminoallyl-labeled RNA (aaRNA) following the “Amino Allyl MessageAmp aRNA” System protocol (Applied Biosystems/Ambion, Austin, USA). aaRNA was coupled with fluorescence dyes Cy3 or Cy5 (GE Health-care, Chalfont St. Giles, UK) and purified with RNeasy MinElute Kit (Qiagen, Hilden, Germany). The 46k array from the maize oligonucleotide array project [12], GEO platform GPL6438 was hybridized according to the man-ufacturer instructions. The micro-arrays were scanned (AppliedPrecision ArrayWorx Scanner, Applied Precision Inc., USA) and data was evaluated using GenePix Pro 4.0 (Molecular Devices, Sunnyvale, USA). For the micro-array experiment, an interwoven loop design [13] was applied. It resulted in 63 hybridizations of dent and flint lines by sampling each dent line five times and each flint line eight times.
For experimental validation of the micro-array exper-iment, two genes in eight different lines were evaluated by Quantitative RT-PCR, essentially in accordance with the micro-array data. For the validation of micro-array expression pattern copy DNA from total RNA of the inbred lines S028, F047, L024, S058, S044, PO33, L043, and F039 was produced with Superscript II (Thermo Fisher Scientific) according to the manufacturer’s proto-col. Quantitative RT-PCR was conducted for the genes GRMZM2G057829, GRMZM2G021406 and the actin gene (accession number JO1238) with the primer pairs 5-‘GAAACCATAACAGACGCGTCATCACATC-3‘/5‘-CAGCAGGAGCAGAAGAGGGAAAAG-3‘, 5‘-TAGGC TGCTATTTGGGCACTTAGTTTTAC-3‘/5‘-CCAGTAC GGGAGACATGTAGAGTTC-3‘, and 5‘-TCCTGACACT GAAGTACCCGATTGA-3‘/5‘-CGTTGTAGAAGGTGT GATGCCAGTT-3‘, respectively, with the iCycler iQ (BIORAD, Germany) and the qPCR MasterMix Plus for SYBR Green I (Reference: RT-SN2X- 03 + NRFL, Euro-gentec, Seraing, Belgium) in triplicates. Actin expression values were used for data normalization before relative
Zenke-Philippiet al. BMC Genomics (2016) 17:262 Page 3 of 8
expression levels between lines were calculated. The micro-array data have been deposited in Gene Expression Omnibus (GEO) under the series accession GSE17754.
The gene-oriented probes together with spike-in probes were tested for statistically significant differential expres-sion across all comparisons with a moderated F-test and subsequently with a nested F-test for each comparison of parental lines. Thelimmapackage [14] was applied for the tests. A false discovery rate [15] of 0.01 for all genes showing a fold change of at least 1.3 and log-2 expres-sion intensity of at least 8 was used to detect significant differential expression between inbred lines [16]. In total, 10,810 genes were differentially expressed in at least one pair of parental lines of the factorial crosses. We refer to this set of predictors as ‘mRNA10k’, random samples of 1000 out of the 10,810 genes are referred to as ‘mRNAr1k’.
Prediction model
To estimate the predictor effects, we used a linear model that relates the phenotype of a hybrid to the marker geno-type or mRNA transcription profiles that were observed in the two parental lines of the hybrid:
y=1β0+Fu+Mv+e (1) uj∼N 0,σf2 vj∼N 0,σm2 ei∼N 0,σe2
yis the response vector consisting of the hybrid perfor-mance of thei=1. . .nhybrids,1is a vector of 1’s, and
β0a fixed intercept.uandvare the vectors of the genetic
effects of thej=1. . .ppredictors in the female and male parent, respectively. The design matricesFandMconsist of valuesfi,jandmi,jthat code the observation of thejth
predictor at theith hybrid. For marker data,fi,jormi,jis
1 if the AFLP band was observed in a parent and 0 oth-erwise. For mRNA, the design matrices contain the gene expression of genejin the parents of theith hybrid, the columns of the design matricesFandMwere normalized. ForFthe normalization was carried out according to
fi,j= oi,j max k∈{1...s} ok,j (2)
whereoi,j are non-normalized original values for gene
expression, andsis the number of parental lines used as female parents. ForMthe normalization was carried out analogously.
The variances σˆf2, σˆm2, and σˆe2 were estimated by
restricted maximum likelihood (REML). Then the effects
ˆ
u and vˆ were obtained by solving the mixed model equations [17].
With this model the genotypic value of hybrids can be predicted as
ˆ
y=1μ+Fuˆ+Mvˆ (3)
whereFandMare the design matrices for the predictors observed at the parental lines of the hybrid. The GCA of inbred lines can be predicted as
ˆ
gf=Fuˆ or gˆm=Mvˆ (4)
Assessment of prediction accuracy
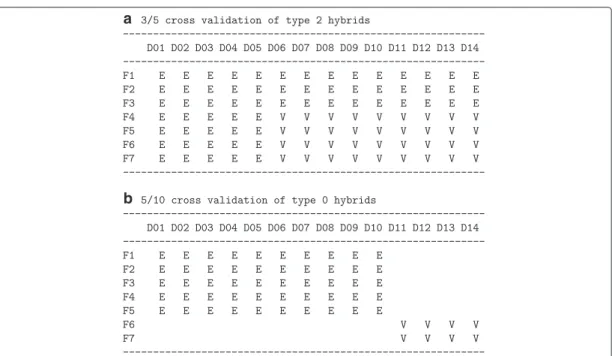
The prediction accuracy for type 2 hybrids was evaluated with the cross-validation procedure of [3]. The estimation set consisted of the marker or mRNA data of three ran-domly chosen flint and five ranran-domly chosen dent lines and the field data of their hybrids, and the validation set consisted of the remaining hybrids of the 7×14 factorial. Both parental lines of an untested hybrid in the validation set are also parents of hybrids belonging to the estimation set. Hence, testcross data are available for both parental lines of a hybrid. The principle is illustrated in Fig. 1a.
For type 0 hybrids, the estimation set consisted of five randomly chosen flint lines and ten randomly chosen dent lines and their hybrids. The validation set consisted of the hybrids of the remaining two flint and four dent lines of the 7×14 factorial. Hence, testcross data were not available for any of the two parental lines of a hybrid (Fig. 1b).
For each prediction model to be evaluated, cross-validation was carried out for 1000 runs. In each run the correlationr(y,yˆ)between the predicted and the observed hybrid yield and the average prediction error|ˆyi−yi|/n
was assessed. The distribution of these measures over the 1000 replications was then used to compare the prediction models.
Results
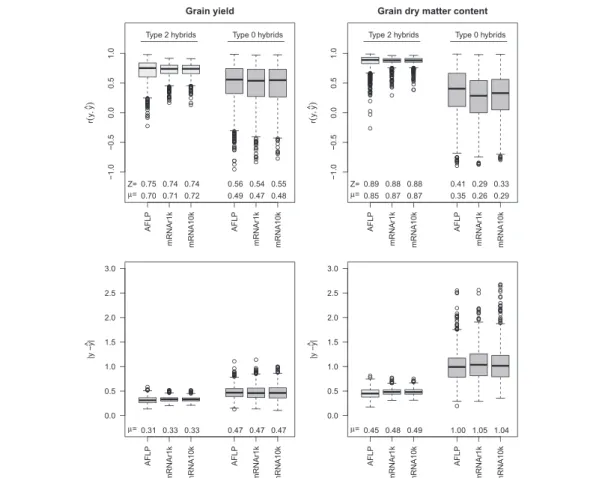
For prediction of hybrid performance, the median of the correlationsr(y,yˆ)between observed and predicted val-ues in cross validation with type 2 hybrids was between 0.74 and 0.75 for grain yield and between 0.88 and 0.99 for grain dry matter content (Fig. 2). The differences in the median of the correlation between prediction with AFLPs, with all 10k mRNAs (mRNA10k), and with ran-dom samples of 1k out of the 10k mRNAs (mRNAr1k) were negligible. Prediction with mRNAs had a slightly smaller variation around the median than prediction with AFLPs. The average absolute prediction errors|y− ˆy|had about the same sizes for prediction with AFLPs, all 10k mRNAs and random samples of 1k out of the 10k mRNAs. For type 0 hybrids, the correlations between observed and predicted hybrid performance for both traits were lower than for type 2 hybrids. The median of the corre-lations in cross validation was between 0.54 and 0.56 for grain yield and between 0.29 and 0.41 for grain dry matter content. Differences in the median between the predic-tor sets AFLP, mRNA10k, and mRNAr1k were small. The ranges of the correlations were very large, and in some
Zenke-Philippiet al. BMC Genomics (2016) 17:262 Page 4 of 8
Fig. 1Cross validation schemes.aEvaluation of prediction accuracy for untested hybrids in an incomplete factorial. The hybrids in the validation set are of type 2.bEvaluation of prediction accuracy for hybrids derived from parental lines of which no testcross data are available. The hybrids in the validation set are of type 0. D01–D14: parental dent lines in random order, F01–F07: parental flint lines in random order, E: hybrids of the estimation set, V: hybrids of the validation set
cross validation runs, even large negative correlations were observed. The average absolute prediction errors were greater than for type 2 hybrids and showed similar values for AFLPs and mRNA.
For prediction of mid-parent heterosis, the median of
r(y,ˆy) with type 2 hybrids was between 0.81 and 0.82 for grain yield and between 0.90 and 0.91 for grain dry matter content (Fig. 3). The differences between the pre-dictor sets AFLP, mRNA10k, mRNAr1k were negligible. The average absolute prediction error|y−ˆy|had about the same sizes for the three predictor sets.
For type 0 hybrids, the correlations between observed and predicted mid-parent heterosis were between 0.26 and 0.4 for grain yield. For grain dry matter content no correlation between observed and predicted values in cross validation was observed.
In additional analyses we investigated the effect of fur-ther reducing the number of predictor variables below 1000. A decline of the prediction accuracy was observed for both traits (results not shown), which is in line with the results of [6].
We further investigated a ridge regression model in which we included 1000 random mRNAs and in addition the AFLP markers as predictors. We found no situation where combining the predictor sets resulted in a greater
prediction accuracy than using them individually (results not shown).
Discussion
Properties of the linear model
In a simple GCA/SCA modelyfmr=μ+gf+gm+sfm+
efmrthe performance of therth replication of a hybrid is
denoted byyfmr. Factorsgfandgmdescribe the GCA
val-ues of the parental lines, andsfmis the SCA of the cross.
In the linear model of Eq. 1, the GCA values are split into components that can be assigned to individual predictors,
Fvsplits upgfandMusplits upgm.
Heterosis, and in consequence high hybrid perfor-mance, can be explained by dominant gene action at a large number of loci. Therefore, it is essential that mod-els that attempt to predict hybrid performance include the effect of dominant gene action. Theujandvjin Eq. 1 can
be interpreted in the sense of average effects (using the terminology of [18] p. 112ff ) of the corresponding predic-tors. Average effects cover the effectaof additive gene action, and in addition they partially cover the effectdof dominant gene action (cf. Eq. 7.4a and 7.4b of [18], p. 113). The amount of the dominant gene action that is captured depends on the differences in the allele frequencies, and takes its minimum of zero for allele frequencies of 1/2. We
Zenke-Philippiet al. BMC Genomics (2016) 17:262 Page 5 of 8
Fig. 2Prediction accuracy for hybrid performance of type 2 hybrids (left, in light gray) and type 0 hybrids (right, in dark gray). Correlationsr(y,yˆ)
between observed and predicted grain yield and grain dry matter content, and average absolute prediction error|y− ˆy|for the predictor sets AFLP (970 AFLP markers), mRNAr1k (1000 random mRNA transcripts), mRNA10k (10,810 mRNA transcripts). The boxplots show the distributions for 1000 cross validation runs,μare the arithmetic means andZthe medians
hypothesize, that the differences in the allele frequencies in the heterotic pools of our factorial are so large that the average values include to a large extend the effect of domi-nant gene action. This is supported by the high prediction accuracies observed.
The SCA is neglected in Eq. 1. Extensions that include the SCA are straightforward from a formal point of view (Eq. 4 in [4]). The dissection of the SCA into components that can be assigned to individual predictors results in effects that can be interpreted in the sense of dominance deviations (cf. Table 7.3 of [18], p. 118). Dominance devia-tions cover the residual part of the effect of dominant gene actiond, that is not covered by the average effects. Sim-ulations have shown that the gain in prediction accuracy of models that include dominance deviations is small for divergent heterotic pools [4], because the major part of the
effect of dominant gene actiondis already covered by the average effects.
It remains open, and requires the analysis of further experimental data sets, whether including SCA in pre-diction models can actually improve hybrid prepre-diction. In the data set investigated here, the high correlations of up tor(y,ˆy) = 0.9 between observations and predic-tions leave only little room for improving the GCA-based approach.
Prediction accuracy compared with older approaches
In earlier investigations on marker-based [11] and transcriptome-based [6, 7] prediction of hybrid perfor-mance, we used the same set of hybrids as here. This allows a direct comparison of the accuracy of the different prediction methods.
Zenke-Philippiet al. BMC Genomics (2016) 17:262 Page 6 of 8
Fig. 3Prediction accuracy for mid-parent heterosis of type 2 hybrids (left, in light gray) and type 0 hybrids (right, in dark gray). Correlationsr(y,yˆ)
between observed and predicted grain yield and grain dry matter content, and average absolute prediction error|y− ˆy|for the predictor sets AFLP (970 AFLP markers), mRNAr1k (1000 random mRNA transcripts), mRNA10k (10,810 mRNA transcripts). The boxplots show the distributions for 1000 cross validation runs,μare the arithmetic means andZthe medians
In the SM-TEAM approach of [11], first all markers are tested for association with the target trait and then a fixed linear model for the selected markers is fitted. This proce-dure is in analogy to the QTL-mapping approach, whereas a random model in which all markers remain (Eq. 1) can be regarded as a genome-wide prediction approach, as employed in recent studies on genomic selection. Hence, the theoretical advantages of the genome-wide prediction model, such as less bias in the effect estimates, should result in better statistical properties of the approach pre-sented here compared with the approach of [11]. The correlation between predicted and observed hybrid per-formance for grain yield of type 2 hybrids obtained by the SM-TEAM approach was 0.65 (Figure 6 in [6]). The random effects model with AFLPs had a median of the correlation of 0.75 (Fig. 2). In consequence, with the
present factorial, the ridge regression model applied to DNA marker data had a greater prediction accuracy than the earlier SM-TEAM model.
Transcriptome-based distances reached a prediction accuracy of about 0.8 for hybrid performance and mid parent heterosis of grain yield in type 2 hybrids (Figure 6 in [6]). This value is similar to the prediction accu-racy reached by the ridge regression model (Fig. 3) for mid-parent heterosis. However, for hybrid performance, the ridge regression model showed only a correlation of 0.75 (Fig. 2), and, hence could not reach the prediction accuracies of the transcriptome-based distance model.
For prediction of hybrid performance for grain yield of type 0 hybrids, the transcriptome-based distances reached a median of the correlation between observations and pre-dictions of 0.7 (Figure 3 in [7]). This was considerably
Zenke-Philippiet al. BMC Genomics (2016) 17:262 Page 7 of 8
greater than the regression-based methods investigated in [7]. For the ridge regression model, a median of the corre-lation of about 0.55 was reached (Fig. 2). In consequence, for the prediction of type 0 hybrids the transcriptome-based distance model, which employs marker selection, resulted in considerably better predictions than the ridge regression model of this study.
Application in breeding programs
For application of hybrid prediction in breeding programs, it is of central importance that a prediction approach pro-vides a sufficiently high prediction accuracy. For indirect selection approaches, a correlation of 0.7 to 0.9 between the trait for which selection is carried out and the target trait is usually regarded as highly promising and applica-ble in practice. Hence, the prediction accuracies for type 2 observed in this study can be regarded as suitable for practical applications.
The prediction accuracy of employing the ridge regres-sion model to mRNAs was comparable to that obtained with AFLP markers in the investigated data set. The accu-racies for prediction of grain yield and grain dry matter content in type 2 hybrids (Figs. 2 and 3) which were achieved with mRNA data suggest than mRNA can be an alternative to DNA markers in hybrid prediction.
The number of mRNAs required for a high prediction accuracy plays a central role for the costs of assess-ing the transcription profiles of selection candidates. For both traits and for both types of hybrids, the differences between using 1000 randomly chosen mRNAs or 10,000 mRNAs were negligible. This indicates, that high num-bers of mRNA are not necessarily required for hybrid prediction, and that transcription profiling with limited resources might result in prediction accuracies that can be successfully used for indirect selection.
The ridge regression model employed in this study was in summary more precise than the older SM-TEAM pre-diction model. However it was not superior to the tran-scriptome based distances suggested by [6]. In particular for prediction of type 0 hybrids, the transcriptome-based distances might be the more promising approach. Further studies with larger data sets are required to verify these trends.
Conclusions
Hybrid prediction has the potential to greatly enhance the efficiency of hybrid breeding. In maize breeding, the doubled haploid technology can generate large numbers of candidate lines that surpass the field capacity by far. Thus, reliable hybrid prediction can be used to increase the selection intensity and hence the response to selection. The data structure of the factorial used in this study is typical for testing experimental hybrids in late stages of a maize hybrid breeding program, and hence the successful
application of hybrid prediction with mRNA and ridge regression prediction models can be also expected with other data sets of similar genetic structure.
Abbreviations
AFLP: amplified fragment length polymorphism; GCA: general combining ability; SCA: specific combining ability.
Competing interests
The authors declare that they have no competing interests. Authors’ contributions
TS collected and analyzed the field data, AT, FS, SS collected the mRNA data, CZP carried out the predictions, AEM, MF, SS conceived the study, CZP, MF wrote the manuscript. All authors read and approved the final manuscript. Acknowledgments
This research was funded by the Deutsche Forschungsgemeinschaft (grants no. FR 1615/4-1, ME 2260/5-1, SCHO 764/6-1).
Author details
1Institute of Agronomy and Plant Breeding II, Justus Liebig University, 35392 Giessen, Germany.2Biocenter Klein Flottbek, Developmental Biology and Biotechnology, University of Hamburg, 22609 Hamburg, Germany.3Institute of Plant Breeding, Seed Science, and Population Genetics, University of Hohenheim, 70593 Stuttgart, Germany.
Received: 27 August 2015 Accepted: 8 March 2016
References
1. Bernardo R. Prediction of maize single-cross performance using RFLPs and information from related hybrids. Crop Sci. 1994;34:20–5. 2. Vuylsteke M, Kuiper M, Stam P. Chromosomal regions involved in hybrid
performance and heterosis: Their AFLP-based identification and practical use in prediction models. Heredity. 2000;85:208–18.
3. Schrag TA, Möhring JM, Maurer HP, Dhillon BS, Melchinger AE, Piepho HP, Sorensen AP, Frisch M. Molecular marker-based prediction of hybrid performance in maize using unbalanced data from multiple experiments with factorial crosses. Theor Appl Genet. 2009;118:741–51.
4. Technow F, Riedelsheimer C, Schrag TA, Melchinger AE. Genomic prediction of hybrid performance in maize with models incorporating dominance and population specific marker effects. Theor Appl Genet. 2012;125:1181–1194.
5. Massman JM, Gordillo A, Lorenzana RE, Bernardo R. Genomewide predictions from maize single-cross data. Theor Appl Genet. 2013;126: 13–22.
6. Frisch M, Thiemann A, Fu J, Schrag T, Scholten S, Melchinger AE. Transcriptome-based distance measures for grouping of germplasm and prediction of hybrid performance in maize. Theor Appl Genet. 2010;120: 441–50.
7. Fu J, Falke KC, Thiemann A, Schrag TA, Melchinger AE, Scholten S, Frisch M. Partial least squares regression, support vector machine regression, and transcriptome-based distances for prediction of maize hybrid performance with gene expression data. Theor Appl Genet. 2012;124:825–33.
8. Albrecht T, Wimmer V, Auinger HJ, Erbe M, Knaak C, Ouzunova M, Simianer H, Schön CC. Genome-based prediction of testcross values in maize. Theor Appl Genet. 2011;123:339–50.
9. Hofheinz N, Borchardt D, Weissleder K, Frisch M. Genome-based prediction of test cross performance in two subsequent breeding cycles. Theor Appl Genet. 2012;125:1639–45.
10. Riedelsheimer C, Czedik-Eysenberg A, Grieder C, Lisec J, Technow F, Sulpice R, Altmann T, Stitt M, Willmitzer L, Melchinger AE. Genomic and metabolic prediction of complex heterotic traits in hybrid maize. Nat Genet. 2012;44:217–20.
11. Schrag TA, Melchinger AE, Sorensen AP, Frisch M. Prediction of single-cross hybrid performance for grain yield and grain dry matter content in maize using AFLP markers associated with QTL. Theor Appl Genet. 2006;113:1037–47.
Zenke-Philippiet al. BMC Genomics (2016) 17:262 Page 8 of 8
12. Gardiner JM, Buell CR, Elumalai R, Galbraith DW, Henderson DA, Iniguez AL, Kaeppler SM, Kim JJ, Liu J, Smith A, Zheng L, Chandler VL. Design, production, and utilization of long oligonucleotide microarrays for expression analysis in maize. Maydica. 2005;50:425–35. 13. Kerr MK, Churchill GA. Experimental design for gene expression
microarrays. Biostatistics. 2001;2:183–201.
14. Smyth GK. Linear models and empirical bayes methods for assessing differential expression in microarray experiments. Stat Appl Genet Mol Biol. 2004;3:3.
15. Benjamini Y, Hochberg Y. Controlling the false discovery rate: a practical and powerful approach to multiple testing. J R Stat Soc Ser B. 1995;57: 289–300.
16. Fu J, Thieman A, Schrag TA, Melchinger AE, Scholten S, Frisch M. Dissecting grain yield pathways and their interactions to grain dry matter content through a two-step correlation approach with maize seedling transcriptome. BMC Plant Biol. 2010;10:63.
17. Henderson CR. Applications of Linear Models in Animal Breeding. Guelph, Canada: University of Guelph; 1984.
18. Falconer DS, Mackay TFC. Introduction to Quantitative Genetics. Harlow Essex UK: Longman Group; 1996.
• We accept pre-submission inquiries
• Our selector tool helps you to find the most relevant journal • We provide round the clock customer support
• Convenient online submission • Thorough peer review
• Inclusion in PubMed and all major indexing services • Maximum visibility for your research
Submit your manuscript at www.biomedcentral.com/submit
Submit your next manuscript to BioMed Central and we will help you at every step:
Chapter 3
Transcriptome-based prediction
of hybrid performance with
unbalanced data from a maize
breeding programme
1
1Zenke-Philippi, C., M. Frisch, A. Thiemann, F. Seifert, T. Schrag, A. E. Melchinger, S. Scholten, and E. Herzog (2017) Transcriptome-based prediction of hybrid performance with unbalanced data from a maize breeding programme. Plant Breeding 136:331–337.
Transcriptome-based prediction of hybrid performance with unbalanced data from a maize breeding programme
CA R O L A ZE N K E- PH I L I P P I1, MA T T H I A S FR I S C H1 , AL E X A N D E RTH I E M A N N2, FE L I X SE I F E R T2,
TO B I A S SC H R A G3, AL B R E C H T E . ME L C H I N G E R3, ST E F A N SC H O L T E N2,3and EV AHE R Z O G1,4 1
Institute of Agronomy and Plant Breeding II, Justus Liebig University, 35392 Giessen, Germany;2Biocenter Klein Flottbek, Developmental Biology and Biotechnology, University of Hamburg, 22609 Hamburg, Germany;3Institute of Plant Breeding, Seed Science, and Population Genetics, University of Hohenheim, 70593 Stuttgart, Germany;4Corresponding author, E-mail: [email protected]
With 3 figures and 1 table
Received November 7, 2016 / Accepted March 28, 2017 Communicated by W. Link
Abstract
mRNA transcription profiles are an alternative to DNA markers for pre-dicting hybrid performance. Our objective was to investigate their predic-tion accuracy in an unbalanced maize data set. We focused on the effectiveness of preselecting a core set of genes for transcription profiling and on the comparison of prediction models. A total of 254 hybrids were evaluated for grain yield and grain dry matter content. The mRNA tran-scripts of a core set of 2k genes and the genotype of 1k AFLP markers were assessed in the parental lines. Predictions based on transcriptome-based distances determined from the 2k core set of genes resulted in pre-diction accuracies below 0.5 and could not reach the high accuracies observed with a 46k micro-array in earlier studies. Predictions based on ridge regression resulted in prediction accuracies greater 0.6. Only mar-ginal differences were observed in the prediction accuracies of mRNA transcripts compared with AFLPs. We conclude that mRNA transcription profiles are suitable for hybrid prediction with ridge-regression models in unbalanced designs, even if limited resources allow only transcription profiling of a core set of genes.
Key words:hybrid prediction—genomic prediction—mRNA
transcription profiles—transcriptome-based distances —ridge regression
Choosing a suitable training set is crucial for successful predic-tion of hybrid performance in breeding programmes (Zhao et al. 2015). For prediction models using mRNA transcription profiles, important questions on how to most efficiently use the data gen-erated in earlier breeding cycles are as follows: Which genotypes can be used as the training set? How many and which genes should be profiled? What prediction models have the greatest prediction accuracy?
When genomic selection was introduced for the prediction of plant hybrids, it was already recognized that marker data cannot capture all polygenic effects that might contribute to the traits of interest (Piepho 2009). In the same study, it was suggested that gene expression and metabolomic data might be used in ridge-regression models instead of marker data. Promising results of hybrid prediction have been reported for gene expression profiles (Andorf et al. 2010, Maenhout et al. 2010, Steinfath et al. 2010, Zenke-Philippi et al. 2016), transcriptome-based distances (Frisch et al. 2010, Fu et al. 2012) and metabolomic data (Riedelsheimer et al. 2012, Dan et al. 2016, Xu et al. 2016). Transcriptome-based distances for hybrid prediction were successful when using a 46k micro-array for expression profiling (Frisch et al. 2010). Resource use could be minimized if a small core set of genes related to the traits to be predicted could be used instead of profiling the
expression of large sets of genes. The prerequisite is that such a core set is transferable between different experiments in a hybrid breeding programme. The effectiveness of using the transcription profiles of a core set of genes determined in an earlier breeding cycle of a breeding programme for prediction of new hybrids has to our knowledge not yet been investigated.
Experimental and simulation studies on genomic prediction of complex traits with marker data showed that ridge-regression approaches are computationally efficient and yield robust esti-mates of breeding values with high prediction accuracy (Piepho 2009, Heslot et al. 2012, Riedelsheimer et al. 2012, Technow et al. 2012, Massman et al. 2013). It has therefore been sug-gested that ridge-regression models could be used for routine prediction of hybrid performance in breeding programmes (Zhao et al. 2015). A combination of ridge-regression models with mRNA transcription profiles for hybrid prediction has been stud-ied recently (Zenke-Philippi et al. 2016). However, the predic-tion accuracies in this study were estimated by cross-validapredic-tion with data from one single factorial. A validation with a broader database, consisting of several experiments from one breeding programme, is still lacking.
Our main goal was to investigate how data, generated in ear-lier cycles of a breeding programme, can be used for transcrip-tome-based prediction of hybrid performance for grain yield (GY) and grain dry matter content (GDMC) of untested new maize hybrids. We used a data set consisting of 34 dent and 14 flint lines. Four complete factorial crosses of these lines were created in four different years. Taken together, they form an unbalanced incomplete factorial of 254 hybrids. For the parental lines, genotypes for 1k AFLP markers and mRNA transcription profiles for 2k genes were collected.
Our objectives were to (i) investigate whether the transcription profiles of a core set of genes preselected in one factorial can be used in other factorials of the same breeding programme for hybrid prediction with transcriptome-based distances, (ii) explore the prediction accuracy of ridge regression with mRNA tran-scription profiles in an unbalanced incomplete factorial by cross-validation and (iii) compare the prediction accuracies of mRNA transcription profiles and AFLPs for prediction of hybrid perfor-mance of one factorial using data from other factorials of the same breeding programme as the training set.
Materials and Methods
Field data: The field data were presented in detail by Schrag et al. (2006). In total, 48 maize elite inbred lines developed in the breeding
Plant Breeding,136, 331–337 (2017) doi:10.1111/pbr.12482
programme of the University of Hohenheim were used as parental lines for the factorial crosses under evaluation. The inbreds comprised 34 dent lines with Iodent or Iowa Stiff Stalk Synthetic background, and 14 flint lines with European flint or flint/Lancaster background. Four dent9flint factorial mating experiments (1497, 1194, 1496, 1194), further referred to as exps. 1–4, were produced, providing a total of 270 hybrids. Thereby, eight dent lines and six flint lines were included in more than one factorial. Each factorial was evaluated in a 1-year experiment (2002, 1999, 2003, 2001) with field trials at four to six locations in Germany under diverse agroecological conditions. The trials were evaluated in two-row plots using adjacent alpha designs with two to three replications. The hybrid performance of the crosses was recorded for GY in Mg/ha adjusted to 155 g/kg grain moisture and for GDMC in percentage. When combined, the four experiments can be regarded as an unbalanced incomplete factorial (Fig. 1).
Statistical analysis of the field data:The statistical analysis of the field data was presented in detail by Schrag et al. (2009). A mixed linear model was employed, in which main effects for years, locations and check varieties were treated as fixed. This allowed to account for performance differences between experiments. Genotypic effects, all interactions and block effects for trials, replications within trials and incomplete blocks within replications were treated as random. The residual error variance was assumed to be specific for each trial. All other block variances were assumed to be homogeneous. Mixed linear model analyses were performed with ASReml (Gilmour et al. 2002). AFLP marker data:The inbred lines were assayed for AFLP markers with 20 primer combinations as described in detail by Schrag et al. (2006). After removing markers with more than 10% missing values and a gene diversity smaller than 0.2, the number of 970 high-quality markers remained for the analysis.
Gene expression data:For our‘2k core set’of differentially expressed genes, we used a custom 2k micro-array (GEO Platform accession
number: GPL22267) with 2232 oligonucleotide sequences (50–70 nt) of the maize oligonucleotide array project (University of Arizona, USA; http://www.maizearray.org). The oligonucleotides were synthesized by Ocimum Biosolutions (Ijsselstein, the Netherlands) and printed on poly-L-lysine-coated glass slides with a Microgrid II printer (BioRobotics, Boston, MA, USA). The selection of oligonucleotides for the 2k core set was based on 46k array expression data from Exp. 1 (GEO Platform accession number: GPL6438). The main fraction of oligonucleotides (1639) represents genes that showed differential expression between the parental genotypes of Exp. 1 and consistent association with hybrid performance for GY in cross-validation runs to estimate prediction accuracies for this trait (Frisch et al. 2010). In addition, the array contains partially overlapping fractions of genes that correlated with hybrid performance for GY (378), hybrid performance for GDMC (200) or mid-parent heterosis for GY (345), and 205 representatives of the six most overrepresented biological processes among genes correlated with hybrid performance for GY in Exp. 1 (Thiemann et al. 2010).
To obtain the plant material for the gene expression analysis, the par-ental inbred lines of the hybrids were grown for 7 days under controlled conditions. We did not use plants from the field experiment. For the par-ental lines of exps. 2, 3 and 4, four seedlings were grown, and for the parental lines of Exp. 1, five seedlings were grown, to obtain biological replicates. The temperature under which the seedlings were grown was 25°C for 16 h per day and 21°C for 8 h at night; the air humidity was 70%. The plants were grown with randomized plate position. The whole 7-day-old seedlings were sampled and frozen in liquid nitrogen. As we aimed for the identification of genotype-dependent expression differ-ences, the biological replicates were pooled and homogenized prior to RNA extraction. Total RNA was isolated with mirVana miRNA isolation kit (Ambion, Thermo Scientific, Waltham, Massachusetts, USA). Two control lines, one from the dent and one from the flint pool, were included in each of the experiments if they were not part of the factorial anyway. For exps. 2 and 4, only 9 dent lines were included in the micro-array experiment, reducing the size of the factorials to 994, the total number of inbred lines to 48 and the total number of hybrids to 254, of which 230 were different. An interwoven loop design of two-colour
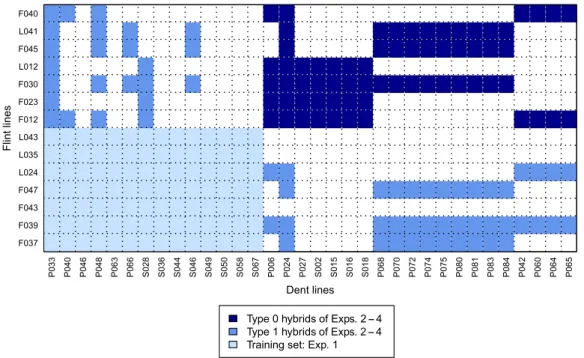
Fig. 1: The 34 dent and 14 flint lines of our data set and the hybrids generated from them. The display illustrates prediction of type 0 (dark blue) and type 1 (medium blue) hybrids of exps. 2–4 using the factorial of Exp. 1 (light blue) as training set [Color figure can be viewed at wileyonlinelibrary.com] 332 C . ZE N K E- PH I L I P P I, M . FR I S C H, A . TH I E M A N Ne t a l.
hybridizations striving for equal sampling and minimal distance between pairs of genotypes (Kerr and Churchill 2001) was developed for each factorial to minimize average variance. Sixty-three, 21, 57 and 21 hybridizations were performed for exps. 1, 2, 3 and 4 including 21, 15, 22 and 15 inbred lines, respectively. Both dyes (Cy3 or Cy5) were alter-nately used for each genotype to reduce systematic bias. RNA labelling and hybridizations were performed according to the protocols of the maize oligonucleotide array project (http://www.maizearray.org). The micro-arrays were scanned (AppliedPrecision ArrayWorx Scanner; Applied Precision Inc., Issaquah, Washington, USA), and the data were evaluated using the SoftwareGENEPIX PRO4.0 (Molecular Devices, Sunny-vale, CA, USA). The 2k micro-array was used for exps. 2–4. For Exp. 1, the raw files from the 46k micro-array were reduced to the oligos from the 2k micro-array. The data for exps. 1–4 have been deposited in NCBI’s Gene Expression Omnibus (Edgar et al. 2002) and are accessible through GEO Series accession numbers GSE17754, GSE85286, GSE85287 and GSE85288, respectively.
The limma package (Ritchie et al. 2015) was applied for the tests. For each experiment,n1of the arrays were chosen as coefficients, withnbeing the number of lines investigated in that experiment and the coefficients describing the interconnections between all arrays. A background correction, a normalization within arrays, and a normaliza-tion between arrays was carried out. An ordinary least squares model was fit for each gene with the coefficients describing differences between the RNA sources hybridized on the corresponding arrays. These differences were tested for significance with a moderatedF-test (Smyth 2004). A false discovery rate (Benjamini and Hochberg 1995) of 0.01 was used to adjust for multiple testing (Fu et al. 2012). The micro-array data were first analysed separately for each experiment. In total, 2122, 104, 542 and 140 genes of the 2k core set were found to be differentially expressed in exps. 1–4, respectively. In a second step, all micro-arrays of the four experiments were analysed together, result-ing in 985 differentially expressed genes. For all differentially expressed genes, we calculated the expression level (log2 scale) of each gene for each inbred line from the coefficients from the linear model.
Transcriptome-based distances: The binary transcriptome-based distanceDBbetween two inbred linesiandjfornggenes was calculated as: DBði;jÞ ¼ ffiffiffiffiffiffiffiffiffiffiffiffiffiffiffi nsði;jÞ ng s ; ð1Þ
withns(i, j) being the number of genes differentially expressed in inbred linesiandj(Frisch et al. 2010). Two genes were considered to be differ-entially expressed if the difference in their gene expression level exceeded a threshold of 1.3. The calculated transcriptome-based distances DBwere then used in a linear regression model:
y¼b0þb1DBðu;vÞ; ð2Þ
withyas the response vector consisting of the hybrid performance of the i=1. . .nhybrids,b0as a fixed intercept,b1as a regression coefficient andDB(u,v)as a vector with the binary transcriptome-based distances between allu=1. . .nufemale andv=1. . .nvmale parents (Frisch et al. 2010). For a hybrid with parentsuandvin the training set,DB between the two parents was calculated and Eq. (2) was used to predict the performance^yof the resulting hybrid.
We employed the binary transcriptome-based distanceDB, because in a previous analysis of Exp. 1, predictions withDBshowed greater correlations to the observed values than predictions with the Euclidean distanceDE, which is based on the quantitative expression levels (Frisch et al. 2010). Ridge-regression model:To estimate the predictor effects, we used a linear model that relates the phenotype of a hybrid to the marker genotypes or mRNA transcription profiles that were observed in the two parental lines of the hybrid as described in Zenke-Philippi et al. (2016):
y¼1b0þFuþMvþe ujNð0;r2
fÞ vjNð0;r2mÞ eiNð0;r2eÞ
ð3Þ yis the response vector consisting of the hybrid performance of the i=1. . .n hybrids,1is a vector of 1’s andb0a fixed intercept.uandv are the vectors of the genetic effects of thej=1. . .ppredictors in the female and male parent, respectively. The design matricesFandM con-sist of valuesfi,jandmi,jthat code the observation of thej-th predictor at thei-th hybrid. For marker data,fi,jormi,jis 1 if the AFLP band was observed in a parent and 0 otherwise. For mRNA transcripts, the design matrices contain the gene expression of genejin the parents of thei-th hybrid. The columns of the design matricesFandMwere normalized. For F, the normalization was carried out according to Frisch et al. (2010):
fi;j¼ oi;j k2 f1. . .sg
max(ok;jÞ ; ð4Þ
whereoi,jare non-normalized original values for gene expression, ands is the number of parental lines used as female parents. ForM, the nor-malization was carried out analogously. The variancesr^2
f,r^ 2 m, andr^
2 e were estimated by restricted maximum likelihood (REML). The effects^u and^v were obtained by solving the mixed model equations (Henderson 1984). With this model, the genotypic value of hybrids can be predicted as,
^
y¼1^b0þFu^þM^v; ð5Þ whereFandMare the design matrices for the predictors observed at the parental lines of the hybrid.
The components ofuandvare additive main effects of the poly-morphisms indicated by the respective design matrices. Genetically, they can be interpreted as effects for testcross performance if only the lines of the investigated experiment are considered. If the lines of the investigated experiment are considered as a representative sample from all lines of the opposite heterotic pool, the effects can be considered as estimates for the general combining ability. Technically an exten-sion of the model to include the interaction effects between compo-nents of the parameter vectors ofuandvis straightforward. By some authors these interactions are considered as dominance effects (Eq. 4 of Technow et al. 2012). The interaction effects could also be inter-preted as effects for special combining ability. We chose not to include the interaction effects in the model, because it cannot be expected that interaction effects could be estimated with sufficient pre-cision from the data set.
Assessment of prediction accuracy: For comparing the models, we determined prediction accuracies as the correlation rðy;^yÞ between predicted and observed hybrid performance. Some authors refer to this correlation as‘predictive ability’(cfAlbrecht et al. 2011).
We used cross-validation, in which the data were split into training and validation sets on the basis of a random assignment. Cross-validation was carried out for 1000 replications, and in each run, the prediction accuracy was assessed. In addition, we validated the prediction accuracy by dividing the data into training and validation set on the basis of the four experiments.
For evaluating prediction accuracies, we distinguished three types of hybrids. For type 2 hybrids, both parental lines of an untested hybrid were part of the training set, for type 1 and type 0 hybrids, one or none, respectively. The structure of training and validation set for type 0 and type 1 hybrids for cross-validation within experiments is illustrated in Fig. 1 of Fu et al. (2012). Cross-validation across experiments is illus-trated in Fig. 1 of Schrag et al. (2009). Validation using Exp. 1 as train-ing set and exps. 2–4 as validation set is illustrated in Fig. 1.
Cross-validation within experiments was carried out to evaluate the prediction accuracy of transcriptome-based distance prediction following the scheme described by Fu et al. (2012).
The estimation set for evaluating the prediction accuracy for type 2 hybrids in Exp. 1 consisted of three randomly chosen flint and five ran-domly chosen dent lines and their hybrids, and the validation set con-sisted of the remaining part of the factorial. For exps. 2–4, we used three flint and three dent lines; for Exp. 3, five flint and two dent lines; and for Exp. 4, three flint and three dent lines and the corresponding hybrids as training set. The remaining part of the factorial was used as validation set. For the evaluation of the prediction of type 0 hybrids, ten and five, six and three, ten and four, and six and three flint and dent lines were used in exps. 1–4, respectively.
Cross-validation across experiments was carried out following the scheme of Schrag et al. (2009), in which seven flint and 17 dent lines were randomly chosen. Their marker genotype or transcription profiles, together with the hybrids that were actually available in the unbalanced data set, were used as training set and the remaining hybrids as valida-tion set.
For validation on the basis of the four experiments, the subdivisions of the data set into training and validation sets are listed in Table 1.
Results
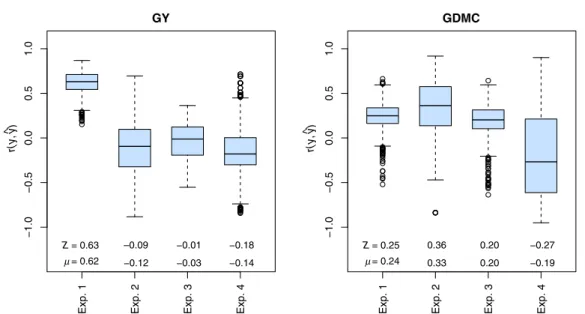
Cross-validation within experiments with transcriptome-based distances determined from the 2k core set of mRNA transcripts resulted in prediction accuraciesrðy;^yÞwith large ranges and mean values around zero for exps. 2–4 for GY and GDMC (Fig. 2). Only for Exp. 1, which was used to define the 2k core set of genes, the average prediction accuracy reached a value of 0.63 for GY.
Cross-validation across experiments for assessing the prediction accuracies for GY and GDMC with ridge regression resulted in small differences between AFLPs and mRNA tran-scripts (Fig. 3). The average prediction accuracy for hybrid per-formance of type 1 hybrids was greater thanrðy;^yÞ=0.6 for both GY and GDMC. For type 0 hybrids, the prediction
accuracies amounted to 0.5 for GY and 0.25 for GDMC. The variances of the prediction accuracies among the cross-validation runs were small.
For validation by splitting the data into training and validation set on the basis of the four experiments, and predicting hybrid performance with ridge regression, average prediction accuracies of around 0.6 were observed for type 1 hybrids for both traits for AFLPs as well as for mRNA transcripts (Table 1). For type 0 hybrids, the prediction accuracies were considerably smaller than 0.5 on average.
Discussion
The efficient use of previously generated data as training set is essential for the successful implementation of hybrid prediction, as the assembly and data generation of training sets can be costly and time-consuming. We discuss approaches to re-use data from factorial crosses originally conducted to select among experimental hybrids as training set for the prediction of hybrid performance for GY and GDMC of related breeding material.
In general, the gene expression data showed a high level of statistical robustness with respect to the developmental stage of the plant. The prediction accuracies were high, even if the gene expression in early seedling stages might not be the same as in later developmental stages that determine agronomic perfor-mance, and even if the 7-day-old plants might not be in exactly the same developmental stage. This high level of robustness might be explained by gene expression patterns that stay con-stant within the developmental stages of a certain genotype but vary between genotypes.
Transcriptome-based distances
Employing the gene expression of a 46k micro-array for hybrid prediction with transcriptome-based distances resulted in predic-tion accuracies of up torðy;^yÞ=0.8 for GY of type 2 hybrid