Procedia Engineering 125 ( 2015 ) 417 – 423
1877-7058 © 2015 Published by Elsevier Ltd. This is an open access article under the CC BY-NC-ND license (http://creativecommons.org/licenses/by-nc-nd/4.0/).
Peer-review under responsibility of organizing committee of The 5th International Conference of Euro Asia Civil Engineering Forum (EACEF-5)
doi: 10.1016/j.proeng.2015.11.108
ScienceDirect
The 5th International Conference of Euro Asia Civil Engineering Forum (EACEF-5)
Predicting the remaining service life of road
using pavement condition index
Ary Setyawan
a,*, Jolis Nainggolan
b, Arif Budiarto
caTransportation Infrastructure Research Group, UNS, Solo 57126, Indonesia bCivil Engineering Postgraduate Programme, UNS, Solo 57126, Indonesia cTransportation Infrastructure Research Group, UNS, Solo 57126, Indonesia
Abstract
Numerous factors cause damage to the road so that the remaining service life of the existing pavement and long-term road maintenance are unpredictable. The aims of this paper are to evaluate the condition of the road performance and damages and to calculate the remaining service life of the pavement on East Line of South Sumatera, as well as examining the relationship between these two values. This research includes the evaluation of five sections of the route with a various damaged condition and detailed appraisal of road conditions using the Pavement Condition Index (PCI), while the prediction of the remaining service life using the deflection data acquiring from Falling Weight Deflectometer measurements. The correlation of PCI value and remaining life service, intellectually established, created regression model to obtain the relationship and the correlation coefficient. The outcomes demonstrated that the road segments I, II, III, IV, and V have a PCI value of 56.1 (good), 37.8 (poor), 9.3 (very good), 39.0 (poor), and 95.0 (excellent) respectively and the remaining service lives sequentially are 2.39 years, 0.65 years, 4.43 years, 0.11 years and 3.57 years. The correlation between the PCI value and the service life of the pavement is y = 4,1872ln (x) -14.728, with the correlation coefficient is 0.88 which strong level of relationship.
© 2015 The Authors. Published by Elsevier Ltd.
Peer-review under responsibility of organizing committee of The 5th International Conference of Euro Asia Civil Engineering Forum (EACEF-5).
Keywords: Pavement Condition Index; remaining service life; road; FWD
* Corresponding author. Tel.: +62-81548558590 ; fax: +62-271-634524 E-mail address: arysetyawan@staff.ft.uns.ac.id
© 2015 Published by Elsevier Ltd. This is an open access article under the CC BY-NC-ND license (http://creativecommons.org/licenses/by-nc-nd/4.0/).
Peer-review under responsibility of organizing committee of The 5th International Conference of Euro Asia Civil Engineering Forum (EACEF-5)
1.Introduction
A number of pavement condition assessment methods are used to perform pavement condition evaluation, two of which are the International Roughness Index (IRI) and Pavement Condition Index (PCI). The IRI is typically measured using specialized equipment that calculates the smoothness and ride quality of the roadway segment based on established computer algorithms, while the PCI is based on subjective rating of the number of pavement distress based on specified guideline [1]. The literature stated that several pavement methods are related, as a result of which several researchers have developed models to predict the correlation between them Arhin and Noel [2] have conducted the study used three (3) years of IRI-PCI data obtained from the District Department of Transportation to develop models which could potentially predict PCI from IRI by functional classification and by pavement type. The regression models explored were developed using the ordinary least squares method and were tested on the basis of 5% level of significance. The IRI-PCI models yielded R² and adjusted R² values between 0.008 and 0.0730, indicating that the models could only explain up to 7.3% of the variations in the data. In addition, the root mean square errors of the models were all determined to be greater than 1. Even though the results of the ANOVA tests indicated that the coefficients were generally statistically significant, the low R² values and high Root Mean Square Errors (RMSE) indicate that the models do not adequately predict PCI from IRI, within the margin of error. A more sophisticated prediction tool, such as artificial neural networks, could be explored to potentially predict PCI from IRI more accurately.
Meanwhile, Peng et al [3] has concluded from the research that asphalt pavement performance evaluation, pavement roughness, which is subject to cracks, potholes, road repairs and so on, is a major factor to influence riding quality. Therefore, riding quality is partly correlated with pavement distress, and the relationship can be transformed to that between pavement roughness and distress rate. However, this relationship is not clear, and not reflected in existing evaluation models. Thus, correlation analysis and non-parametric test for independent samples were applied in this paper to find that, international roughness index and pavement distress rate are significantly different due to different grades of roads, then, linear and nonlinear regressions were used to analyze the relationships between international roughness index and pavement distress rate for different road grades. Finally, best models to describe relationships between international roughness index and pavement distress rate for different road grades were solved out, and corresponding 90% confidence intervals were computed.
Road pavement structures very often could not reach the service life as planned due to the number of reasons such as the number of repetitions axle designs carried by road pavement is greater than planned. Repetition larger axis will also impact on the value of the condition of the pavement faster than planned. Mulyono mentions that the road pavement condition index decreases with increasing traffic load per year. Aside from the impact of the traffic load, many factors causing damage to the pavement, such as, the quality of construction works that do not meet quality standards, poor maintenance, flooding and water scouring, basic soil characteristics that have development potential and high shrinkage, and other design factors [4]. As a result of many factors causing damage to roads, road serviceability age uncertainties arise, so that the remaining life of a pavement service life is difficult to predict. Uncertainty of service life will obviously affect the integrity of the planning that had been used as a reference, and to influence the handling of the priority road rehabilitation plan at a longterm period in a certain road [5]. Therefore, the aim of this research is to evaluate the pavement condition and to calculate the remaining service life of the existing road based on a Pavement Condition Index and Falling Weight Deflectometer measurement, the correlation of both data were then established. The five segments of the East line roads in South Sumatra, Indonesia were selected for study location.
2.Research Method 2.1.Research Location
The location of this research was on Sumatra East line, preciously at the road segment of Jambi-Paninggalan in South Sumatera province, Indonesia. Pavement at this location experiences premature deterioration so that the service life is shorter than the design. Map of the location and the road network in South Sumatera Province can be seen in Fig. 1.
Fig. 1. Map of Research Location at Sumatra East line in South Sumatera Province
2.2. Data collection and analysis
The procedure of data collection started by determining five road segments in the East line Sumatra from Jambi to Paningalan. The selected road segments have varied visual condition, ranging from very poor condition to excellent condition. For the accurate measurement and analysis, each road segment is further divided into 10 units of samples with an area of each unit is 700 m² (100 meter length and 7 meter width),
The detailed assessment and calculation of PCI and were then conducted to collect all data required for road condition, according to PCI Procedure [6]. The data to estimate the remaining service life of the pavement were collected with the measurement of Falling Weight Deflectometer (FWD), consist of the deflection data, air temperature, the surface layer temperature of the pavements, the ground water level, seasonal factors, layer structure and traffic data. The illustration of data collection with FWD is presented at Fig.2.
Fig.2. Falling Weight Deflectometer Meausurement to collect pavement data
The data collected from PCI survey and FWD measurement were then calculated and analyzed to find out the value of PCI at every segment selected based on ASTM [1] and the remaining service life of the subsequent road
segment were also analyzed and calculated based the results data from FWD. Based on the temperature data, the structural data of the pavement layer, the deflection data from FWD, and a seasonal factor (Ca), subsequently, the strength of the pavement structure of each road segment was calculated based on the number of existing Cumulative Equivalent Standard Axle (CESA). Based on existing CESA and existing traffic data the remaining service life on the road (UR) were calculated.
3.Pavement Condition Index
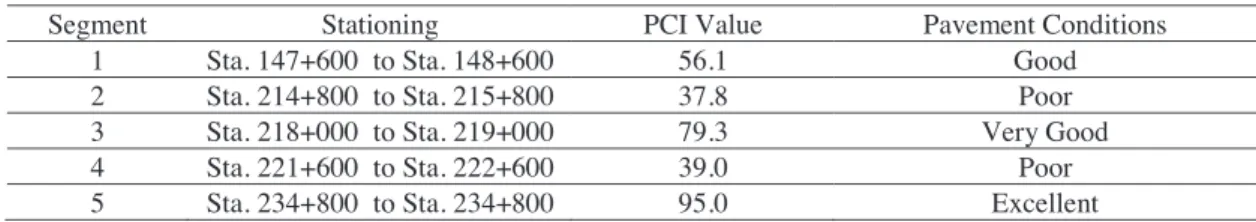
The data of pavement deterioration of each sample unit on each road segment are obtained directly from the road location. The results of survey data are then calculated to obtain the value of PCI of each sample unit. The average value of a sample in a single PCI unit of road segment is the value of PCI on road segments that are reviewed. The PCI value of each segment is the average value of each unit sampled. The interpretation of the condition of each segment based on PCI value obtained by referring to the scale of assessment which is presented in Table 1 and illustrated in Fig.3.
Table 1. The PCI value and the level of Pavement Condition
Segment Stationing PCI Value Pavement Conditions
1 Sta. 147+600 to Sta. 148+600 56.1 Good
2 Sta. 214+800 to Sta. 215+800 37.8 Poor
3 Sta. 218+000 to Sta. 219+000 79.3 Very Good
4 Sta. 221+600 to Sta. 222+600 39.0 Poor
5 Sta. 234+800 to Sta. 234+800 95.0 Excellent
Based on Table 1 and Fig.3, there are two segments of roads that experienced the worst conditions, namely the second segment with a value equal to 37.8 PCI (Poor) and the fourth segment with a value equal to 39.0 PCI (Poor). Based on the decision matrix PCI issued by Ontario Good Roads Association in 2009 [7], both segments are recommended for reconstruction, while the segments I, III, and V need to carry out a maintenance activity such as preventive maintenance to prevent further damage and expensive treatment.
Fig.3 Pavements Condition Index at % selected Segments of East line Road
4.Service Life Prediction
The data required for predicting service life of pavement are the road data, the traffic condition data and the deflection data obtained from FWD measurements. The general data on the road surveyed and the traffic condition data in the form of Annual Average Daily Traffic (AADT) are presented in Table 2 and Table 3, respectively.
Table 2. The general data of road surveyed at East Line Sumatera
General Road Data Data
Road status Arterial Road
Traffic Category C
Traffic growth 5 %
Road Width 7 Meter
Number of Lane 2 Lanes
Type of Pavement Flexible Pavement
Road Thickness Asphalt Concrete= 20 Cm
Sub Base Course = 55 Cm Table 3. The Average Annual Daily Traffic Data and the weight of vehicle
Type of vehicle Type
2 Type 3 Type 4 Type 5A Type 5B Type 6A Type 6B Type 7A Type 7B Type 7C Number of Vehicle (unit) 997 1510 1180 668 363 1249 697 300 23 183
Weight of Vehicle (Ton) 13.92 24.86 29.73 37.5 45
The original deflection data directly obtained from FWD test corrected to standard temperature of 35ºC for adjustment factor, factor groundwater / seasonal factors, as well as the correction factor FWD load. The calculation resulted the data corrected deflection (dL) as shown in Table 4. The remaining service lives of all segments were then calculated based on available data and presented in Table 5. The results of the remaining service life calculation using the method of deflection, indicates the there is a diversity of the remaining service life of each segment.
The levels of remaining service life of each segment of road pavement can be clearly seen in Table 5. It could be seen that the segment of the road that have the highest to the lowest remaining service life are the segment III, V, I, II and IV, respectively. Overall the five segments experience a very short remaining service life.
5.The Correlation between PCI Values and the Remaining Service Life
The data used in this analysis are the value of PCI and the remaining service life calculated based on deflection from FWD measurement. The correlation between the value of PCI and the remaining service life is carried out using the Microsoft Excel program. The pattern of the relationship between the PCI and the remaining service life is presented in Fig. 4. It shows that the group of road segments that have higher values of PCI tend to have longer remaining service life. Instead, the segment group with a lower PCI value also has a tendency of a shorter remaining service life. The relationship between the value of PCI with the remaining service life is y = 4,1872ln (x) -14.728, where y is the value of remaining service life (years) and x is the value of PCI. The correlation coefficient (r) of this relationship is 0.88 with a strong degree of interpretation.
In terms of its relation to the estimated need for treatment and rehabilitation of roads, pavement remaining life prediction based on functional failure is easier than those based on structural failure. PCI value may help to identify the segment, which needs to be conducted a preventive maintenance in order to prevent the further deterioration. Therefore, in this study, the critical limit value of PCI could be determined to select the right time of road handling for segment examined. Based on the critical limitation, the graph is developed to predict the remaining service life based on PCI values. However, further research is required to understand in detail this relationship for better understanding of this correlation.
Table 4. The calculation of corrected deflection data from FWD measurement
Table 5. The remaining service life calculated based on FWD deflection measurement Location
(Kilometer)
Traffic Multiplier for Flexible Pavement
(TM)
Traffic Growth, (i)% Remaining Service Life Number of CESA Years Segment I (KM 147+600 s/d 148+600) 1,69 5% 37.329.490,25 2,98 Segment II (KM 214+800 s/d 215+800) 6.838.737,45 0,57 Segment III (KM 218+000 s/d 219+000) 57.987.120,72 4,47 Segment IV (KM 221+600 s/d 222+600) 2.623.037,38 0,22 Segment V (KM 234+800 s/d 234+800) 43.246.122,61 3,42
Fig.4 The correlation between PCI value and The Remaining Life Service
Load Deflection Corected Seasional Load Deflection
FWD, mm T o T emperature Correction Correction Corrected
(KM) (T on) df1 T u T p T u+T p T t T b T L Standard, (Ft) (Ca) (LFC-FWD) (dL)
(a) (b) (c) (d) (f) (g) (h) (i) (j) (k) (l) (m) (n) (o)
KM 147+703 4.12 0.23 33.90 45.90 79.80 39.70 36.80 40.80 0.89 1.2 0.99 0.24 KM 147+903 4.09 0.22 34.30 50.70 85.00 42.10 39.10 43.97 0.84 1.2 1.00 0.22 KM 148+103 4.11 0.13 33.70 46.40 80.10 39.80 36.90 41.03 0.89 1.2 0.99 0.13 KM 148+303 4.10 0.19 33.80 50.40 84.20 41.80 38.90 43.70 0.85 1.2 1.00 0.19 KM 148+503 4.11 0.24 34.00 45.20 79.20 40.90 38.00 41.37 0.88 1.2 0.99 0.25 KM 214+903 4.13 0.18 34.00 45.20 79.20 39.20 36.50 40.30 0.90 1.2 0.99 0.19 KM 215+103 4.15 0.22 26.90 30.10 57.00 29.00 26.30 28.47 1.17 0.9 0.98 0.30 KM 215+303 4.14 0.24 33.70 44.90 78.60 39.00 36.10 40.00 0.90 1.2 0.99 0.26 KM 215+503 4.10 0.35 26.40 29.70 56.10 28.10 25.90 27.90 1.19 0.9 1.00 0.37 KM 215+703 4.11 0.35 33.80 45.20 79.00 39.20 36.40 40.27 0.90 1.2 0.99 0.37 KM 218+103 4.16 0.23 33.60 44.40 78.00 38.70 36.00 39.70 0.91 1.2 0.98 0.25 KM 218+303 4.12 0.19 26.50 30.20 56.70 28.40 26.10 28.23 1.18 0.9 0.99 0.20 KM 218+503 4.11 0.19 33.20 44.00 77.20 38.30 35.40 39.23 0.92 1.2 0.99 0.21 KM 218+703 4.12 0.18 26.50 30.20 56.70 28.40 26.10 28.23 1.18 0.9 0.99 0.00 KM 218+903 4.13 0.16 33.20 42.50 75.70 37.60 35.00 38.37 0.93 1.2 0.99 0.18 KM 221+703 4.05 0.46 34.40 41.30 75.70 37.70 34.90 37.97 0.94 1.2 1.01 0.52 KM 221+903 4.11 0.19 25.50 29.30 54.80 27.50 25.30 27.37 1.21 0.9 0.99 0.21 KM 222+103 4.11 0.19 33.80 41.40 75.20 37.40 34.70 37.83 0.94 1.2 0.99 0.22 KM 222+303 4.14 0.17 26.30 28.80 55.10 27.70 25.50 27.33 1.21 0.9 0.99 0.18 KM 222+503 4.07 0.25 33.70 41.70 75.40 37.50 34.80 38.00 0.94 1.2 1.00 0.28 KM 234+903 4.12 0.12 32.00 39.30 71.30 35.50 32.90 35.90 0.98 1.2 0.99 0.14 KM 235+103 4.08 0.19 32.50 40.00 72.50 36.10 33.40 36.50 0.97 1.2 1.00 0.22 KM 235+303 4.14 0.12 32.70 37.90 70.60 35.10 32.60 35.20 1.00 1.2 0.99 0.15 KM 235+503 4.11 0.16 32.30 40.00 72.30 36.00 33.30 36.43 0.97 1.2 0.99 0.19 KM 235+703 4.13 0.21 32.30 35.80 68.10 34.00 31.30 33.70 1.03 1.2 0.99 0.26 T emperature (°C) Location Point Surveyed
Segment I Segment II Segment III Segment IV Segment V Segment I Segment II Segment III Segment IV Segment V y = 4.0622ln(x) - 14.117 R² = 0.8211 0 1 2 3 4 5 30 40 50 60 70 80 90 100 R em ai n in g Se rvi ce L ife (Ye ars)
6. Conclusion
Pavement on the segment I (KM 147 + 600-148 + 600) has a PCI value of 56.1 (good) with the remaining service life of 2.98 years. Segment II (KM 214 + 800-215 + 800) has a PCI value of 37.8 (poor) with the remaining service life of 0.57 years. Segment III (KM218 + 000-219 + 000) has a PCI value of 79.3 (very good) with the remaining service life of 4.47 years. Segment IV (KM 221 + 600.222 + 600) has a PCI value of 39.0 (poor) with the remaining service life of 0.22 years. Segment V (KM 234 + 800-235 + 800) has a PCI value of 95.0 (excellent) with the remaining service life of 3.42 years. The relationship between the PCI and the remaining service life on the road surveyed is y = 4,1872ln (x) -14.728, where y is the value of remaining service life (years) and x is the value of PCI. The correlation coefficient (r) of this relationship is 0.88 with a strong degree of interpretation.
References
[1] Shahin, M. Y. (2005). Pavement management for airports, roads, and parking lots (Vol. 501). New York: Springer.
[2] Arhin, S. A., & Noel, E. C. (2014). Predicting Pavement Condition Index from International Roughness Index in Washington, DC (No. DDOT-RDT-14-03).
[3] Peng, B., Hu, L., Jiang, Y. S., & Yun, L. (2012). Research on Relationship between Riding Quality and Pavement Distress of Asphalt Pavement. Applied Mechanics and Materials, 178, 1306-1313.
[4] Mulyono, A.T., Wahyudi, W., dan Sandra, P.A., 2013, Analysis of Pavement Condition Index (PCI) and Solution Alternative Of Pavement Damage Handling Due to Freight Transportation Overloading, Proceedings of the Eastern Asia Society for Transportation Studies, Vol.9, http://easts.info/online e/proceedings/vol9/index.html.
[5] Yu, J., 2005, Pavement Service Life Estimation and Condition Prediction,A Dissertation of Doctorate of Philosophy in Engineering, The University of Toledo. United States.
[6] ASTM, 2008, Standard Practice for Road and Parking Lots Pavement Conditions Survey, Designation D 6433-07, ASTM, USA