ROAD
WORK
AHEAD
R AI L RO A D CR OS S I NGBridge Load Testing Versus
Bridge Load Rating
Report Number: KTC-19-16/SPR06-423-1F DOI: https://doi.org/10.13023/ktc.rr.2019.16 Report Number: KTC-20-13/FHWA11-1F DOI: https://doi.org/10.13023/ktc.rr.2020.13
Fiscal Year 20
11
FHWA-536 Report
The Kentucky Transportation Center is committed to a policy of providing equal
opportunities for al persons in recruitment, appointment, promotion, payment, training,
and other employment and education practices without regard for economic, or social
status and will not discriminate on the basis of race, color, ethnic origin, national origin,
creed, religion, political belief, sex, sexual orientation, marital status or age.
Kentucky Transportation Center
College of Engineering, University of Kentucky, Lexington, Kentucky in cooperation with
Kentucky Transportation Cabinet Commonwealth of Kentucky Kentucky Transportation Center
College of Engineering, University of Kentucky, Lexington, Kentucky in cooperation with
Kentucky Transportation Cabinet Commonwealth of Kentucky
© 2020 University of Kentucky, Kentucky Transportation Center
Information may no tbe used, reproduced, or republished without KTC’s written consent.Information may not be used, reproduced, or republished without KTC’s written consent.© 2018 University of Kentucky, Kentucky Transportation Center
Kentucky Transportation Center
College of Engineering, University of Kentucky Lexington, Kentucky in cooperation with
Kentucky Transportation Cabinet Commonwealth of Kentucky
The Kentucky Transportation Center is committed to a policy of providing equal
opportunities for all persons in recruitment, appointment, promotion, payment, training,
and other employment and education practices without regard for economic or social
status and will not discriminate on the basis of race, color, ethnic origin, national origin,
creed, religion, political belief, sex, sexual orientation, marital status, or age.
© 2018 University of Kentucky, Kentucky Transportation Center
Kentucky Transportation Center
College of Engineering, University of Kentucky Lexington, Kentucky in cooperation with
Kentucky Transportation Cabinet Commonwealth of Kentucky
The Kentucky Transportation Center is committed to a policy of providing equal
opportunities for all persons in recruitment, appointment, promotion, payment, training,
and other employment and education practices without regard for economic or social
status and will not discriminate on the basis of race, color, ethnic origin, national origin,
creed, religion, political belief, sex, sexual orientation, marital status, or age.
KTC Report
KTC-20-13/FHWA11-1F
Fiscal Year 2011 FHWA-536 Report for the Kentucky Transportation Cabinet
Doug Kreis, Ph.D., P.E.
Associate Director
Candice Wallace, Ph.D.
Research Scientist
Bryan Gibson, Ph.D.
Program Manager
and
Sarah McCormack
Research Scientist
Kentucky Transportation Center
College of Engineering
University of Kentucky
Lexington, Kentucky
In Cooperation With
Kentucky Transportation Cabinet
Commonwealth of Kentucky
The contents of this report reflect the views of the authors, who are responsible for the facts and accuracy of the data presented herein. The contents do not necessarily reflect the official views or policies of the University of Kentucky, the Kentucky Transportation Center, the Kentucky Transportation Cabinet, the United States Department of Transportation, or the Federal Highway Administration. This report does not constitute a standard, specification, or regulation. The inclusion of manufacturer names or trade names is for identification purposes and should not be considered an endorsement.
Table of Contents
Executive Summary ... 1
1. Introduction ... 2
1.1 The Federal Highway Administration ... 2
1.2 What is Form FHWA-536? ... 2
1.3 Important General Considerations When Completing Form FHWA-536 ... 3
2. Instructions for Form FHWA-536 ... 5
2.1 Section I: Disposition of Highway-user Revenues Available for Local Government Expenditure ... 6
2.2 Section II: Receipts for Road and Street Purposes ... 11
2.3 Section III: Expenditures for Road and Street Purposes ... 30
2.4 Section IV: Local Highway Debt Status ... 37
3. Inflation Adjustments ... 40
4. Conclusion ... 44
References ... 45
List of Tables Table 1: FHWA 536 Section I ... 6
Table 2: FHWA-536 Section II ... 11
Table 3: Proportions of Funding Sources ... 28
Table 4: Local Government Expenditures ... 30
Table 5: Local Highway Debt Entry ... 37
List of Figures Figure 1: Local Motor-Vehicle Tax used for Highway Purposes FY 2001 - FY 2011 ... 8
Figure 2: State Highway-User Tax Receipts used for Highway Purposes FY 1999 - FY 2011 ... 9
Figure 3: Annual Receipts Trend from Federal Highway Administration FY 1999 - FY 2011 ... 10
Figure 4: Property Taxes and Assessments Receipts FY 2005 - FY 2011 ... 13
Figure 5: FY 2011 Other Local Imposts ... 14
Figure 6: Total Other Local Imposts by Fiscal Year 1999 - 2011 ... 15
Figure 7: Revenue Generated from Vehicle Impounds FY 1999 - FY 2011 ... 15
Figure 8: Total Miscellaneous Local Receipts for FY 1999 - FY 2011 ... 16
Figure 9: Total Receipts from Local Sources for Road and Street Purposes FY 1999 - FY 2011 ... 18
Figure 10: FY 2011 State Fund Receipts ... 19
Figure 11: Truck License Revenue for Road and Street Purposes FY 1999 - FY 2011 ... 20
Figure 12: Drivers License Revenue for Road and Street Purposes FY 1999 – FY 2011 ... 21
Figure 13: Local Government Economic Assistance Fund Receipts FY 1999 - FY 2011 ... 22
Figure 14: State Grant Revenue FY 1999 - FY 2011 ... 23
Figure 15: Total Receipts from Other State Government Funds for Road and Street Purposes FY 1999 – FY 2011 ... 24
Figure 16: Total Receipts from State Government FY 1999 - FY 2011 ... 25
Figure 17: Receipts Received from Federal Agencies FY 2011 ... 26
Figure 18: Total Receipts Received from Federal Agencies FY 1999 - FY 2011 ... 27
Figure 19: Total Receipts for FY 2011 ... 28
Figure 20: Total Receipts for Road and Street Purposes by Fiscal Year ... 29
Figure 21: Capital Outlay by Local Government for Road and Street Purposes FY 1999 - FY 2011 ... 31
Figure 22: Total Disbursements for Road and Street Purposes by Fiscal Year ... 36
Figure 23: Disposition of Highway-User Revenues Available for Local Government Expenditure (Income vs Expenditure) ... 36
Figure 24: Total Receipts Adjusted for Inflation to 2011 Values ... 40
Figure 26: Disbursements and Receipts adjusted for inflation to FY 2011 values ... 41
Figure 27: Annual Receipts from FHWA adjusted for Inflation to FY 2011 Values ... 42
Figure 28: Total Receipts from State Government FY 1999 - FY 2011 ... 42
Figure 29: Total Receipts from State Government Adjusted for Inflation to FY 2011 Level ... 43
Executive Summary
The Federal Highway Administration (FHWA) requires state transportation agencies to submit a biennial report on local highway finances. The purpose of these reports is to provide FHWA with the data it needs to capture the financing of highway activities at the local level. Based on this information, it can identify trends in revenue, expenditures, investments, and program development, and in turn make decisions about future investments. The report, FHWA-536, asks agencies to report on four areas of local highway finance: 1) disposition of highway-user revenues; 2) revenues used for roads and streets identified by source and funding type; 3) road and street expenditures identified by purpose of activity; and 4) local highway debt status. This document summarizes data submitted to fulfill the Kentucky Transportation Cabinet’s FHWA-536 obligations in FY 2011. The table below presents itemized revenues and expenditures in each of the four areas of local highway finance listed above. Total receipts were $456,078,635, an increase of $110,761,911 compared to FY 2009. Total disbursements equaled $503,323,826 346,188,072, an increase of $157,135,174 over FY 2009.
Disposition of Highway-User Revenues Available for Local Government Expenditure
Local Motor-Fuel Taxes $0
Local Motor Vehicle Taxes $28,214,072
State Highway User Taxes $140,706,985
FHWA Receipts $18,771,209
Total Available Revenues $187,692,266
Receipts for Road and Street Purposes
Receipts from Local Government Sources $154,859,523
Private Contributions $0
Receipts from State Government $271,754,302
Receipts from Federal Government $29,464,810
Total Receipts $456,078,635
Expenditures for Road and Street Purposes
Local Highway Expenditures $503,323,826
Debt Service on Local Obligations $0
Payments to States for Highways $0
Payments to Toll Facilities $0
Total Disbursements $503,323,826
Local Highway Debt Status
1. Introduction
1.1 The Federal Highway AdministrationThe Federal Highway Administration (FHWA) is a division of the United States Department of Transportation that provides governance related to the design, construction, maintenance and preservation of the country’s highways, bridges, and tunnels (FHWA, 2020). Though the Federal-aid Highway Program, the FHWA supports state and local governments in designing, constructing, and maintaining the U.S. highway system. The agency carries out its mission1 by providing financial and technical assistance to state and local governments.
The Federal-aid Highway Program began in 1916 and since then has gone through many iterations. However, the partnership that stands as the program’s foundation has survived the changes and challenges the country has encountered since its inception (FHWA, 2020). The adaptability of federal-state partnerships lets the FHWA take a leading role in the transportation community. Integral to this relationship is the reporting of each state’s highway financial data.
The FHWA provides a variety of reporting forms to state transportation agencies. These forms are used to collect data from several state agencies and departments as well as many local government agencies. FHWA State Planning and Research (SPR) Program funds are available to all States to defray the cost of obtaining and reporting statistical information to the agency (FHWA, 2020).
The FHWA has designed a series of reporting forms into two main areas: 1) highway use and 2) highway funding. This report presents the form FHWA-536 Local Highway Finance for the fiscal year ending June 2011.
1.2 What is Form FHWA-536?
FHWA-536 is a local highway finance report. The report is a biennial summary of highway funding by local governments (FDOT, 2020). Local governments include counties, townships, municipalities, special districts, and other general-purpose authorities under the jurisdiction of local governments (FHWA, 2020). FHWA-536 provides for the reporting of four basic areas of local highway finance: 1) disposition of highway-user revenues; 2) revenues used for roads and streets identified by source and funding type; 3) road and street expenditures identified by purpose of activity; and 4) local highway debt status (FHWA, 2020).
Using information reported on FHWA-536, the FHWA develops national tables that capture how highway activities are financed at the local level. These data, combined with more comprehensive state highway finance information, help FHWA detect relationships and changes in revenue, expenditure and investment patterns, and financial trends, which are essential for policy and program development (FDOT, 2020). Highway finance summaries, along with data from the Highway Performance Monitoring System (HPMS), are used by FHWA to estimate highway needs and develop appropriate future federal responsibility in highway transportation (FHWA, 2020). Information presented in the national tables is available for use by myriad interested parties and is frequently used by public and private sector policy staff, all levels of government, business firms, research groups, trade associations, and universities (FHWA, 2020).
1 The FHWA mission is to “enable and empower the strengthening of a world class highway system that promotes
National summary tables are developed annually. During off years (the year between FHWA-536 reporting), the FHWA uses projections, estimates, and data submitted voluntarily by states. States have the option of submitting FHWA-536 annually and are encouraged to do so by the FHWA (FHWA, 2020). 1.3 Important General Considerations When Completing Form FHWA-536
FHWA provides a list of general considerations states must abide by to ensure consistent reporting within and between states. The following is a list and brief explanation of each of these considerations:
• Determination of Reporting Year
o Fiscal years can vary among local governments. The reporting state should be cognizant of any variables and ensure the reporting period is accurately specified and recorded in the data provided.
• Coverage and Content of the Local Finance Report
o FHWA-536 is submitted biennially. However, the form and data provided are for one year. Summary data represent information for all units of local government. Additionally, FHWA-536 should report the disposition of all highway-user revenues available to local governments for expenditure, and all receipts and expenditures related to: a) the construction, maintenance, operation, and administration of roads, streets, alleys, and other public ways; b) traffic police and road patrols; and c) debt service and status of bonds and notes issued to finance highway activities. Private sector donations for roads and streets should also be reported on FHWA-536. Private contributions are growing and are now a significant source of highway funding. Reporting these data is crucial for FHWA to understand and illustrate the total picture of local highway finance. Lastly, the accounting method used by local governments to report information to the state for FHWA-536 can be either cash or accrual.
• Toll Facility Data
o Local toll facility information must be reported for publicly owned facilities each year. Toll facility data must be reported separately from other local highway finance information. If utilizing FHWA-536 for toll data, a separate form must be completed for each facility.
• Sampling and Estimation
o FHWA recognizes that highway finance data may not be easily obtainable for all units of local government. In such instances, the agency recommends using sampling and estimation techniques. When relying on sampling and estimating, data should be collected for a representative sample of local governments and extrapolated to produce statewide totals. However, this is not a one-size-fits-all scenario. FHWA notes that each State is responsible for determining the sampling and estimating techniques that best represent their local government structures. Additionally, it is imperative to describe in an appendix to the report what techniques were used. When relying on sampling and estimation, a full survey must be conducted every 10 years to ensure the data set’s integrity and representativeness.
• Capital Outlay on the National Highway System
o All expenditures on the National Highway System are particularly important to FHWA. The agency outlines the manner in which it wants states to obtain the necessary information: a) identify local governments with National Highway System routes within their jurisdiction; b) acknowledge that not all local government officials are aware of the National Highway System routes, and provide all local governments with a listing of the National Highway System routes. This activity should be coordinated with the HPMS data set. The actual data set in any given
state may be relatively small as nationally only two percent of the total National Highway System is under local jurisdiction (FHWA, 2020).
• Fund Transfers Between Governments
o Fund transfers between local governments should not be reported on FHWA-536. However, transfers to and from state agencies should be identified and reported. It is important for there to be consistency across FHWA forms in terms of how fund transfers are presented. For example, the amount of money reported on FHWA-536 as a transfer to a state agency should match the amount reported on FHWA-531 (State Highway Income) as receipts from local governments. Transfers from state agencies to local governments reported on FHWA-536 should be match funds shown on FHWA-556 (State Motor-Fuel Tax Receipts), FHWA-566 (State Motor-Vehicle Registration Fees and Other Receipts), and FHWA-532 (State Highway Expenditures). Differences in these reporting amounts are possible only when a local government uses a portion of multipurpose state or federal grants for roads and streets. In this case, the amount reported on FHWA-536 should be higher. Major discrepancies should be explained (FHWA, 2020). Additionally, all federal funds received by local governments should be identified and reported on FHWA-536. Federal funds include: a) direct payments; b) grants-in-aid; and c) funds transferred through the state. If the state retains the local portion of the state tax revenue or federal funds, the amount retained by the state should be omitted from FHWA-536 (FHWA, 2020).
2. Instructions for Form FHWA-536
FHWA-536 is divided into four main sections: 1) Disposition of highway-user revenues available for local government expenditure; 2) Receipts for road and street purposes; 3) Expenditures for road and street purposes; and 4) Local highway debt status. FHWA has developed user instructions, which are summarized below.
This chapter also contains FHWA-536 analysis for Kentucky covering FY 2011. This work was completed by researchers at the Kentucky Transportation Center (KTC) on behalf of the Kentucky Transportation Cabinet (KYTC). Values for FY 2011 are compared to previous biennial reports, which were also prepared by the Center.
2.1 Section I: Disposition of Highway-user Revenues Available for Local Government Expenditure Section I is divided into four main components:
A) Local motor fuel taxes; B) Local motor-vehicle taxes;
C) Receipts from State highway-user taxes; and D) Receipts from FHWA.
These elements are further categorized by: i) total receipts available; ii) minus amount for collection expenses; iii) minus amount for non-highway purposes; iv) minus amount used for mass transit; and v) remainder used for highway purposes. Table 1 captures Section 1 of FHWA-536. Subsequent descriptions correspond to the cells labeled in red (A1, A2, A3……D3, D4, D5).
Table 1: FHWA 536 Section I LOCAL HIGHWAY FINANCE REPORT
STATE
YEAR ENDING (mm/yy): /
I. DISPOSITION OF HIGHWAY-USER REVENUES AVAILABLE FOR LOCAL GOVERNMENT EXPENDITURE ITEM A. Local Motor-Fuel Taxes B. Local Motor-Vehicle Taxes C. Receipts from State Highway-User Taxes D. Receipts from Federal Highway Administration
1. Total receipts available A1 B1 C1 D1
2. Minus amount used for
collection expenses A2 B2 C2 D2
3. Minus amount used for
nonhighway purposes A3 B3 C3 D3
4. Minus amount used for
mass transit A4 B4 C4 D4
5. Remainder used for
highway purposes A5 B5 C5 D5
A. Local Motor-Fuel Taxes
Revenue received from local motor-fuel taxes. This revenue stream is from the local government taxation on the highway use of motor-fuel.
A1. Total receipts available
Net income (i.e., receipts less refunds). A2. Minus amount for collection expenses
Amount of local motor-fuel tax revenues deducted for the payment of collection expenses. Sometimes this may be paid from local general funds. When this occurs, no amount should be reported here.
Motor-fuel tax revenue used for non-highway or non-transit purposes. Examples include local general purposes (schools) or other modes of transportation (e.g., marine, aviation).
A4. Minus amount used for mass transit Local motor-fuel taxes used for mass transit. A5. Remainder used for highway purposes Calculate A5 using the following equation:
A5 = A1 - A2 - A3 - A4
Kentucky’s motor-fuel tax is state imposed. Gasoline and special fuel dealers transmit the taxes to the Department of Revenue (Kentucky Department of Revenue, 2020). For this reason, no local motor-fuel taxes are recorded in Section IA of FHWA-536.
B. Local Motor-Vehicle Taxes
Revenues received through local motor-vehicle taxes and fees, including local registration fees, plate fees, and wheel taxes. State-imposed registration or driver-license fees are not included.
B1. Total receipts available
Net income (i.e., total receipts less refunds).
• FY 2011 = $28,214,072.
B2. Minus amount used for collection purposes
Local motor-vehicle tax revenue deducted for the payment of collection expenses.
• FY 2011 = $0
B3. Minus amount used for non-highway purposes
Local motor-vehicle tax revenue used for a purpose that was either non-highway or non-transit based. Examples include local general purposes (schools) or other modes of transportation (such as marine or aviation).
• FY 2011 = $0
B4. Minus amount used for mass transit
Amount of local motor-vehicle tax revenues used for mass transit.
• FY 2011 = $0
B5. Remainder used for highway purposes Calculate B5 using the following equation:
B5 = B1- B2 - B3 - B4
• FY 2011 = $28,214,072.
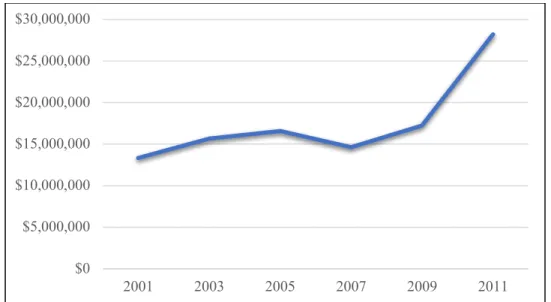
• Figure 1 captures trends in this revenue stream for FY 2001 through FY 2011. FY 2011 recorded greater revenues from local motor-vehicle taxes used for highway purposes than any previous years ($28,214,072). The previous high was recorded in FY 2009 at $17,236,040.
Figure 1: Local Motor-Vehicle Tax used for Highway Purposes FY 2001 - FY 2011 C. Receipts from State Highway-User Taxes
Amount in state highway-user taxes and fees transferred to local government. Included are proceeds from
state-imposed motor-fuel taxes, motor-vehicle registration fees, driver-license fees, and motor-carrier taxes. Reported amounts are to be consistent with information provided in 556, 566, and FHWA-532.
C1. Total receipts available
All money transferred from state to local governments. Exclude any funds on FHWA-566 (Item 2A) listed as deductions by county and local officials for collection and administration expenses.
• FY 2011 = $140,706,985.
C2. Minus amount used for collection expenses Report nothing for this line item.
• FY 2011 = $0
C3. Minus amount used for non-highway purposes
State highway-user revenues used for non-highway and non-transit purposes, including funds used for local general purposes, other modes of transportation, or specific non-highway purposes. Examples include schools, conservation programs, and courthouses (FHWA, 2020).
• FY 2011 = $0
C4. Minus amount used for mass transit purposes State highway-user taxes used for mass transit.
• FY 2011 = $0
C5. Remainder used for highway purposes Calculate C5 using the following equation:
C5 = C1- C2 - C3 - C4
• FY 2011 = $140,706,985.
• Figure 2 captures trends in this revenue stream for FY 1999 through FY 2011. Revenue generated in FY 2009 from state highway-user taxes reduced significantly in comparison to previous years. Levels
$0 $5,000,000 $10,000,000 $15,000,000 $20,000,000 $25,000,000 $30,000,000 2001 2003 2005 2007 2009 2011
in FY 2009 decreased close to FY 1999 revenue ($138,757,224). FY 2011 continued the trend of decreasing revenue. However, the decrease in revenue was not as dramatic as FY 2009, with FY 2011 revenue $917,909 less than FY 2009.
Figure 2: State Highway-User Tax Receipts used for Highway Purposes FY 1999 - FY 2011 D. Receipts from Federal Highway Administration
All FHWA funds received by local governments. Most of these funds are generated from federal motor-fuel and motor-vehicle taxes are passed through state to local governments.
D1. Total receipts available
All funds received by local governments.
• FY 2011 = $18,771,209
D2. Minus amount used for collection expenses
Report nothing for this line item. FHWA funds can only be used for highway and mass transit purposes.
• FY 2011 = $0
D3. Minus amount used for non-highway purposes
Report nothing for this line item. FHWA funds can only be used for highway and mass transit purposes.
• FY 2011 = $0
D4. Minus amount used for mass transit purposes FHWA funds used for mass transit.
• FY 2011 = $0
D5. Remainder used for highway purposes Calculate D5 using the following equation:
D5 = D1- D2 - D3 - D4 • FY 2011 = $18,771,209 $0 $50,000,000 $100,000,000 $150,000,000 $200,000,000 $250,000,000 1999 2001 2003 2005 2007 2009 2011
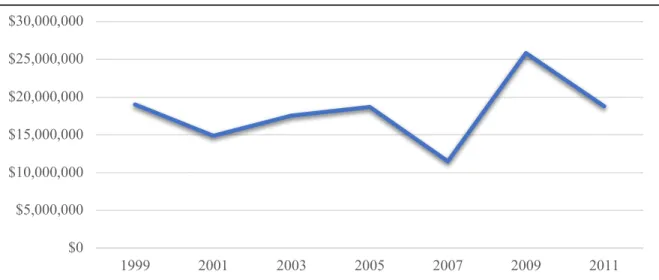
• Figure 3 captures trends in this revenue stream for FY 1999 through FY 2011. FY 2009 revenue from FHWA is a record high in comparison to previously recorded levels. In FY 2011, FHWA receipts returned to just below FY 1999 levels.
Figure 3: Annual Receipts Trend from Federal Highway Administration FY 1999 - FY 2011
$0 $5,000,000 $10,000,000 $15,000,000 $20,000,000 $25,000,000 $30,000,000 1999 2001 2003 2005 2007 2009 2011
2.2 Section II: Receipts for Road and Street Purposes
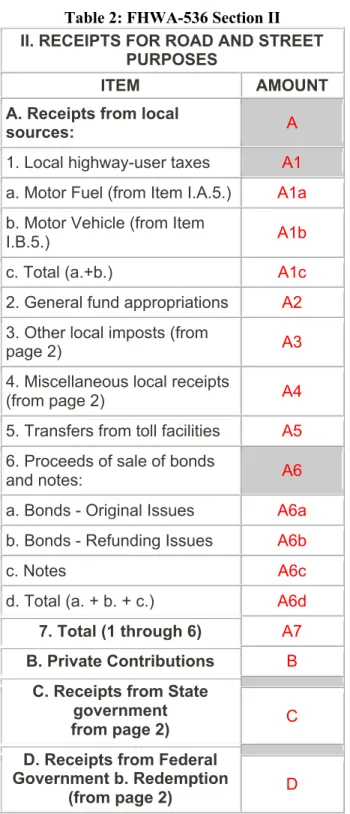
Section II records revenue streams for local road and street purposes during a given fiscal year. There are four funding source categories: 1) local government, 2) private sources, 3) state government, and 4) federal government. For each category, an attempt should be made to identify the type and amount of funding. Any classification system used for these funds must align with those used in reports that identify state receipts and expenditures (i.e., those used in 531 and 532). Table 2 illustrates Section II of FHWA-536. Each source is described in entries below.
Table 2: FHWA-536 Section II II. RECEIPTS FOR ROAD AND STREET
PURPOSES
ITEM AMOUNT
A. Receipts from local
sources: A
1. Local highway-user taxes A1 a. Motor Fuel (from Item I.A.5.) A1a b. Motor Vehicle (from Item
I.B.5.) A1b
c. Total (a.+b.) A1c
2. General fund appropriations A2 3. Other local imposts (from
page 2) A3
4. Miscellaneous local receipts
(from page 2) A4
5. Transfers from toll facilities A5 6. Proceeds of sale of bonds
and notes: A6
a. Bonds - Original Issues A6a b. Bonds - Refunding Issues A6b
c. Notes A6c
d. Total (a. + b. + c.) A6d 7. Total (1 through 6) A7 B. Private Contributions B
C. Receipts from State government
from page 2) C
D. Receipts from Federal Government b. Redemption
E. Total receipts (A.7 + B + C
+ D) E
A. Receipts from local government sources
All local government funding sources. Do not include revenue generated through state taxes as this is reported in Item C. State taxes encompass taxes collected locally on behalf of the state, even where a portion of those taxes are credited to local road funds.
• This cell is shaded because it is the title cell and broken into additional sub-categories (see below). A1. Local highway-user taxes
All local fee and tax revenue used for road or street purposes during a fiscal year. Include only local fees and taxes.
• This cell is shaded because it is the title cell and broken into additional sub-categories (see below). A1a. Motor-fuel
Enter the amount recorded in Section 1, Category A5 (Remainder used for highway purposes).
• Because motor-fuel tax is collected at the state level in Kentucky, record nothing in this cell. A1b. Motor-vehicle
Enter the amount recorded in Section 1, Category B5 (Remainder used for highway purposes).
• FY 2011 = $28,214,072. A1c. Total
Calculate A1c using the following equation:
A1c = A1a - A1b
• FY 2011 = $28,214,072. A2. General fund appropriations
All appropriations from the local general fund used for roads and streets. Do not include excess general funds in this item.
• FY 2011 = $0 A3. Other local imposts
Local fees and taxes imposed that are dedicated for use on roads and streets. The amount reported on Page 1 should match the sum of detailed items reported on Page 2.
A3a. Property taxes and assessments
Revenues generated from property taxes and special assessments used for constructing and maintaining roads and streets or which are dedicated to highway debt service, including road district levies.
• FY 2011 = $18,427,789.
• Property taxes and assessments were first recorded on form FHWA 536 in FY 2007. Contributions in FY 2009 increased by $2,596,448. This revenue increase continued into FY 2011 by $1,191,385.
Figure 4: Property Taxes and Assessments Receipts FY 2005 - FY 2011 A3b. Other local imposts
Revenue generated from other local government taxes and fees, including personal property taxes levied on motor vehicles, impact fees, sales taxes, and any other local taxes and fees used for highway purposes. Identify the specific tax or fee in the detail for this item.
• This cell is shaded because it is the title cell and broken into additional sub-categories (see below). Page 2 of the FY 2011 FHWA-536 indicates that other local imposts include, parking, ROW Permits, impounds and fines, vehicle licensing, and transit authority/river ports.
• FY 2011 = $48,709,374 A3b(1). Parking
Revenues from local government parking fees.
• FY 2011 = $20,363,000 A3b(2) ROW Permits
Revenues from local government right of way permits
• FY 2011 = $1,051,414 A3b(3) Impounds and Fines
Revenues from local government impounds and fines used for road and street purposes in FY 2011.
• FY 2011 = $5,752,795 A3b(4) Vehicle Licensing
Revenues from local government vehicle licensing fees used for road and street purposes in FY 2011.
• FY 2011 = $1,664,476
A3b(5) Transit Authority / River Ports
Revenues from local government vehicle licensing fees used for road and street purposes in FY 2011.
• FY 2011 = $19,877,689. $0 $2,000,000 $4,000,000 $6,000,000 $8,000,000 $10,000,000 $12,000,000 $14,000,000 $16,000,000 $18,000,000 $20,000,000 2005 2007 2009 2011
A3b(6). Total
This is the total other local imposts categorized in A3b. Calculate A3b(6) using the following equation:
A3b(6) = A3b(1) + A3b(2) + A3b(3) + A3b(4) + A3b(5)
• FY 2011 = $48,709,374
Figure 5 illustrates the relative proportions of each of these other local imposts’ revenue funds for FY 2011. The total revenue generated from these sources remained relatively stable between FY 2009 and FY 2011, however, the proportion of contributions changed significantly. In FY 2009 Transit Authority and River Ports contributed just 18% of revenue compared to 41% in FY 2011. Parking dropped from 48% in FY 2009 to 42% in FY 2011, Vehicle Licensing 2% in FY 2009 and 3% in FY 2011. ROW Permits remained stable at 2% both years. Impounds and Fines represented 30% of revenue in FY 2009 and just 12% in FY 2011.
Figure 5: FY 2011 Other Local Imposts A3c. Total
Calculate A3c using the following equation:
A3c = A3a + A3b(6)
• FY 2011 = $67,137,163
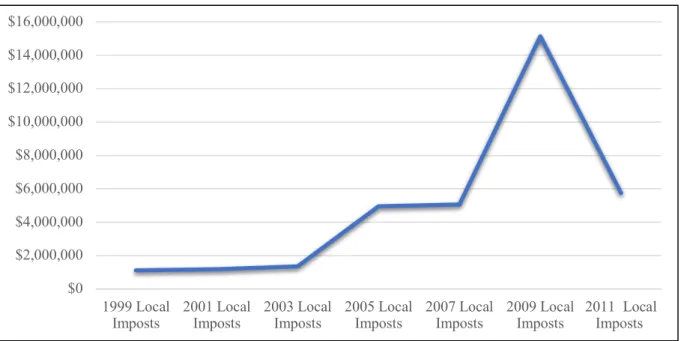
• Figure 6 captures trends in local impost revenues for FY 1999 through FY 2011. The sharp increase in total local imposts in FY 2005 was due to the increase in revenue generated through vehicle impounds. The increase in FY 2007 was due to the addition of property taxes and assessments as a revenue source, in addition to the inclusion of the transit authority revenue stream. The increased revenue evident below
Parking 42% ROW Permits 2% Impounds and Fines 12% Vehicle Licensing 3% Authority/River Transit Ports 41%
for FY 2009 is attributed to the increased property taxes and assessments noted above ($2,596,448), and an increase in impounds and fines revenue of more than $10,000,000. FY 2011 revenue reports the fist decrease in revenue from other local imposts in the reported years. This is due to a significant decrease in Parking ($3,873,017) and Impounds and Fines ($9,380,740) revenue during the year. The decrease is offset significantly by an increase in the Transit Authority/ River Port revenue stream ($10,491,311).
Figure 6: Total Other Local Imposts by Fiscal Year 1999 - 2011
• During FY 2005, the contribution from vehicle impounds used for road and street purposes increased significantly. This trend repeated itself in FY 2009. However, FY 2011 noted a large decrease in revenue. Both the revenue increases and decreases are noted in the graph below.
Figure 7: Revenue Generated from Vehicle Impounds FY 1999 - FY 2011 A4. Miscellaneous local receipts
$0 $10,000,000 $20,000,000 $30,000,000 $40,000,000 $50,000,000 $60,000,000 1999 Local
Imposts 2001 LocalImposts 2003 LocalImposts 2005 LocalImposts 2007 LocalImposts 2009 LocalImposts 2011 LocalImposts
$0 $2,000,000 $4,000,000 $6,000,000 $8,000,000 $10,000,000 $12,000,000 $14,000,000 $16,000,000 1999 Local
All local income not identified as specifically dedicated for roads and streets. Examples include traffic fines and penalties, investment income, net profit or loss from investment transactions, surplus parking or garage fees transferred to local agencies, and other miscellaneous local receipts. Other revenues can be described as miscellaneous, such as other refunds/reimbursements, sale of surplus equipment and property, excess road materials, borrowed money, and anything else that cannot not be categorized using the standard revenue codes. Detail these items on Page 2 of the report. The total entered on Page 1 should match the total on page 2.
A4a. Interest on Investments
Interest and investment income related to cash and investment balances in highway, road, and street accounts and funds.
• FY 2011 = $0.
A4b through A4f. Major miscellaneous revenue
Major miscellaneous sources of revenue for highway purposes. Include the source, type, and amount of revenue. If necessary, attach a supplementary schedule.
• FY 2011 = $59,508,288
• Figure 8 illustrates trends in this category since FY 1999. There are two significant revenue decreases noted. In FY 2005, miscellaneous local receipts decreased in comparison to FY 2003. Miscellaneous local receipts dipped down to just below FY 2001 levels of $19,939,784. In FY 2009, there is a reduction in revenue of $24,072,754. The FY 2009 revenue ($14,627,024) is only slightly above the revenue generated in FY 1999 ($13,570,079). However, revenue in FY 2011 soars to a level not previously recorded of $59,508,288.
Figure 8: Total Miscellaneous Local Receipts for FY 1999 - FY 2011 A5. Transfers from toll facilities
All fund transfers from toll facilities to local governments. Identify the toll facility and transferred funds in a separate note.
• FY 2011 = $0.
A6. Proceeds of sale of bonds and notes
$0 $10,000,000 $20,000,000 $30,000,000 $40,000,000 $50,000,000 $60,000,000 $70,000,000 1999 2001 2003 2005 2007 2009 2011
Net proceeds of debt issued by local government for highway purposes. Bonds are obligations with terms of two or more years. Notes are issued for a term less than two years. Net proceeds are the cash amount received by the local government. Only record the highway portion of the proceeds. Omit this value if the highway portion is not available or easily estimated.
• This cell is shaded because it is the title cell and broken into additional sub-categories (see below). A6a. Bonds – original issue
Proceeds received by local governments from the sale of bonds used solely for road and street purposes.
• FY 2011 = $0
A6b. Bonds – refunding issues
Proceeds received by local governments from the sale of bonds used to retire existing road and street bonds.
• FY 2011 = $0 A6c. Notes
Proceeds received by local governments from the issue of notes for local road and street purposes.
• FY 2011 = $0 A6d. Total
Calculate A6d using the following equation:
A6d = A6a + A6b + A6c
• FY 2011 = $0 A7. Total
Total revenue from local sources for road and street programs. Calculate A7 using the following equation: A7 = A1 + A2 + A3 + A4 + A5 + A6
• FY 2011 = $154,859,523
• Figure 9 illustrates the trend in total receipts from local sources used for road and street purposes from FY 1999 to FY 2011. Values for total receipts from local sources remain stagnant from FY 2003 to FY 2005. However, there was a significant increase in FY 2007, followed by a slight decline in revenue for FY 2009. FY 2011 shows a peak revenue for total receipts from local sources of $154,859,523, significantly higher than the next highest FY 2007 total of $106,708,993. This spike is predominantly a result of the increase in state appropriations noted in miscellaneous local receipts for FY 2011. Additionally, revenue generated from Local Motor Vehicle taxes is significantly higher than the previous year.
Figure 9: Total Receipts from Local Sources for Road and Street Purposes FY 1999 - FY 2011 B. Private Contributions
All funds local governments receive from the private sector for road and street programs. The ways in which the private sector becomes involved in road and street programs varies, but examples include donations (i.e., cash or property transfers), facility construction, performance of support services (examples provided by FHWA include surveys or engineering services). Also record private contributions in Section III.
• FY 2011 = $0
C. Receipts from State Government
All funds received by local governments from state government for local road and street programs. Forms of state transfer include a) grants-in-aid, b) loans, c) allocations or shares of state taxes, and d) payments under cooperative agreements. Examine FHWA-532 from the previous year. Item A.10 on FHWA-532 provides information on state transfers of state and federal funds to local governments for road and street purposes. $0 $20,000,000 $40,000,000 $60,000,000 $80,000,000 $100,000,000 $120,000,000 $140,000,000 $160,000,000 $180,000,000 1999 2001 2003 2005 2007 2009 2011
Figure 10: FY 2011 State Fund Receipts C1. Highway-user taxes
Enter the amount recorded in Section 1, Category C5. This amount represents all transfers of state highway-user taxes and fees used for roads and streets.
• FY 2011 = $140,706,985. C2. State General funds
State general funds allocated to local governments for highway purposes.
• FY 2011 = $0 C3. Other State funds
All other state funds transferred to local governments for highway purposes. This includes bond sales, sales taxes, excise taxes, severance taxes, and mineral lease taxes. Page 2 of the FY 2007 FHWA-536 indicates that other state funds in Kentucky include state bond proceeds, state grants, truck licenses, driver license fees, and the Local Government Economic Assistance Fund. Two major categories of funds are available for maintaining local roads and streets:
• County Road Fund
• Local Government Economic Assistance Fund
Road Fund County Road Aid represents the largest contribution to the Road Fund. The County Road Aid Program was established by the Kentucky General Assembly in 1936 to help counties build and maintain county roads and bridges. In 1980, the General Assembly approved the distribution of funds directly to county governments. Prior to 1980, KYTC administered funds. The Program is currently funded through annual revenues generated by state taxes on gasoline and other motor fuels – 18.3 percent of the revenue collected via taxes are allocated to the Program. The Kentucky Department of Local Government is responsible for apportioning the County Road Aid funds pursuant to the formula laid out in KRS 179.410 and KRS 177.360. The formula has undergone several revisions. In 1964, the General Assembly adopted the present "fifths" formula, which is also used to apportion Rural Secondary funds. The formula used to allot County Road Aid funds is as follows: One-fifth equally, one fifth based on rural population, one-fifth based on rural public road mileage, and two-fifths based on rural area. Rural is defined as rural population, rural mileage, and rural areas outside of cities, towns, and urban areas having a population of 2,500 or more as shown by the most recent decennial census of the United States. KYTC compiles and coordinates the rural data used in the formula. The Cabinet obtains data on rural populations and rural areas for each county
Truck License 16% Drivers License 0% LGEA 50% Other State Government 34%
from the U.S. Census Bureau. Contrary to a prevalent misconception, county-maintained road mileage alone is not the basis for the mileage used in the formula. All rural public road mileage is used, regardless of which governmental agency is responsible for maintaining it.
Two methods are used for County Road Aid allocations. The first is direct distribution of funds based on motor fuel tax revenues for the preceding month. The second involves a cooperative agreement between counties and the Department of Rural and Municipal Aid. At the beginning of each fiscal year, the projected 80 percent of yearly motor fuel revenues, less three percent, is distributed once material price contracts for the year are submitted by participating counties. The remaining three percent held in reserve is pooled and used in emergency situations. The remaining 20 percent of motor fuel allocations are made available to counties throughout the year.
C3a. Truck License Fees
Revenue from truck licensing fees directed toward road and street purposes. KRS 47.020 defines Truck License Distribution; it represents 30 percent of all revenue raised by taxes under sections (3)-(14) of KRS 186.050. Each year, these funds are evenly divided among Kentucky’s 120 counties.
• FY 2011 = $20,959540
• Figure 11 illustrates trends for FY 1999 through FY 2011. Revenue from truck licensing was increasing steadily between FY 1999 and FY 2005. However, FY 2007 saw a decline in revenue. This decline continued into FY 2009 and FY 2011.
Figure 11: Truck License Revenue for Road and Street Purposes FY 1999 - FY 2011 C3b-3f.
Identify sources of state funds transferred to local governments. C3b. Driver’s License
KRS 186.535 states that 25 cents raised from the original issuance or renewal of an operator's license goes into KYTC’s Road Fund for use in expanding the state driver education program; another 25 cents is refunded to the county of issuance for county road purposes.
• FY 2011 = $471,518 $0 $5,000,000 $10,000,000 $15,000,000 $20,000,000 $25,000,000 $30,000,000 $35,000,000 1999 State
• Figure 12 illustrates trends for FY 1999 through FY 2011. Revenue from driver licensing holds a relatively small share of total revenue used for road and street purposes. The trend below illustrates a peak in revenue in FY 2005, followed by a sharp decline in FY 2007. Revenue used for road and street purposes shows recovery in FY 2009 and a marginal increase in FY 2011.
Figure 12: Drivers License Revenue for Road and Street Purposes FY 1999 – FY 2011 C3c. Local Government Economic Assistance Fund (LGEA Fund)
The LGEA Fund is a revenue sharing program that was established by the General Assembly in 1980. Its purpose is to return a portion of state-collected coal and non-coal mineral severance taxes to eligible local governments (KRS 42.450 to KRS 42.495). The Division of County and Municipal Accounting within the Department of Local Government is responsible for apportioning these funds to eligible local governments. Funds are used by local governments to improve the environment for new industry and enhance resident quality of life. When the coal severance and processing taxes collected exceeds $15.8 million, half of the excess is transferred from the General Fund into the LGEA fund. By statute, the minimum transfer amount is 12 percent of the total severance and processing taxes collected. Half of annual tax collections from the sale and processing of minerals, exclusive of coal, also is transferred to LGEAF. Sixty percent of the coal severance tax is allocated among producing counties, while 30 percent is allocated to each coal-producing county based on per capita income, ton-miles of resource roads, and population. The remaining 10 percent is allocated to coal-impact counties, which are non-coal producing counties with at least 0.25 percent of the total coal ton miles hauled over public roads within their boundary. Distribution is based on geographic area, ton-miles of coal haul roads, and per capita income in inverse order.
The mineral severance and processing tax is distributed based on the tax collected on minerals severed. Ten percent of the coal and mineral funds allocated to each county is divided among its cities based on the ratio of the population of each incorporated area to the total population of all the incorporated areas within the county. Coal-producing counties and cities must dedicate 30 percent of the coal tax portion of LGEAF to the maintenance of local public highways which have been used for a significant amount of coal transport. The remaining 70 percent may be spent on public safety, environmental protection, public transportation, health, recreation, libraries, social services, administration, industrial and economic development, and vocational education. Coal-impact counties and cities must allocate 100 percent of their LGEAF proceeds to public transportation, streets, and roads. The mineral tax portion of LGEAF may be spent on any of the above categories. $0 $100,000 $200,000 $300,000 $400,000 $500,000 $600,000 1999 State
• FY 2011 = $65,216,377
• Figure 13 illustrates trends for FY 1999 through FY 2011. Transfers were down sharply in FY 2001 and FY 2003. However, in FY 2005 a recovery is noted in fund receipts for road and street purposes to FY 1999 levels of $43,745,453. FY 2007 followed with another dip in revenue, returning to FY 2003 levels. However, FY 2009 shows a strong recovery in this revenue source with more fund sources recorded than any previous year ($65,049,155). FY 2011 illustrates a marginal increase over FY 2009 revenue ($65,216,377).
Figure 13: Local Government Economic Assistance Fund Receipts FY 1999 - FY 2011 C3d. Other State Government
FY 2011 = $44,399,882 State Grants
FY 2011 = $0
• Figure 14 illustrates the trend in state grant revenue for FY 1999 through FY 2009. This funding source remained relatively stable from FY 1999 to FY 2005. However, no revenue was recorded for State Grants in FY 2007 and FY 2011. FY 2009 saw a large increase over revenue received from state grants in comparison to any other year.
$0 $10,000,000 $20,000,000 $30,000,000 $40,000,000 $50,000,000 $60,000,000 $70,000,000 1999 State
Figure 14: State Grant Revenue FY 1999 - FY 2011 C3e. Blank
This cell was left blank in FY 2011. C3f. Total
Total receipts from other state government funds. The sum of state grants, truck licensing, driver’s licensing and the local government economic assistance fund.
• FY 2011 = $131,047,317
• Funding from other fund sources declined in FY 2001 and FY 2003. This reduction is reflective of reduced proceeds from state bond proceeds, state grants and the local government economic
assistance fund. In FY 2005, total receipts from other state government funds exceed FY 1999 values by $12,595,008. FY 2007 other state funds received were lower than FY 2005, owing to the lack of state grants received. However, this reduction in other state funds was offset by highway-user taxes that year. FY 2009 saw the highest record of other state funds received up until that point. This is due to two main sources, 1) the large contribution of state grants; and 2) the LGEA Fund revenue. In FY 2011, the LGEA Fund continued to be a significant source of revenue. There is no record of state grants made available for road and street purposes in FY 2011, however, there is a fund source documented as “other state government” that represents a significant source of revenue.
$0 $5,000,000 $10,000,000 $15,000,000 $20,000,000 $25,000,000 $30,000,000 $35,000,000 $40,000,000 1999 State
Figure 15: Total Receipts from Other State Government Funds for Road and Street Purposes FY 1999 – FY 2011
C4. Total
Total receipts from state government funds. The sum of highway-user taxes, state general funds, and other state funds. Calculate C4 using the following equation:
C4 = C1 + C2 + C3f
• FY 2011 = $271,754,302
• See Page 1 of FHWA-536 for total and Page 2 for an itemized listing.
• Figure 16 illustrates total receipts from state government funds used for road and street purposes from FY 1999 to FY 2011. Fund sources remain relatively flat from FY 1999 to FY 2003. However, there is an increase in revenue in FY 2005. State government highway-user tax receipts increased in this same time period. FY 2005 values total $186,382,351, while FY 1999 values total $138,757,224. FY 2007 shows a slight decline in revenue from state government. This trend is intensified in FY 2009, with an overall reduction of $15,034,801 when compared to FY 2005. FY 2011 represents a slight increase in revenue over FY 2009 with a jump of $7,245,195 in total receipts received from state government for road and street purposes.
$0 $20,000,000 $40,000,000 $60,000,000 $80,000,000 $100,000,000 $120,000,000 $140,000,000 1999 State
Figure 16: Total Receipts from State Government FY 1999 - FY 2011 D. Receipts from Federal Government
Funds directed from federal agencies to local governments for highway activities. These funds may be transferred directly (from federal agency to local government) or indirectly (passing through state government). Consult FHWA-532; Item A10 provides data on federal funds to local governments for roads and streets.
D1. Federal Highway Administration
Enter the amount recorded in Section 1, Category D5. It represents all FHWA funds passed through the state to local governments for highway purposes.
• FY 2011 = $18,771,209 D2. Other Federal Agencies
Funds local governments receive from other federal agencies for highway purposes, either directly or indirectly (through the state). Federal grants, payments, refunds, and reimbursements consist of several types of revenues, including Department of Homeland Security (DHS) and Department of Housing and Urban Development (HUD) flood reimbursements, federal emergency assistance, and federally funded grants. State grants, payments, refunds and reimbursements are not defined by statute. Examples include items such as flood damage reimbursement, road energy recovery fund, miscellaneous payments, and special state funds (e.g., bridge fund, strip mine permits).
D2a. Department of Homeland Security
Funds paid to local governments by the United States Forest Service for roads and streets (see KRS 149.130 for a definition of National Forest fund). Federal funding paid to states are distributed to counties that are home to National Forests. Apportionment is contingent on the size of the reserve in a county. Counties must put half the receipts in the road fund and the other half in a fund for public schools. Typically, the Forest Service contributes a relatively small amount of revenue to local governments for road and street purposes.
• FY 2011 = $10,693,601 D2b. FEMA $0 $50,000,000 $100,000,000 $150,000,000 $200,000,000 $250,000,000 $300,000,000 1999 2001 2003 2005 2007 2009 2011
Funds directed to local governments from the Federal Emergency Management Agency (FEMA) to use for roads and streets.
• FY 2011 = $0 D2c. HUD
Funds directed to local government from HUD to use for roads and streets.
• FY 2011 = $0 D2d through D2f.
Identify additional federal agencies that provided funding to local governments for highway purposes. D2g. Total
Total revenue received from other federal agencies.
D2g = D2a + D2b + D2c + D2d + D2e + D2f
• FY 2011 = $10,693,601 D3. Total
Total revenue from federal sources directed to local governments for road and street programs. Calculate D3 using the following equation:
D3 = D1 + D2
• FY 2011 = $29,464,810
• Figure 17 indicates the proportion of total Federal revenues received by local government for road and street purposes during FY 2011.
Figure 17: Receipts Received from Federal Agencies FY 2011 36%
0% 64%
Figure 18 shows the trend in total receipts received from federal agencies from FY 1999 to FY 2011. FY 2009 and FY 2011 show receipts significantly higher than previous years. FY 2009 FHWA substantially increased the revenue to local government for road and street purposes. This combined with revenue from the Department of Homeland Security and the Federal Emergency Management Agency led to the largest contribution recorded (($37,035,824). Although FY 2011 saw a decrease in receipts from FHWA to more typical levels, funding from Department of Homeland Security
increased, which led to a higher than typical revenue stream from federal agencies.
Figure 18: Total Receipts Received from Federal Agencies FY 1999 - FY 2011 E. Total Receipts
Seen on Page 1, Section II total revenue local governments receive from local, private, state resources, and federal resources for road and street purposes. Calculate E using the following equation:
E = A7 + B + C + D
• FY 2011 = $456,078,635
• Figure 19 looks at the relative proportion of total receipts from each source. In comparison to recent years total receipts from local government provide a larger source that is typical – 34% in FY 2011 compared to 14% in FY 2005, 27% in FY 2007 and 25% in FY 2009. Receipts from federal sources range from a low of 3% in FY 2007 to a high of 9% in FY 2009.
$0 $5,000,000 $10,000,000 $15,000,000 $20,000,000 $25,000,000 $30,000,000 $35,000,000 $40,000,000 1999 2001 2003 2005 2007 2009 2011
Figure 19: Total Receipts for FY 2011
Table 3 looks at the proportions of funding sources between local, state, and federal sources for FY 1999 and FY 2005. Between FY1999 and FY 2003, there is a year on year increase in local source percentage of funding, which is matched by a small decline in state funding receipts. However, in FY 2005 the local source total percentage falls to 14%, with the state source percentage returning to 81% or FY 1999 percentages. In FY 2007 there is a dramatic shift in percentages, with local funding sources accounting for 27% of total receipts for this fiscal year. This dramatic increase in local source funding is owing to the addition of property taxes and assessments, the inclusion of the transit authority revenue stream and the substantial increase in parking fees. FY 2009 continues to see a large proportion of local source funding at 25% along with a significant increase in federal source funding from 3% in FY 2007 to 9% in FY 2009. The increase in federal funding in 2009 is a result of the funding received from FEMA and Homeland Security. FY 2011 records the highest local source funding percentage at 34%, the lowest recorded percentage of state source funding at 60% and an average year funding from federal sources at 6%.
Table 3: Proportions of Funding Sources
Local Source
Percentage State Source Percentage Federal Source Percentage
FY 1999 12% 81% 7% FY 2001 15% 80% 5% FY 2003 16% 78% 6% FY 2005 14% 81% 5% FY 2007 27% 70% 3% FY 2009 25% 66% 9% FY 2011 34% 60% 6%
Figure 20 illustrates total receipts for FY 1999 through FY 2009. After funding remained flat for 1999-2003, it gradually increased from FY 2005 to FY 2007. Funding plateaued from FY 2007 to FY 2009, but has since increased for FY 2011.
34%
60%
6%
Total Receipts from Local Sources Receipts from State Government Receipts from Federal Government
Figure 20: Total Receipts for Road and Street Purposes by Fiscal Year $0 $50,000,000 $100,000,000 $150,000,000 $200,000,000 $250,000,000 $300,000,000 $350,000,000 $400,000,000 $450,000,000 $500,000,000 1999 2001 2003 2005 2007 2009 2011
2.3 Section III: Expenditures for Road and Street Purposes
This section examines local government expenditures for highway purposes. Expenditures are placed into four categories: 1) local highway disbursements, 2) debt service on local obligations, 3) payments to state governments, and 4) payments to toll facilities. In some cases, projects are jointly funded by local and state governments. When this occurs, record local government expenditures FHWA-536 and state government expenditures on FHWA-532. If the state retains full control over a project, but contracts with a local government for some services, report the expenditures on FHWA-532 only.
Table 4: Local Government Expenditures
ITEM AMOUNT
A. Local highway
expenditures: A
1. Capital outlay (from page 2) A1
2. Maintenance: A2
3. Road and street services: A3 a. Traffic control operations A3a b. Snow and ice removal A3b
c. Other A3c
d. Total (a. through c.) A3d 4. General administration &
miscellaneous A4
5. Highway law enforcement
and safety A5
6. Total (1 through 5) A6 B. Debt service on local
obligations: B 1. Bonds: B1 a. Interest B1a b. Redemption B1b c. Total (a. + b.) B1c 2. Notes: B2 a. Interest B2a b. Redemption B2b c. Total (a. + b.) B2c 3. Total (1.c + 2.c) B3 C. Payments to State for
A. Local Highway Expenditures
All expenditures made by local government for highway activities. A1. Capital Outlay
All capital outlays by local governments for highways, roads, and streets. This information should be consistent with information provided on FHWA-531 and FHWA-532. Omit from this section capital outlay for toll facilities, mass transit, and most administrative costs. Include the following: 1) construction materials and supplies, 2) construction machinery and equipment, and 3) administrative costs directly assignable to specific capital outlay projects.
• FY 2011 = $503,323,826
• Capital Outlay by local governments for road and street purposes has been increasing steadily throughout the study period.
Figure 21: Capital Outlay by Local Government for Road and Street Purposes FY 1999 - FY 2011 A1a. Right-of-way
Includes the following expenses: 1) right-of-way administration; 2) purchase of land, improvements, and easements; and 3) the costs of moving and relocating buildings, businesses, and people. Report the amount spent on the National Highway System in Column A, and the amount spent off the National Highway System in Column B.
• FY 2011 = $0
• Data for capital outlay is not reported on County or City reports to accommodate further disbursement reporting.
A1b. Engineering
Includes the following expenses: 1) field engineering and costs; 2) surveys, material testing, and borings; 3) preparation of plans, specifications, and estimates; and 4) traffic and related studies. Report the amount
$0 $100,000,000 $200,000,000 $300,000,000 $400,000,000 $500,000,000 $600,000,000 1999 2001 2003 2005 2007 2009 2011
D. Payments to toll facilities D E. Total expenditures (A.6 +
spent on the National Highway System in Column A, and the amount spent off the National Highway System in Column B.
• FY 2011 = $0
• Data for capital outlay is not reported on County or City reports to accommodate further disbursement reporting.
A1c. Construction
Expenditures for construction of roads and bridges. This includes roadway earth work and grading; drainage and related protective structures; base and surface or resurfacing; shoulder and approach surfacing, including turnouts; interchanges; frontage roads; climbing lanes and parking areas; utility relocation; major and minor widening; safety-related improvements; and environmentally related improvements. Construction of structures includes bridges; viaducts; grade separation structures; overpasses and underpasses; vehicular tunnels and subway, sewer and drainage systems; walls and roads over dams; ferries and landings. It also includes protective systems installed on structures exposed to harsh environments and chemical damage.
• FY 2011 = $0
• Data for capital outlay is not reported on County or City reports to accommodate further disbursement reporting.
A1c1. New Facilities
Expenditures for new highways, roads, and bridges on the National Highway System.
• FY 2011 = $0
• Data for capital outlay is not reported on County or City reports to accommodate further disbursement reporting.
A1c2. Capacity Improvements
Expenditures for improvements that add capacity to facilities (e.g., adding lanes). Only record funds spent on the National Highway system.
• FY 2011 = $0
• Data for capital outlay is not reported on County or City reports to accommodate further disbursement reporting.
A1c3. System Preservation
Expenditures used to preserve the existing system without significantly improving capacity. Only record funds spent on the National Highway System.
• FY 2011 = $0
• Data for capital outlay is not reported on County or City reports to accommodate further disbursement reporting.
A1c4. System enhancement and operation
Expenditures made to address environmental sustainability – improvements not directly related to roads and bridges, such as safety, traffic management, traffic engineering, railroad grade crossings, vehicle weight enforcement facilities. Only record funds spent on the National Highway System.
• FY 2011 = $0
• Data for capital outlay is not reported on County or City reports to accommodate further disbursement reporting.
A1c5. Total Construction
Column A is total construction costs for the National Highway System. Calculate A1c5 using the following equation:
A1c5 = A1c1 + A1c2 + A1c3 + A1c4
• FY 2011 = $0
• Data for capital outlay is not reported on County or City reports to accommodate further disbursement reporting.
A1d. Total
Calculate A1d using the following equation:
A1d = A1a + A1b + A1c5
• FY 2011 = $503,323,826. A2. Maintenance
Maintenance encompasses activities done to preserve the highway system in a condition that is close as possible to the original condition (FHWA, 2020). Includes the cost of materials, supplies, and equipment for maintenance activities. Maintenance activities for toll facilities are reported separately.
• FY 2011 = $0
A3. Road and street services
Local government operational expenditures for roads, streets and bridges.
• This cell is shaded because it is the title cell and broken into additional sub-categories (see below). A3a. Traffic control operations
Expenditures for traffic control operations.
• FY 2011 = $0
A3b. Snow and ice removal
Expenditures for snow and ice removal, gritting, deicing, and the installation and removal of snow fences.
• FY 2011 = $0 A3c. Other
Road and street services such as highway air quality monitoring, highway beautification, mowing, and litter removal.
• FY 2011 = $0 A3d. Total
Calculate A3d using the following equation:
A3d = A3a + A3b + A3c
• FY 2011 = $0
A4. General Administration and Miscellaneous
Expenditures not classified as capital outlay, maintenance, or operations. Include highway planning traffic studies and research in this item.
A5. Highway law enforcement and safety
Local government outlays for highway and traffic police used for traffic supervision and enforcement of highway, traffic and safety laws. Costs are sometimes aggregated with general police activities. If this occurs, estimates are reliable.
• FY 2011 = $0 A6. Total
Total local highway disbursements costs. Calculate A6 using the following equation: A6 = A1+ A2 + A3 + A4 + A5
• FY 2011 = $503,323,826
B. Debt service on local obligations
Interest and redemption payments for local highway, road, and street bonds issued by local government. See Section II Bonds and notes. Debt service also includes all expenditures resulting from the sale and retirement of highway debt. The only debt service reported is from Item II A6, and the amount recorded in Section IV.
B1. Bonds
Debt service on bonds.
• This cell is shaded because it is the title cell and broken into additional sub-categories (see below). B1a. Interest
Bond interest costs and financing costs.
• FY 2011 = $0 B1b. Redemption
Bond redemption payments at net value.
• FY 2011 = $0 B1c. Total
Calculate B1c using the following equation:
B1c = B1a + B1b
• FY 2011 = $0 B2. Notes
Debt service costs on notes.
• This cell is shaded because it is the title cell and broken into additional sub-categories (see below). B2a. Interest
Note interest costs and any financing costs.
• FY 2011 = $0 B2b. Redemption
Note redemption payments at net value.
B2c. Total
Calculate B2c using the following equation:
B2c = B2a + B1b
• FY 2011 = $0 B3: Total
Calculate B3 using the following equation:
B3 = B1c + B2c
• FY 2011 = $0
C. Payments to States for highways
Fund transfers from local government to the state for highway, road, and street purposes. This value should reflect data reported on form FHWA-531.
• FY 2011 = $0
D. Payments to toll facilities
Funds transferred from local government to either a state or a local toll facility. Identify the toll facility and amount transferred in a note.
• FY 2011 = $0 E. Total Expenditures
Calculate E using the following equation:
E = A6 + B3 + C + D
• FY 2011 = $503,323,826
• Figure 22 captures total disbursements for road and street purposes for FY 1999 through FY 2011. Note that while disbursements stagnated between FY 2005 and FY 2007, there has been an upward trend over this period.
Figure 22: Total Disbursements for Road and Street Purposes by Fiscal Year
• Figure 23 presents data on total receipts and disbursements for FY 1999 through FY 2011. Total receipts are represented by the blue bars, and total disbursement by orange bars. A general trend of increasing revenues and expenditures over this time period is observable.
Figure 23: Disposition of Highway-User Revenues Available for Local Government Expenditure (Income vs Expenditure) $0 $100,000,000 $200,000,000 $300,000,000 $400,000,000 $500,000,000 $600,000,000 1999 2001 2003 2005 2007 2009 2011 $0 $100,000,000 $200,000,000 $300,000,000 $400,000,000 $500,000,000 $600,000,000 1999 2001 2003 2005 2007 2009 2011 Total Receipts for Road and Street Purposes by Fiscal Year
2.4 Section IV: Local Highway Debt Status
This section records the status of local government highway debt. For FY 2011, the local highway debt recorded in this section is $0. Brief descriptions of each category are provided below.
Table 5: Local Highway Debt Entry
IV. LOCAL HIGHWAY DEBT STATUS (Show all entries at par)
Opening Debt Amount Issued Redemptions Closing Debt
A. Bonds (Total)
1. Bonds (Refunding Portion)
B. Notes (Total)
A. Bonds (Total)
Total amount of bonds at face value. This includes bonds outstanding at the beginning of the year, bonds issued during the year, bonds redeemed during the year, and bonds outstanding at the end of the year. A.1. Bonds (Refunding Portion)
Bonds entered in A. Bonds (Total) that were involved in refunding. B. Notes (Total)
Face value or par value of all notes. This includes notes outstanding at the beginning of the year, notes issued during the year, notes redeemed during the year, and notes outstanding at the end of the year. A completed version of the FHWA-536 for FY 2011 is provided on the following pages.