VIRTUAL INSTRUMENT BASED
MAXIMUM POWER POINT TRACKING OF A
SOLAR PANEL
A Thesis Submitted in Partial Fulfillment of the Requirements for the
Award of the Degree of Master of Technology
in
Electrical Engineering
(Power Electronics & Drives)
By:
Bijayini Behera
Roll No. 212EE4240
DEPARTMENT OF ELECTRICAL ENGINEERING
NATIONAL INSTITUTE OF TECHNOLOGY, ROURKELA
PIN-769008, ODISHA
(2012-2014)
VIRTUAL INSTRUMENT BASED
MAXIMUM POWER POINT TRACKING OF A
SOLAR PANEL
A Thesis Submitted in Partial Fulfillment of the Requirements for the
Award of the Degree of Master of Technology
in
Electrical Engineering
(Power Electronics & Drives)
By:
Bijayini Behera
Under the Supervision of
Dr. S. Gopalakrishna
DEPARTMENT OF ELECTRICAL ENGINEERING
NATIONAL INSTITUTE OF TECHNOLOGY, ROURKELA
PIN-769008, ODISHA
(2012-2014)
Humbly dedicated to
My parents
& My Loving Sister
National Institute Of Technology, Rourkela
Certificate
This is to certify that the thesis entitled “VIRTUAL INSTRUMENT BASED
MAXIMUM POWER POINT TRACKING OF A SOLAR PANEL” submitted by Bijayini Behera to the National Institute of Technology, Rourkela for the award of degree of Masters of technology in Electrical Engineering of specialization, Power Electronics and Drives, is a bonafide record of research carried out by her under my supervision. The content of this thesis, in full or in parts, have not been submitted to any other Institute or University for the award of any degree or diploma.
Date: Place:
Dr. S. Gopalakrishna Assistant Professor Department of Electrical Engineering National Institute of Technology, Rourkela
ACKNOWLEDGEMENT
I would like to offer my humble salutations to the supreme lord for giving me the creative energy, intellect and patience to complete this project work successfully. I wish to express my gratitude and sincere thanks to my supervisor, Dr. S. Gopalakrishna, Department of Electrical Engineering, for his constant encouragement, guidance and support. His ideas and suggestions were helpful for timely accomplishment of the target aimed.
Further, I would like to thank Prof. A. K. Panda, Head of the Department, and all the faculties of Electrical Engineering department for their valuable suggestions and comments for improvement at each stage of the research work.
I also extend thanks to Ravindra Sir and Bhanu for their constant support in my research work. In this context I am also thankful to my friends Amit, Amrit, Saroj, Suvra and Subham of Electrical Department who helped me forget my worries and to have a relaxed mind throughout.
I wish to express my gratitude towards Maa, Bapa, Bhai and Bhauja for keeping faith in my abilities and encouraging me to improve at every step. I am grateful to my heavenly elder sister for inspiring me to work hard and to keep patience throughout the work.
NATIONAL INSTITUTE OF TECHNOLOGY, ROURKELA
i
ABSTRACT
One of the most important challenges for researchers is to generate energy from fresh, resourceful & environmentally pleasant sources. While greenhouse emissions are reduced, more attention is attracted towards solar system because it offers great chance to produce electricity among all renewable energy sources. In spite of all advantages of solar power systems, they do not show advantageous efficiency. Insolation, Temperature, spectral characteristics of sunlight, shadow, dirt & etc. are the factors, on which efficiency of solar cell depends up on. The output power of photovoltaic (PV) array reduces with the changes in irradiance on panels due to rapid climate changes for example increase in temperature and cloudy weather. It can also be said as, according to operational and environmental conditions, each PV cell produces an energy. From the poor efficiency point of view some procedures are given, from which a concept called as “Maximum Power Point Tracking” (MPPT). The goal of all MPPT methods are identical to improving the output power of PV array in every condition by tracking the maximum power.
Solar cells have non-linear i-v characteristics. By the series connection of PV cell, output voltage of PV panel increases. Similarly, by the parallel connection of PV cell output current of PV array increases. Many MPPT algorithms are there to track maximum power point such as perturb and observe (P&O), incremental conductance, constant voltage, constant current and parasitic capacitance algorithm etc. Perturb and observe algorithm is a simple algorithm but it tracks wrong direction with the sudden change in weather and it oscillates about the MPP (Maximum power point), which can be eliminated by using incremental conductance algorithm. Under partial shadow condition, P-V (power-voltage) characteristic curve is having multiple peaks. At that time, it is difficult task to track actual maximum power point.
In this paper, hardware implementation is done and the characteristics of PV array is tested in real time system i.e. LabVIEW by using DAQ card, which is a data acquisition card, whose purpose is to acquire as well as to generate signals and here, signals are acquired as well as generated and that generated signal is compared with a saw tooth wave signal to create a PWM signal to regulate the output power of DC/DC converter at its maximum possible value.
NATIONAL INSTITUTE OF TECHNOLOGY, ROURKELA ii
TABLE OF CONTENTS
ABSTRACT i TABLE OF CONTENTS ii LIST OF FIGURES iv LIST OF TABLES viLIST OF SYMBOLS vii
CHAPTER 1 INTRODUCTION 1.1. OVERVIEW 2 1.2. MOTIVATION 2 1.3. OBJECTIVE 3 1.4. LITERATURE REVIEW 3 1.5. THESIS LAYOUT 5 CHAPTER 2
MODELLING OF SOLAR CELL
2.1. INTRODUCTION 7
2.2. SOLAR CELL MODEL 7
2.3. EQUIVALENT CIRCUIT 9
2.4. DISCUSSION 9
CHAPTER 3
POWER VARIANCE WITH TEMPERATURE & IRRADIANCE
3.1. INTRODUCTION 11
3.2. BLOCK DIAGRAM 11
3.3. SIMULATION RESULTS 12
3.3.1. CONSTANT TEMPERATURE CONSTANT IRRADIANCE 12 3.3.2. CONSTANT TEMPERATURE VARIABLE IRRADIANCE 13 3.3.3. VARIABLE TEMPERATURE CONSTANT IRRADIANCE 14 3.3.4. VARIABLE TEMPERATURE VARIABLE IRRADIANCE 15
NATIONAL INSTITUTE OF TECHNOLOGY, ROURKELA
iii CHAPTER 4
MPPT USING INCREMENTAL CONDUCTANCE
4.1. INTRODUCTION 18
4.2. BLOCK DIAGRAM 18
4.3. FLOW CHART OF THE DESIGNED ALGORITHM 19
4.4. SIMULATION RESULTS 20
4.4.1. VARIATION DURING SERIES CONNECTION 20 4.4.2. VARIATION DURING PARALLEL CONNECTION 23
4.5. DISCUSSION 25
CHAPTER 5
IMPLEMENTATION OF MPPT USING LABVIEW
5.1. INTRODUCTION 27 5.2. BLOCK DIAGRAM 27 5.3. SIMULATION RESULTS 29 5.4. DISCUSSION 31 CHAPTER 6 CONCLUSION 6.1. CONCLUSION 33
6.2. SCOPE OF FUTURE WORK 33
APPENDIX 1
PARAMETERS VALUES OF THE PV ARRAY 34
APPENDIX 2
GAUSSIAN FUNCTION FOR TEMPERATURE & INSOLATION 35 VOLTAGE VS. CURRENT CHARACTERISTICS OF PV ARRAY 35
NATIONAL INSTITUTE OF TECHNOLOGY, ROURKELA
iv
LIST OF FIGURES
Fig.2.1. Equivalent Circuit of a Photovoltaic Cell 9 Fig.3.1. Block Diagram for Describing the Effect of Temperature and Irradiance 11 Fig.3.2. Variation of Current with constant temperature & constant irradiance 12 Fig.3.3. Variation of Input Voltage with constant temp. & constant irradiance 12 Fig.3.4. Variation of Output Voltage with constant temp. & constant irradiance 13 Fig.3.5. Variation of Current with constant temp. & variable irradiance 13 Fig.3.6. Variation of Input Voltage with constant temp. & variable irradiance 14 Fig.3.7. Variation of Output Voltage with constant temp. & variable irradiance 14 Fig.3.8. Variation of Current with variable temp. & constant irradiance 14 Fig.3.9. Variation of Input Voltage with variable temp. & constant irradiance 15 Fig.3.10. Variation of Output Voltage with variable temp. & constant irradiance 15 Fig.3.11. Variation of Current with variable temp. & variable irradiance 15 Fig.3.12. Variation of Input Voltage with variable temp. & variable irradiance 16 Fig.3.13. Variation of Output Voltage with variable temp. & variable irradiance 16 Fig.4.1. Block Diagram for Incremental Conductance Method 19 Fig.4.2. Flow Chart of MPPT Algorithm (Incremental Conductance Method) 19 Fig.4.3. Variation of current without MPPT Algorithm in series connection 20 Fig.4.4. Variation of current with MPPT Algorithm in series connection 21 Fig.4.5. Variation of voltage without MPPT Algorithm in series connection 21 Fig.4.6. Variation of voltage with MPPT Algorithm in series connection 21 Fig.4.7. Variation of power without MPPT Algorithm in series connection 22 Fig. 4.8. Variation of power with MPPT Algorithm in series connection 22 Fig.4.9. Variation of energy without MPPT Algorithm in series connection 22 Fig.4.10. Variation of energy with MPPT Algorithm in series connection 23
NATIONAL INSTITUTE OF TECHNOLOGY, ROURKELA
v
Fig.4.11. Variation of current without MPPT Algorithm in parallel connection 24 Fig.4.12. Variation of current with MPPT Algorithm in parallel connection 24 Fig.4.13. Variation of voltage without MPPT Algorithm in parallel connection 24 Fig.4.14. Variation of voltage with MPPT Algorithm in parallel connection 25
Fig.5.1. Block Diagram for MPPT in LabVIEW 28
Fig.5.2. Input and Output Scale in LabVIEW 29
Fig.5.3. Screen Shot of LabVIEW Front Panel 30
Fig.5.4. Variation of Current for MPPT in LabVIEW 30 Fig.5.5. Variation of Power for MPPT in LabVIEW 31 Fig.5.6. Variation of Voltage for MPPT in LabVIEW 31
Fig.A.1. Gaussian Function 35
NATIONAL INSTITUTE OF TECHNOLOGY, ROURKELA
vi
LIST OF TABLES
NATIONAL INSTITUTE OF TECHNOLOGY, ROURKELA
vii
LIST OF SYMBOLS
Vpv = Output Voltage of PV Panel Ipv = Output Current of PV Panel Voc = Open Circuit Voltage Isc = Short Circuit Current
Iph = Photocurrent or Light-Generated Current
Is = Cell Saturation of Dark Current
q = Electron Charge = 1.6 ×10⁻¹⁹ C
k = Boltzmann’s Constant = 1.38 ×10⁻²³J/K
Tc = Working Temperature of cell A = Ideal Factor
Rsh = Shunt Resistance
Rs = Series Resistance
Isc = Short-Circuit Current of cell at a 25°C and 1kw/M2,
Ki = Temperature Coefficient of cell at Short-Circuit Current,
Tref = Reference Temperature of cell, λ = Solar Insolation in Kw/M2
Irs = Reverse Saturation Current of cell
CHAPTER 1 INTRODUCTION
NATIONAL INSTITUTE OF TECHNOLOGY, ROURKELA 1
CHAPTER 1
INTRODUCTION
OVERVIEW
MOTIVATION
OBJECTIVE
LITERATURE REVIEW
THESIS LAYOUT
CHAPTER 1 INTRODUCTION
NATIONAL INSTITUTE OF TECHNOLOGY, ROURKELA 2
1.1. OVERVIEW
The regular price hike in fuel and global warming and environmental pollution leads the path towards the use of renewable energy sources. Among the renewable energy sources, solar energy is available abundantly and it is priceless. So solar panels are used hugely and its use is common. The smallest unit of photovoltaic system is PV cell (photovoltaic cell), whose function is to convert the light energy to electricity. The main objective of the system should be to track maximum power point.
The maximum power of PV panel depends up on the temperature, solar insolation and voltage etc. The output voltage can be increased by forming panel by connecting PV cells in series. Similarly, the output current can be increased by forming panel by connecting PV cells in parallel. But normally, the PV array or PV panel are shaped by a set of PV cells connected in series and parallel. It gives better efficiency. Small loads such as bulbs and DC motor can be driven by using voltage and current available at the terminals of a PV device. Inverters are used to drive Ac loads.
1.2. MOTIVATION
The critical situation of industrial fuels such as oil, gas etc. leads to the enhancement of development of new energy sources. So, a greater contribution of the total energy consumption of the world is the renewable energy sources. Within 20 years, the demand of solar energy increased by 25%. Worldwide, the importance of PV systems is increasing. Nearly 4800 GW is generated now-a-days. Grid connected PV capacity between 2004 and 2009 increased to 21 GW and is increasing at 60% as annual average rate. Researches are going on the area of cost, efficiency and reliability to get the advantage from the application of PV systems. Users of solar energy extracts its maximum efficiency by using best areas that are residence’s roof-tops and office buildings.
Solar irradiation level, temperature, output voltage (Voc) and current (Isc) are the main factors to change the output power of PV panel. The operation of PV systems to raise the efficiency near the maximum power point is very critical. For this application maximum power point tracking (MPPT) is used. A current or voltage is given by MPPT algorithm to the power electronic interface, which is in between PV array and load. To operate near the MPP, the output voltage or current of PV system is maintained according to atmospheric situations.
CHAPTER 1 INTRODUCTION
NATIONAL INSTITUTE OF TECHNOLOGY, ROURKELA 3
Previous values of short circuit current, open circuit voltage of PV panel and solar irradiation is useful for MPPT methods. Actual values of voltage and current of PV panel can follow the maximum power point in some methods as perturb and observe and incremental conductance. Extra circuit assembly makes some methods more expensive for this reason they are used in large PV systems. These methods can also valid for power electronic interfaces with the use of low-cost microcontroller and field programmable gate arrays.
Perturb & observe and incremental conductance etc. algorithms are most general MPPT algorithms. To determine the incremental duty ratio or PWM signal basing up on one or more parameters of PV panel is the main goal.
1.3. OBJECTIVE
The objective of this thesis is to track maximum power point from the characteristic curve of PV array. As the maximum power depends up on various factors such as solar insolation, temperature, voltage (Voc) and current (Isc) etc. So, with the change in atmospheric condition, the power increases or decreases as its relation varies with that factor accordingly.
So, it is essential to track maximum power point to draw more efficiency from PV panel. For this purpose, there are many MPPT algorithms are available. Such as perturb and observe (P&O), incremental conductance, constant voltage, constant current and parasitic capacitance algorithm etc. Here, incremental conductance algorithm is used as it tracks in right direction, which is not possible in P&O algorithm.
1.4. LITERATURE REVIEW
There are many literatures on this topic of modelling and simulation of PV array H.L.Tsai
et.al. [1] proposed a method of development of generalized PV model. This paper develops a PV model, which represents a model of PV cell for easy use on simulation area.
The modelling and simulation of PV arrays was introduced by M.G.Villalva et.al. [2]. The main aim of this paper was to find the parameters of the nonlinear I-V equation by adjusting the curve at different points. This paper is beneficial for developing accurate, simple, fast and easy-to-use modelling method for using in simulations of PV array.
The direct control method of incremental conductance of MPPT using converter has been proposed by A.Safari et.al. [3]. The authors have developed a whole PV system including the design of converter, and developing the experimental set up using the controller programming.
CHAPTER 1 INTRODUCTION
NATIONAL INSTITUTE OF TECHNOLOGY, ROURKELA 4
The study of IV and PV characteristics of PV array under the effect of partial shading has been studied by H.Patel et.al. [4] The Matlab-based modelling scheme can be used for developing and estimating new maximum power point tracking techniques, under this scenario. D.Sera et.al. [5] introduced an improved MPPT method for fastly changing environmental conditions. This paper offers an effective and simple solution to the wrong tracking in Perturb and Observe (P&O) MPPT method during quickly changing irradiation.
The optimization of perturb and observe algorithm for maximum power point tracking method is proposed by N.Femia et.al. [6]. Considering its low-cost implementations and as it can be easily modelled, this method is most commonly used for practical circuits.
T.Esram et.al. [7] elaborated comparison of photovoltaic array maximum power point tracking methods. The many different methods for maximum power point tracking of photovoltaic (PV) arrays are discussed.
In [8], M.A. Elgendy et.al. have used an experimental model to estimate the incremental conductance algorithm for MPPT through which a thorough evaluation of the system has been studied for a standalone PV pumping
M.A.S.Masoum et.al. in [9] have developed two reliable and simple MPPT techniques for photovoltaic systems with voltage- and current-based power point tracking. The comparison was based on experimental and theoretical analyses of voltage-based (VMPPT) and current-based (CMPPT) techniques.
CHAPTER 1 INTRODUCTION
NATIONAL INSTITUTE OF TECHNOLOGY, ROURKELA 5
1.5. THESIS LAYOUT
In chapter 1, a brief summary of the PV system has been presented. It also outlines the objectives of the proposed research work and outlines the factors that motivated to carry out the work. Finally it texts out the research work that has been carried till date work out the research work in a pre-defined organised fashion.
Chapter 2 focusses on the mathematical modelling of the PV array so as to work out the further MPPT algorithm in the MATLAB/Simulink environment. The mathematical modelling is analysed through the characteristic equations governing the equivalent circuit.
In chapter 3 the effect of the variation of the temperature and irradiance of the PV system is studied and the output voltage and power are analysed.
In chapter 4 the PV system is studied for domestic applications using a heater as the load. The variation of output voltage, current, power generated and energy developed is analysed with and without the designed MPPT algorithm.
In Chapter 5, the real time performance of PV Panel is studied using LabVIEW 2010 and USB 6009. As LabVIEW programming uses blocks (function VI), it is easy to implement when compared to other methods of MPPT tracking. The performance of the system is thoroughly outlined.
Finally the entire analysis made throughout the thesis are concluded in Chapter 6. Here also a simple idea to extend this work for future research has been presented.
CHAPTER 2 MODELLING OF SOLAR CELL
NATIONAL INSTITUTE OF TECHNOLOGY, ROURKELA 6
CHAPTER 2
MODELLING OF SOLAR CELL
INTRODUCTION
SOLAR CELL MODEL
EQUIVALENT CIRCUIT
DISCUSSION
CHAPTER 2 MODELLING OF SOLAR CELL
NATIONAL INSTITUTE OF TECHNOLOGY, ROURKELA 7
2.1. INTRODUCTION
Structures of Photovoltaic Cells
Photoelectric effect is the physical process of conversion of sunlight into electricity by a photovoltaic cell (PV cell). Absorbed light generates electricity among the reflected, absorbed and passed through lights on a PV cell. Electrons situated in the atoms of PV cell absorbed the energy from the absorbed light. These electrons become part of the current in a circuit by achieving the new energy changing their position in the atom of semiconductor material. Built-in electric field is an exceptional electrical property of PV cell, by which a force is generated to make the current through the load such as light bulb. Two layers of semiconductor materials are kept in contact with each other to generate the Built- in electric field. “n-type” semiconductor layer is having huge amount of electrons, which is having negative charge. “p-type” semiconductor layer is having huge amount of holes, which is having positive charge.
Semiconductor Materials for PV Cells
Silicon-polycrystalline thin films and single-crystalline thin film are the main types of materials used for solar panels. Silicon can be used as amorphous, single crystalline and multi-crystalline. Polycrystalline thin films are used with copper indium diselenide, cadmium telluride and thin-film silicon. Single-crystalline thin film is made up of gallium-arsenide (GaAs).
2.2. SOLAR CELL MODEL
From past forty years, a common mathematical description of I-V characteristics of a PV cell has studied. For MPPT technologies, such an equivalent circuit model is used. Generally the assemblage of a photo current, a diode, a parallel resistor symbolizing a leakage current and a series resistor pointing an internal resistance to current flow denotes the equivalent circuit of the general model.
CHAPTER 2 MODELLING OF SOLAR CELL
NATIONAL INSTITUTE OF TECHNOLOGY, ROURKELA 8
The voltage-current characteristic equation of a solar cell is given as
I = Iph − Is [exp q (V + Irs) / kTcA −1] − (V + Irs) / Rsh (1)
Iph is a photocurrent or light-generated current, Is is the cell saturation of dark current, q (= 1.6 ×10⁻¹⁹C) is an charge of an electron, k (= 1.38 ×10⁻²³J/K) is a Boltzmann’s constant, Tc is the working temperature of a cell, Ais an ideal factor, Rsh is a shunt resistance, and Rs is a series resistance. Solar irradiance and working temperature of a cell are the two main factors on which photocurrent depends upon, which is described as
Iph = [Isc + Ki (Tc −Tref)]λ (2)
Where, Isc is the short-circuit current of a cell at a 25°C and 1kW/M2, Ki is the short-circuit current temperature coefficient of a cell, Tref is the reference temperature of a cell, and λ is the solar insolation in kW/M2. In contrast, cell temperature is the main factor for the variation of cell’s saturation current, which is described as
Is=Irs (Tc/Tref)3 exp [qEg (1/Tref -1/Tc)/ kA] (3)
Where, Irs is the reverse saturation current of a cell at a reference temperature and a solar insolation, Eg is the band-gap energy of the semiconductor used in the cell. The ideal factor A
is dependent on PV technology. On the other hand, by assuming the output current zero the Voc is derived. By ignoring shunt-leakage current and the PV open-circuit voltage Voc at reference temperature, the reverse saturation current at reference temperature can approximately obtained as
CHAPTER 2 MODELLING OF SOLAR CELL
NATIONAL INSTITUTE OF TECHNOLOGY, ROURKELA 9
2.3. EQUIVALENT CIRCUIT
Fig 2.1. Equivalent Circuit of a Photovoltaic Cell
IPH = Photon Current
IDiode = Diode Current
I = PV Current V = PV Voltage RS = Series Resistance
RSH = Shunt Resistance
2.4. DISCUSSION
In this chapter the equivalent circuit of the PV array has been developed based on the analysis made through the literature review made in Chapter 1. Henceforth the designed model is being used for further implementation of various MPPT algorithms in the forthcoming chapters. The various equivalent numerical values corresponding to the various parameters of the equivalent circuit has been listed in Appendix 1.
CHAPTER 3 POWER VARIANCE WITH TEMPERATURE AND IRRADIANCE
NATIONAL INSTITUTE OF TECHNOLOGY, ROURKELA 10
CHAPTER 3
POWER VARIANCE WITH
TEMPERATURE & IRRADIANCE
INTRODUCTION
BLOCK DIAGRAM
SIMULATION RESULTS
DISCUSSION
CHAPTER 3 POWER VARIANCE WITH TEMPERATURE AND IRRADIANCE
NATIONAL INSTITUTE OF TECHNOLOGY, ROURKELA 11
3.1. INTRODUCTION
The Maximum Power depends upon two main factors. These are temperature and irradiance. The short circuit current (Isc) varies directly with working temperature and the voltage varies inversely with temperature. Thus the maximum power varies inversely with the working temperature. Hence with the increase in temperature the decrease in the value of the voltage is much more than the increase in the value of current. So with mathematically it has been established that with the rise in temperature by 10C the maximum power decrease by 0.45
%. Considering the factor of irradiance, the short circuit current is directly proportional with insolation and open circuit voltage is logarithmically dependent on solar insolation. So maximum power is directly proportional with irradiance.
3.2. BLOCK DIAGRAM
The design algorithm requires to verify the variation in the PV current and PV voltage with the variation of the temperature and irradiance.
. This analysis requires four conditions i.e.
Constant Temperature-Constant Irradiance
Constant Temperature-Variable Irradiance
Variable Temperature-Constant Irradiance
Variable Temperature-Variable Irradiance
CHAPTER 3 POWER VARIANCE WITH TEMPERATURE AND IRRADIANCE
NATIONAL INSTITUTE OF TECHNOLOGY, ROURKELA 12
Thus the block diagram shown in Fig shows the performance of the PV array with the changing criterions of the temperature and irradiance gradually in steps as listed above. The temperature and the irradiance are either kept constant or varied simultaneously or differently so as to achieve the required condition of analysis. The PV panel is designed using the basic equations as discussed in Chapter 1. The boost converter is used to increase the magnitude of the output voltage of the PV Panel, so as to satisfy the load requirement. The boosted voltage is supplied to the load. A PI controller is used here to control the duty ratio of the boost converter.
3.3.
SIMULATION RESULTS3.3.1. Constant Temperature Constant Irradiance
Fig.3.2. Variation of Current
0 1 2 3 4 5 6 7 8 9 10 0 2 4 6 8 10 T i m e ( s ) C u r r e n t ( a m p s )
Fig.3.3. Variation of Input Voltage
0 1 2 3 4 5 6 7 8 9 10 15 20 25 30 35 T i m e ( s ) I n p u t V o l t a g e ( V )
CHAPTER 3 POWER VARIANCE WITH TEMPERATURE AND IRRADIANCE
NATIONAL INSTITUTE OF TECHNOLOGY, ROURKELA 13
Fig. (3.2) to Fig (3.4) shows the variation of current, input voltage and output voltage with constant temperature and constant irradiance where the temperature is taken to be 250C and the irradiance of 1 is chosen. The PV current remains fixed at 5.8 amps (Fig. 3.2). The input voltage is found to be 20 V (Fig. 3.3) depending on the values of temperature and irradiance while the output voltage comes to be around 25 V. (Fig. 3.4).
3.3.2. Constant Temperature Variable Irradiance
The variation of current, input voltage and output voltage with a fixed temperature of 250C and a varying irradiance from 0.75 to 1 are shown in Fig. (3.5) to Fig. (3.7). The current increases slowly form 6 amp to 8 amp (Fig. 3.5) The input voltage to the load varies within 5 V to 20 V (Fig. 3.6), while the output voltage varies within 20 V to 30 V (Fig. 3.7).
Fig.3.4. Variation of Output Voltage
0 1 2 3 4 5 6 7 8 9 10 0 5 10 15 20 25 30 T i m e ( s ) O u t p u t V o l t a g e ( V )
Fig.3.5. Variation of Current
0 1 2 3 4 5 6 7 8 9 10 0 2 4 6 8 10 T i m e ( s ) C u r r e n t ( a m p )
CHAPTER 3 POWER VARIANCE WITH TEMPERATURE AND IRRADIANCE
NATIONAL INSTITUTE OF TECHNOLOGY, ROURKELA 14
3.3.3. Variable Temperature Constant Irradiance
Fig.3.6. Variation of Input Voltage
0 1 2 3 4 5 6 7 8 9 10 0 10 20 30 40 T i m e ( s ) I n p u t V o l t a g e ( V )
Fig.3.7. Variation of Output Voltage
0 1 2 3 4 5 6 7 8 9 10 0 5 10 15 20 25 30 T i m e ( s ) O u t p u t V o l t a g e ( V )
Fig.3.8. Variation of Current
0 1 2 3 4 5 6 7 8 9 10 0 2 4 6 8 10 T i m e ( s ) C u r r e n t ( a m p s )
CHAPTER 3 POWER VARIANCE WITH TEMPERATURE AND IRRADIANCE
NATIONAL INSTITUTE OF TECHNOLOGY, ROURKELA 15
With the temperature varying and the irradiance remaining fixed at 0.7, the PV current comes to be constant at 6 amp (Fig.3.8) as the irradiance is constant. The input voltage varies within 15 V to 25 V (Fig. 3.9) and the output voltage varies from 22 V to 27 V (Fig. 3.10).
3.3.4. Variable Temperature Variable Irradiance
Fig.3.9. Variation of Input Voltage
0 1 2 3 4 5 6 7 8 9 10 10 15 20 25 30 35 40 T i m e ( s ) I n p u t V o l t a g e ( V )
Fig.3.10. Variation of Output Voltage
0 1 2 3 4 5 6 7 8 9 10 0 5 10 15 20 25 30 T i m e ( s ) O u t p u t V o l t a g e ( V )
Fig.3.11. Variation of Current
0 1 2 3 4 5 6 7 8 9 10 0 2 4 6 8 10 T i m e ( s ) C u r r e n t ( a m p )
CHAPTER 3 POWER VARIANCE WITH TEMPERATURE AND IRRADIANCE
NATIONAL INSTITUTE OF TECHNOLOGY, ROURKELA 16
For varying temperature and varying irradiance, the PV current slowly increases from 6 amp to 8 amp (Fig. 3.11) as the current varies proportionally to irradiance. However the input voltage varies within 5 V to 25 V (Fig. 3.12) and the output voltage varies within 20 V to 27 V (Fig. 3.13)
3.4. DISCUSSION
The effect of temperature and irradiance variation is studied and validated in the MATLAB/Simulink platform. The analysis of the output voltage under various condition stated shows that the PV voltage remains invariant irrespective of the change in input conditions of temperature and irradiance. The use of PI controller makes the system independent of the temperature and irradiance thus making the system quite effective under the conditions of partial shading.
Fig.3.12. Variation of Input Voltage
0 1 2 3 4 5 6 7 8 9 10 0 10 20 30 40 T i m e ( s ) I n p u t V o l t a g e ( V )
Fig.3.13. Variation of Output Voltage
0 1 2 3 4 5 6 7 8 9 10 0 5 10 15 20 25 30 T i m e ( s ) O u t p u t V o l t a g e ( V )
CHAPTER 4 MPPT USING INCREMENTAL CONDUCTANCE
NATIONAL INSTITUTE OF TECHNOLOGY, ROURKELA 17
CHAPTER 4
MPPT USING INCREMENTAL CONDUCTANCE
INTRODUCTION
BLOCK DIAGRAM
FLOW CHART OF THE DESIGNED ALGORITHM
SIMULATION RESULTS
DISCUSSION
CHAPTER 4 MPPT USING INCREMENTAL CONDUCTANCE
NATIONAL INSTITUTE OF TECHNOLOGY, ROURKELA 18
4.1. INTRODUCTION
In this chapter the Incremental conductance method is used as the algorithm for MPPT. Incremental conductance algorithm is obtained by equating the result to zero of the differentiation of the PV array power with respect to voltage.
(VI) 0 dP d dI I V dV dV dV at MPP (4.1) Hence I dI V dV (4.2)
In this equation, right hand side represents PV array’s incremental conductance, while left hand side represents the opposite of its instantaneous conductance. It is clear that, at MPP, these two values should be equal.
dI I dV V with dP 0 dV (4.3) and dI I dV V with dP 0 dV (4.4)
decides the direction in which the operating point should move towards the MPP. Under sudden changing condition of weather, the right direction is tracked in incremental conductance algorithm, which is not possible in P&O algorithm and also the point is not oscillated around the MPP as it is happened in case of P&O algorithm.
4.2. BLOCK DIAGRAM
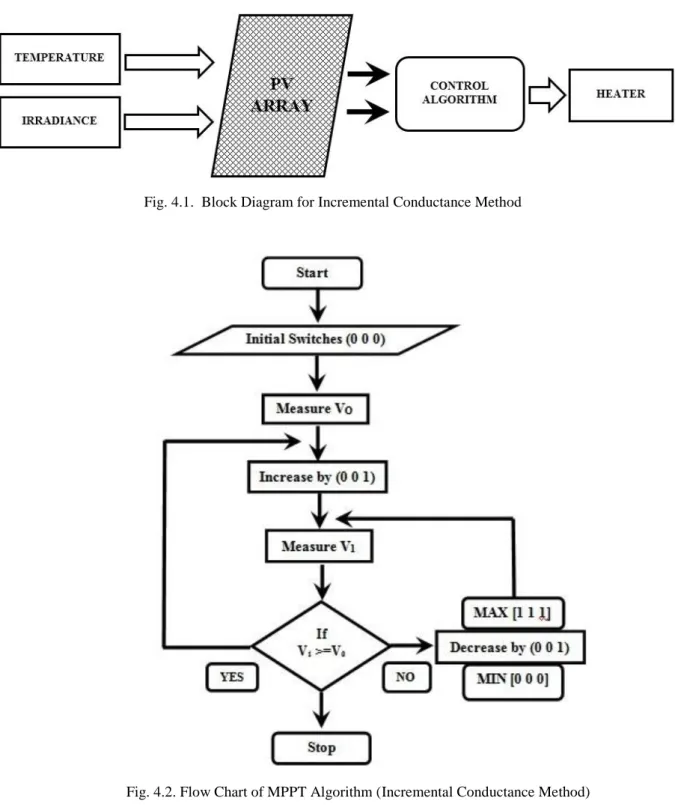
The application of the MPPT algorithm is implemented into the domestic application. In this case the power produced to the PV Array is supplied to a Heater. As shown in Fig. (4.1), the controlling factors of maximum power i.e. temperature and irradiance are varied through a Gaussian function (appendix 2). The power generated in the PV Panel is regulated through a control algorithm. Here the Incremental Conductance algorithm as shown through flowchart in Fig. (4.2) has been implemented.
CHAPTER 4 MPPT USING INCREMENTAL CONDUCTANCE
NATIONAL INSTITUTE OF TECHNOLOGY, ROURKELA 19
4.3. FLOW CHART OF THE DESIGNED ALGORITHM
A heater is connected across the PV array for domestic purpose, whose resistances are connected in series. Switches are connected across the resistances and initially, the position of switches are 000 that means all are in open condition. At that time, voltage is measured.
Then, the position is changed to 001 and the voltage is measured again. Then, the difference of voltage is measured that is the difference of instantaneous voltage and previous
Fig. 4.1. Block Diagram for Incremental Conductance Method
CHAPTER 4 MPPT USING INCREMENTAL CONDUCTANCE
NATIONAL INSTITUTE OF TECHNOLOGY, ROURKELA 20
voltage. If the difference is greater than equal to zero, then, the position of switches are changed by increasing by 001 starting from 000 position to 111 position.
The steps are followed until the MPP (Maximum power point) is reached. Otherwise, the states of switches are changed by decreasing by 001 from the previous position up to the minimum position 000, until the MPP is reached. This algorithm has been represented in Fig. 4.2.
4.4. SIMULATION RESULTS
The application of the PV system to the domestic heater application controlled through Incremental Conductance method is analysed in two cases i.e. (1) heater resistances connected in series with the PV Panel (2) heater resistances connected in parallel with the PV Panel. Therein the variation of current, voltage, power and energy is studied and analysed with and without the use of MPPT algorithm. For the simulation study performed, a time period of 12 Hrs of day light time is considered.
4.4.1.
Variation during Series ConnectionFig. 4.3 to Fig. 4.10 shows the variation of current, voltage, power and energy with and without use of MPPT algorithm when the heater resistances are connected in series with the PV system.
4.4.1.1. Variation of Current
Fig.4.3. Variation without MPPT Algorithm
0 2 4 6 8 10 12 0 10 20 30 40 50 T i m e ( H r ) C u r r e n t ( A m p s )
CHAPTER 4 MPPT USING INCREMENTAL CONDUCTANCE
NATIONAL INSTITUTE OF TECHNOLOGY, ROURKELA 21
4.4.1.2. Variation of Voltage
Fig. 4.4. Variation with MPPT Algorithm
0 2 4 6 8 10 12 0 20 40 60 80 T i m e ( H r ) C u r r e n t ( A m p s )
Fig. 4.5. Variation without MPPT Algorithm
0 2 4 6 8 10 12 0 1 2 3 4 5 6 T i m e ( H r ) V o l t a g e ( V )
Fig.4.6. Variation with MPPT Algorithm
0 2 4 6 8 10 12 0 5 10 15 20 25 30 T i m e ( H r ) V o l t a g e ( V )
CHAPTER 4 MPPT USING INCREMENTAL CONDUCTANCE
NATIONAL INSTITUTE OF TECHNOLOGY, ROURKELA 22
4.4.1.3. Variation of Power
4.4.1.4. Variation of Energy
Fig.4.7. Variation without MPPT Algorithm
0 2 4 6 8 10 12 0 100 200 300 400 t i m e ( H r ) P o w e r ( W a t t s )
Fig.4.8. Variation with MPPT Algorithm
0 2 4 6 8 10 12 0 200 400 600 800 1000 1200 t i m e ( H r ) P o w e r ( W a t t s )
Fig.4.9. Variation without MPPT Algorithm
0 2 4 6 8 10 12 0 200 400 600 800 1000 T i m e ( H r ) E n e r g y ( J )
CHAPTER 4 MPPT USING INCREMENTAL CONDUCTANCE
NATIONAL INSTITUTE OF TECHNOLOGY, ROURKELA 23
With the heater resistances connected in series with the PV Panel the current has a high value of 65 amps (fig. 4.3) with the MPPT algorithm but without the use of the MPPT the current value decreases to 42 amps (fig. 4.4). However during the same instant, when the MPPT algorithm is not used the voltage developed is only 6 V (fig. 4.5) and hence the power being supplied to the heater is around 400 Watts (fig. 4.7).
But with the use of MPPT algorithm the voltage developed has risen to 27 V (fig. 4.6) and therefore an enormous power of 1200 Watts (fig. 4.8). The voltage generated and power developed with the application of MPPT algorithm is almost 3 times the voltage and power without use of MPPT. Simultaneously the energy developed in former case is only 850 Joules (fig. 4.9) while for the latter case with the use of MPPT, it is around 4000 joules (fig. 4.10).
4.4.2. Variation during Parallel Connection
Fig. 4.11 to Fig. 4.18 shows the variation of current, voltage, power and energy with and without use of MPPT algorithm when the heater resistances are connected in parallel with the PV system
Fig.4.10. Variation with MPPT Algorithm
0 2 4 6 8 10 12 0 1000 2000 3000 4000 T i m e ( H r ) E n e r g y ( J )
CHAPTER 4 MPPT USING INCREMENTAL CONDUCTANCE
NATIONAL INSTITUTE OF TECHNOLOGY, ROURKELA 24
4.4.2.1. Variation of Current
4.4.2.2. Variation of Voltage
Fig. 4.11. Variation without MPPT Algorithm
0 2 4 6 8 10 12 0 10 20 30 40 50 T i m e ( H r ) C u r r e n t (A m p )
Fig. 4.12. Variation with MPPT Algorithm
0 2 4 6 8 10 12 0 10 20 30 40 50 T i m e ( H r ) C u r r e n t ( A m p )
Fig. 4.13. Variation without MPPT Algorithm
0 2 4 6 8 10 12 0 5 10 15 20 25 30 T i m e ( H r ) V o l t a g e ( V )
CHAPTER 4 MPPT USING INCREMENTAL CONDUCTANCE
NATIONAL INSTITUTE OF TECHNOLOGY, ROURKELA 25
When the heater resistances are connected in parallel with the PV system and the MPPT control algorithm is not applied the current being supplied is 40 amps (fig. 4.11). The voltage developed is around 28 V (fig. 4.13). With the application of the MPPT algorithm into the PV system, the current value is raised to 50 amps (fig. 4.12). Hence the voltage developed is slightly decreased to 27 V (fig. 4.14). There is small increment in the power being and the energy developed Hence there is a minimal change in the power and energy being developed in the PV system with the application of MPPT algorithm in contrast to its raw application.
4.5. DISCUSSION
The application of PV system into the domestic heater application is studied with and without the application of the MPPT algorithm (Incremental Conductance Method). The analysis shows that the system connected in series produces a considerable change in the magnitude of power generated and energy developed with the use of control algorithm while the change is negligible for the system connected in parallel.
Fig. 4.14. Variation with MPPT Algorithm
0 2 4 6 8 10 12 0 5 10 15 20 25 30 T i m e ( H r ) V o l t a g e ( V )
CHAPTER 5 IMPLEMENTATION OF MPPT USING LABVIEW
NATIONAL INSTITUTE OF TECHNOLOGY, ROURKELA 26
CHAPTER 5
IMPLEMENTATION OF MPPT USING LABVIEW
INTRODUCTION
BLOCK DIAGRAM
SIMULATION RESULTS
DISCUSSION
CHAPTER 5 IMPLEMENTATION OF MPPT USING LABVIEW
NATIONAL INSTITUTE OF TECHNOLOGY, ROURKELA 27
5.1. INTRODUCTION
The simulation study of the MPPT algorithm is quite not advisable as it for its the use of PV panel in the real time systems. Many real time simulators are available which can be used to study the effect of the variance of the insolation on the PV characteristics. However these simulators are quite expensive and are not easily available.
In this chapter the integration between the computer Simulation and the real time PV systems has been achieved through DAQ card licensed as USB 6009 under the platform of LabVIEW 2010. The control algorithm is designed and controlled through the simulations. These are then applied to the PV systems through the DAQ card and then again the output results are verified through the Simulation software.
5.2. BLOCK DIAGRAM
The block diagram for the simulation study of the MPPT Algorithm is shown in Fig. 5.1. The solar panel is shown to have been integrated to the control algorithm through the DAQ-USB 6009 marketed by National Instruments. The control signal from the microcontroller unit are also controlled in LabVIEW 2010 through DAQ card. The major parts of the block diagram include
1. DC Supply
2. Signal Generator ( SG3524 ) 3. Comparator (LM311P) 4. Solar Panel
5. Solar Panel Trainer Kit 6. Buck Converter
7. DAQ-USB 6009
5.2.1. Signal Generator (SG3524)
This incorporates all the functions required in the construction of regulating power supply, inverter and switching regulator on a one chip. This unit is used as the control element to generate PWM signals. The saw tooth waveform is generated in the 7th Pin of this IC.
CHAPTER 5 IMPLEMENTATION OF MPPT USING LABVIEW
NATIONAL INSTITUTE OF TECHNOLOGY, ROURKELA 28
5.2.2. DC Supply
This unit takes a 220 V AC supply and generates DC supply voltage at +15 V, -15 V and 5 V as required by the various other units of the circuit.
5.2.3. Comparator (LM311P)
The saw tooth waveform from SG3524 and the reference voltage signal from the USB 6009 are given to Pin 2 and Pin 3 of LM311P which compared the signal and thereby generates a PWM Signal at the Pin 7 as a trigger pulse for the buck converter for external triggering.
5.2.4. Solar Panel
The PV panel incorporated here is of maximum power rating of 20 W. Two 100 W incandescent bulbs are used as illusion for the source of solar energy. The solar panel is connected to the converter circuit through the trainer kit.
5.2.5. Solar Panel Trainer Kit
This is the inherent control box for the solar panel through which the output voltages and current from the solar panel can be easily calculated. The terminals are connected through a potentiometer so as to control the output voltage.
CHAPTER 5 IMPLEMENTATION OF MPPT USING LABVIEW
NATIONAL INSTITUTE OF TECHNOLOGY, ROURKELA 29
Buck Converter
The triggering pulse from the comparator are given to the TP9 point as an external triggering circuit and converter is connected to the potentiometer terminals.
5.2.6. DAQ-USB 6009
This is product of the National Instruments which is used as an interfacing device between the simulation software and the real time system hardware. This can be used both for generating as well as acquiring signals. In this context it is used to generate the DC reference signal and is used to acquire the output voltage and current signals.
5.3. SIMULATION RESULTS
The reference signal is generated through the Lab VIEW (2010) through the DAQ Card (USB 6009) using the AO pin. This is compared with the saw tooth waveform of the signal generator (SG3524) in the comparator (LM311P) to generate the PWM signal. This PWM signal is used as an external to the power electronic devices of the buck converter which controls the output of the PV Panel through the Solar Panel Trainer Kit. The output voltage and current are again acquired through the DAQ through AI0 and AI1 pins respectively.
The outputs and inputs in the Lab VIEW Front Panel are taken as screen shot for clear analysis in reference to Fig. 5.2 to Fig. 5.6. Fig. 5.2 shows a slider which is used to vary the magnitude of the DC reference signal from 0 to 4 V so as to control the duty ratio of the PWM
CHAPTER 5 IMPLEMENTATION OF MPPT USING LABVIEW
NATIONAL INSTITUTE OF TECHNOLOGY, ROURKELA 30
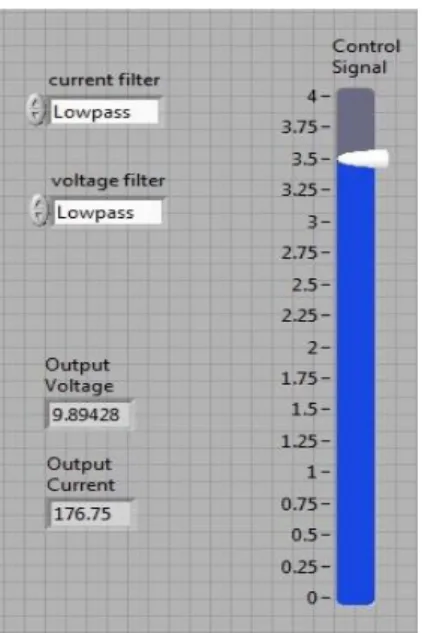
signal. It also depicts that a low pass filter is used to eliminate the noise in the acquired output voltage and current. An instantaneous value of the output voltage and current are shown.
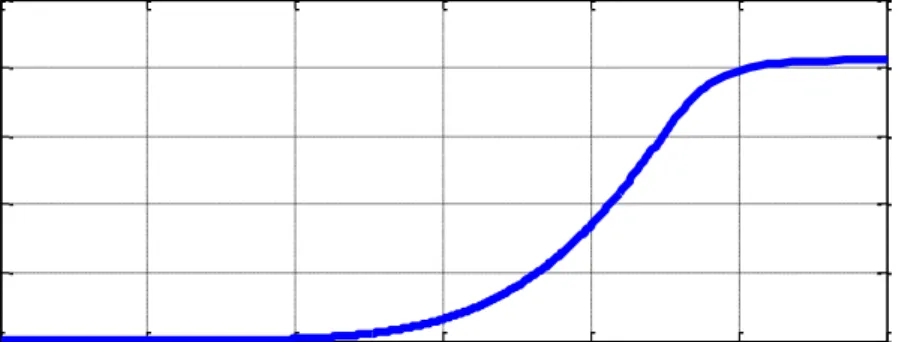
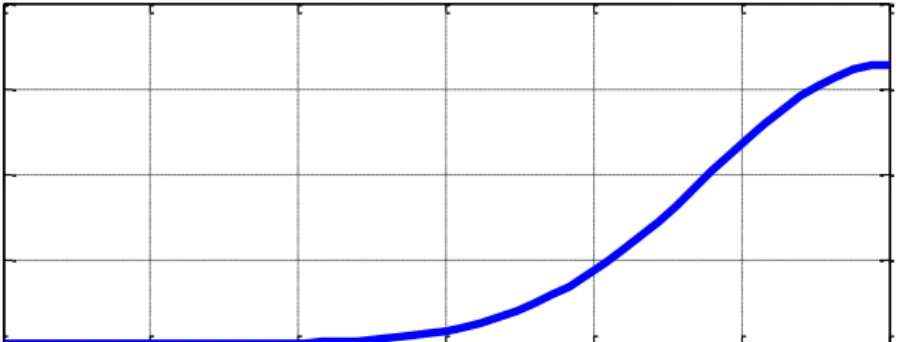
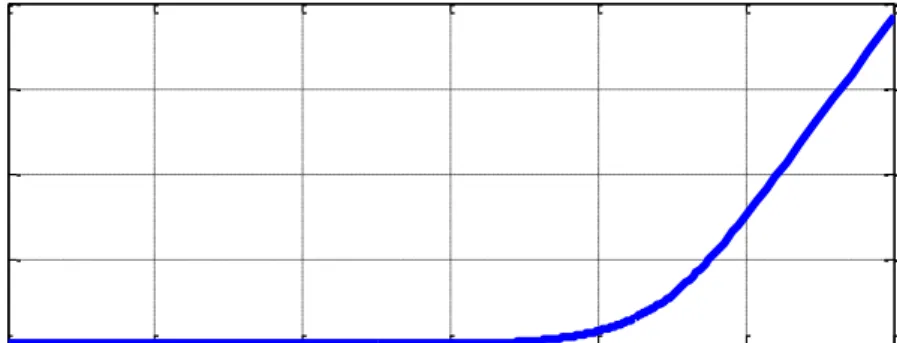
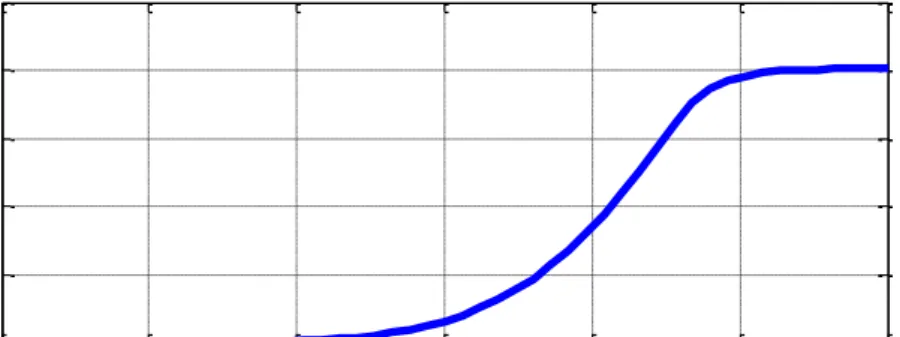
Fig. 5.3. shows the entire front panel in Lab VIEW 2010 environment which shows the input and output of the PV system. The variation of current, voltage and power from the PV system are shown in Fig 5.4 to Fig. 5.6 respectively. This is shown to depict the instant of time at which the maximum power is derived from the PV system. The power shown in Fig 5.5 increases to a maximum point and thereafter fall back.
Fig. 5.3. Screen Shot of LabVIEW Front Panel
CHAPTER 5 IMPLEMENTATION OF MPPT USING LABVIEW
NATIONAL INSTITUTE OF TECHNOLOGY, ROURKELA 31
5.4. DISCUSSION
The PV system has been controlled to extract the maximum power from the available insolation. The real time system is integrated with the simulation platform so as to have a better grip to extract the maximum power through DAQ USB 6009 using Lab VIEW 2010. The output voltages and currents are also easily analysed through the software platform.
Fig. 5.5. Variation of Power
CHAPTER 6 CONCLUSION
NATIONAL INSTITUTE OF TECHNOLOGY, ROURKELA 32
CHAPTER 6
CONCLUSION
CONCLUSION
SCOPE OF FUTURE WORK
CHAPTER 6 CONCLUSION
NATIONAL INSTITUTE OF TECHNOLOGY, ROURKELA 33
6.1. CONCLUSION
The experimental study carried out clearly demonstrates the optimal performance of the designed control algorithm for extracting the maximum power under different conditions of insolation.
The PV array has been mathematically modelled and its performance is tested in the Matlab/Simulink platform while varying the temperature and insolation. The results obtained clearly outlined the effect of temperature and irradiance on output voltage and power from the PV system.
Thereafter the PV system is used for domestic application with a heater used to draw the power from the system using incremental conductance method. Here it was conclude that when the heater is connected with PV Panel in series the power and energy are sufficiently increased using the MPPT algorithm in contrast to its application without the algorithms.
Finally the experimental study was carried out for extracting the maximum power from PV array using labVIEW and USB 6009. The control voltage is varied using a slider on the front panel of the VI. PWM signal is generated by comparing the sawtooth waveform with control voltage. By varying the duty ratio, MPPT tracking is done. As labVIEW programming uses blocks (function VI), it is easy to implement when compared to other methods of MPPT tracking. The output of the PV Array was manually controlled through the software platform by controlling the power electronic devices related to buck converter used and it was observed that for certain instant of time maximum power is derived. But beyond that the power falls back.
6.2. SCOPE OF FUTURE WORK
The incremental conductance algorithm developed for domestic application can be verified with the real time environment.
The manual control of the MPPT in reference to the analysis using LabVIEW can replaced with a well-developed control algorithm so as to give a better performance.
The experimental setup that was build can be used for studying the effects of partial shading of PV array.
APPENDICES
NATIONAL INSTITUTE OF TECHNOLOGY, ROURKELA 34
APPENDIX 1
Parameters Values of the PV ARRAY
Table A.1 Specifications of PV Array
SL.No CHARACTERISTICS SPECIFICATIONS
1 Typical Peak Power ( Po ) 200W
2 Peak Power Voltage ( Vpp ) 26.3V
3 Peak Power Current ( Ipp ) 7.61A
4 Short Circuit Current ( Isc) 8.21A
5 Open Circuit Voltage ( Voc ) 32.9V
6 Open Circuit Voltage Temperature Coefficient ( Kv ) -0.1230V/K
APPENDICES
NATIONAL INSTITUTE OF TECHNOLOGY, ROURKELA 35
APPENDIX 2
Gaussian Function for Temperature & Insolation
Voltage vs. Current Characteristics of PV Array
Fig. A.1. Gaussian Function
0 5 10 15 20 25 -0.2 0 0.2 0.4 0.6 0.8 1 T i m e ( H r s ) I N S O L A T I O N ( w / m 2 )
Fig. A.2. I-V Characteristics
5 10 15 20 25 30 35 0 2 4 6 8 10 12 V o l t a g e ( V ) C u r r e n t ( A ) 1 0.8 0.6 0.4 0.2
REFERENCES
NATIONAL INSTITUTE OF TECHNOLOGY, ROURKELA 36
REFERENCES
[1] Tsai H. L.; Tu C. S; Su I. J., "Development of Generalised Photovoltaic Model Using Matlab/Simulink,"Proceedings of The World Congress on Engineering and Computer Science October 2008.
[2] Villalva, M.G.; Gazoli, J.R.; Filho, E.R., "Comprehensive Approach to Modelling and Simulation of Photovoltaic Arrays," Power Electronics, IEEE Transactions on, vol.24, no.5, pp.1198, 1208, May 2009.
[3] Safari, A.; Mekhilef, S., “Simulation and Hardware Implementation of Incremental Conductance MPPT with Direct Control Method Using Cuk Converter,” Industrial Electronics, IEEE Transactions on, vol.58, no.4, April 2011.
[4] Patel, H.; Agarwal, V., "MATLAB-Based Modelling to Study the Effects of Partial Shading on PV Array Characteristics," Energy Conversion, IEEE Transactions on , vol.23, no.1, pp.302,310, March 2008.
[5] Sera, D.; Teodorescu, R.; Hantschel, J.; Knoll, M., "Optimized Maximum Power Point Tracker for Fast-Changing Environmental Conditions," Industrial Electronics, IEEE Transactions on, vol.55, no.7, pp.2629, 2637, July2008
[6] Femia, N.; Petrone, G.; Spagnuolo, G.; Vitelli, M., "Optimization of perturb and observe maximum power point tracking method," Power Electronics, IEEE Transactions on, vol.20, no.4, pp.963, 973, July 2005.
[7] Esram, T.; Chapman, P.L., “Comparison of Photovoltaic Array Maximum Power Point Tracking Techniques,” Energy Conversion, IEEE Transactions on, vol.22, no.2, pp.439,449, June 2007.
[8] Elgendy, M.A; Zahawi, B.; Atkinson, D.J., “Assessment of the Incremental Conductance Maximum Power Point Tracking Algorithm,” Sustainable Energy, IEEE Transactions on, vol.4, no.1, January 2013.
[9] Masoum, M.A.S.; Dehbonai, H.; Fuchs, E.F., “Theoritical and Experimental Analyses of Photovoltaic System with Voltage and Current-Based Maximum Power Point Tracking,” Energy conversion, IEEE Transactions on, vol.17, no.4, December 2002.
REFERENCES
NATIONAL INSTITUTE OF TECHNOLOGY, ROURKELA 37
[10] Joung-Hu Park; Jun-Youn Ahn; Bo-Hyung Cho; Gwon-Jong Yu, "Dual-Module-Based Maximum Power Point Tracking Control of Photovoltaic Systems," Industrial Electronics, IEEE Transactions on , vol.53, no.4, pp.1036,1047, June 2006.
[11] Miyatake, M.; Veerachary, M.; Toriumi, F.; Fujii, N.; KO, H., "Maximum Power Point Tracking of Multiple Photovoltaic Arrays: A PSO Approach," Aerospace and Electronic Systems, IEEE Transactions on, vol.47, no.1, pp.367, 380, January 2011. [12] Fangrui Liu; Shanxu Duan; Fei Liu; Bangyin Liu; Yong Kang, "A Variable Step Size
INC MPPT Method for PV Systems," Industrial Electronics, IEEE Transactions on , vol.55, no.7, pp.2622,2628, July 2008.
[13] Femia, N.; Lisi, G.; Petrone, G.; Spagnuolo, G.; Vitelli, M., "Distributed Maximum Power Point Tracking of Photovoltaic Arrays: Novel Approach and System Analysis," Industrial Electronics, IEEE Transactions on, vol.55, no.7, pp.2610, 2621, July 2008.
[14] Jung-Min Kwon; Bong-Hwan Kwon; Kwang-Hee Nam, "Three-Phase Photovoltaic System With Three-Level Boosting MPPT Control," Power Electronics, IEEE Transactions on , vol.23, no.5, pp.2319,2327, Sept. 2008
[15] Samosir, A.S.; Yatim, A.H.M., "Implementation of new control method based on dynamic evolution control with linear evolution path for boost dc-dc converter," Power and Energy Conference, 2008. PECon 2008. IEEE 2nd International, vol., no., pp.213, 218, 1-3 Dec. 2008.
[16] Sera, D.; Kerekes, T.; Teodorescu, R.; Blaabjerg, F., "Improved MPPT Algorithms for Rapidly Changing Environmental Conditions," Power Electronics and Motion Control Conference, 2006. EPE-PEMC 2006. 12th International, vol., no., pp.1614, 1619, Aug. 30 2006-Sept. 1 2006.
[17] Glasner, I.; Appelbaum, J., "Advantage of boost vs. buck topology for maximum power point tracker in photovoltaic systems," Electrical and Electronics Engineers in Israel, 1996., Nineteenth Convention of , vol., no., pp.355,358, 5-6 Nov 1996. [18] Hohm, D. P.; Ropp, M.E., "Comparative study of maximum power point tracking
algorithms using an experimental, programmable, maximum power point tracking test bed," Photovoltaic Specialists Conference, 2000. Conference of the Twenty-Eighth IEEE, vol., no., pp.1699, 1702, 2000.