Process Learning for Autonomous Process Anomaly Correction
Nolle, Timo(2020)
DOI (TUprints): https://doi.org/10.25534/tuprints-00014257 License:
CC-BY-NC-ND 4.0 International - Creative Commons, Attribution Non-commerical, No-derivatives
Publication type: Ph.D. Thesis
Division: 20 Department of Computer Science Original source: https://tuprints.ulb.tu-darmstadt.de/14257
P R O C E S S L E A R N I N G F O R A U T O N O M O U S P R O C E S S A N O M A LY C O R R E C T I O N
t i m o n o l l e
Kumulative Dissertation
zur Erlangung des akademischen Grades
Doctor rerum naturalium (Dr. rer. nat.)
Dissertationsschrift in englischer Sprache von Timo Nolle, M.Sc.
aus Bensheim, Deutschland geb. am17.03.1990in Ratingen
Erstreferent: Prof. Dr. Max Mühlhäuser Korreferent: Prof. Dr. Ingo Weber
Tag der Einreichung:15.09.2020 Tag der Prüfung:29.10.2020
Telecooperation Lab Fachbereich Informatik Technische Universität Darmstadt
Timo Nolle:Process Learning for Autonomous Process Anomaly Cor-rection
Darmstadt, Technische Universität Darmstadt
Jahr der Veröffentlichung auf TUPrints: 2020
URN: urn:nbn:de:tuda-tuprints-142579
URI: https://tuprints.ulb.tu-darmstadt.de/id/eprint/14257
Tag der Einreichung:15.09.2020
Tag der Prüfung:29.10.2020
Published under CC BY-NC-ND4.0International.
https://creativecommons.org/licenses/by-nc-nd/4.0/
A B S T R A C T
The automatic detection of divergences from a desired process behav-ior is a common research topic in the business process management community. An established technique to analyze processes is called
conformance checking. Given a definition of a process in form of aprocess model, conformance checking can be used to test whether the
execu-tions of a process contained in a so-calledevent logdata structure are
conforming with the process as it was defined. The result is a com-parison of the execution traces and their respective correct execution, according to the process model. This technique provides insights into where the divergence has occurred and how the execution must be altered to conform to the process model. However, a problem is that it requires a process model to be available. Process models in the correct format are not always available.
Contrary to conformance checking,process anomaly detectionaims to
find anomalous executions without relying on a predefined process model. A process anomaly detection algorithm derives the process logic from the event log itself and exploits the patterns found within the event log to distinguish normal from anomalous process execu-tions. Though process anomaly detection provides the benefit of not relying on a process model, it typically does not provide the level of detail that conformance checking does. A process execution can either benormalor it can beanomalous.
This dissertation proposes process anomaly correction, a novel
ap-proach that combines the benefits of conformance checking and
pro-cess anomaly detection. Given only an event log, process anomaly
correction detects anomalous executions, clearly indicates where the anomaly has occurred during the execution and suggests possible corrective measures. The solution presented in this work is based
on a new concept to the field of process anomaly detection:Process
learning. In process learning, the task of understanding the process based on the example data is transformed into a learning problem in which a neural network is trained to predict the very next activity in a running process execution. The resulting machine learning model thus represents an approximation of the real process that created the data.
This cumulative dissertation consists of five contributions to the field of business process management that demonstrate how, starting
from a process anomaly detection,process anomaly correctionis achieved
in a series of four steps. (1) Process learning is employed to
gener-ate an approximgener-ated model of the process logic. (2) The limitation
of only distinguishing betweennormalandanomalousprocess
tions is overcome by employing the process learning model which processes the process executions on a finer level of detail than existing
approaches. (3) The necessity of providing manual threshold settings,
as it is typical for process anomaly detection algorithms, is replaced by
an automatic parameterization utilizing the process learning model. (4)
The predictive capabilities of the process learning model are exploited to generate possible corrections of detected anomalies.
The resultingprocess anomaly correctionapproach can be employed
in scenarios where classic conformance checking would be infeasible, due to the restriction of relying on a process model. Furthermore, it can be employed alongside classical conformance checking, for it incorporates more information coming from the event log than classical conformance checking (such as employees executing a process step, in which country the process is executed, etc.), and thus provides a new perspective for the process analyst.
Z U S A M M E N FA S S U N G
Die automatische Erkennung von Abweichungen von einem gewünsch-ten Prozessverhalgewünsch-ten ist ein häufiges Forschungsthema auf dem Gebiet des Geschäftsprozessmanagements. Eine gängige Technik zur
Ana-lyse von Prozessen wird alsConformance Checkingbezeichnet.
Ausge-hend von der Definition eines Prozesses in Form eines Prozessmodells
kann mit Hilfe von Conformance Checking überprüft werden, ob
die Ausführungen eines Prozesses, die in einem so genanntenEvent
Logenthalten sind, mit dem definierten Prozess konform sind. Das
Ergebnis ist ein Vergleich der tatsächlichen Ausführungen und ihrer jeweils korrekten Ausführung gemäß dem Prozessmodell. Diese Tech-nik gibt Aufschluss darüber, wo die Divergenz aufgetreten ist und wie die Ausführung geändert werden muss, um dem Prozessmodell zu entsprechen. Ein Problem besteht jedoch darin, dass dazu ein Pro-zessmodell verfügbar sein muss. ProPro-zessmodelle im korrekten Format sind nicht immer verfügbar.
Im Gegensatz zur Konformitätsprüfung zieltProcess Anomaly
Detec-tiondarauf ab, anomale Ausführungen zu finden, ohne sich auf ein
vordefiniertes Prozessmodell zu stützen. Ein Algorithmus zur Erken-nung von Prozessanomalien leitet die Prozesslogik aus dem Event Log selbst ab und nutzt die im Ereignisprotokoll gefundenen Muster aus, um normale von anomalen Prozessausführungen zu unterscheiden. Obwohl die Erkennung von Prozessanomalien den Vorteil bietet, dass sie sich nicht auf ein Prozessmodell stützt, bietet sie in der Regel
nicht den Detaillierungsgrad, denConformance Checkingbietet. Eine
Prozessausführung kann entweder normaloderanomalsein.
In dieser Dissertation wirdProcess Anomaly Correctionvorgeschlagen,
ein neuartiger Ansatz, der die Vorteile von Conformance Checking
und Process Anomaly Detection kombiniert. Nur unter Verwendung des Event Logs, erkennt die Process Anomaly Correction anomale Ausführungen, zeigt deutlich, wo die Anomalie während der Ausfüh-rung aufgetreten ist, und schlägt mögliche Korrekturmaßnahmen vor. Die in dieser Arbeit vorgestellte Lösung basiert auf einem neuen
Kon-zept für den Bereich der Erkennung von Prozessanomalien:Process
Learning. Beim Process Learning wird die Aufgabe, den Prozess auf der Grundlage der Beispieldaten zu verstehen, in ein Lernproblem umgewandelt, bei dem ein neuronales Netz darauf trainiert wird, die nächste Aktivität in einer laufenden Prozessausführung vorherzusa-gen. Das resultierende Modell des maschinellen Lernens stellt somit eine Annäherung an den realen Prozess dar, der die Daten erzeugt hat.
Diese kumulative Dissertation besteht aus fünf Beiträgen aus dem Gebiet des Geschäftsprozessmanagements, die zeigen, wie, ausgehend
von Process Anomaly Detection,Process Anomaly Correction in einer
Reihe von vier Schritten erreicht wird. (1) Process Learning wird
einge-setzt, um ein approximiertes Modell der Prozesslogik zu erzeugen. (2)
Die Beschränkung, nur zwischen normalen und anomalen Prozessaus-führungen zu unterscheiden, wird durch die Anwendung des Process Learning Modells überwunden, welches die Prozessausführungen auf
einer feineren Detailebene verarbeitet als bestehende Ansätze. (3) Die
Notwendigkeit der Bereitstellung manueller Schwellenwerteinstellun-gen, wie sie für Algorithmen zur Erkennung von Prozessanomalien typisch sind, wird durch eine automatische Parametrisierung unter
Verwendung des Process Learning Modells ersetzt. (4) Die prädiktiven
Fähigkeiten des Process Learning Modells werden ausgenutzt, um mögliche Korrekturen der erkannten Anomalien zu generieren.
Der sich daraus ergebende Ansatz zur Korrektur von Prozessan-omalien kann in Szenarien eingesetzt werden, in denen klassisches Conformance Checking aufgrund der Einschränkung, von einem Pro-zessmodell abhängig zu sein, nicht durchführbar wäre. Darüber hinaus kann dieser Ansatz zusätzlich zu klassischem Conformance Checking eingesetzt werden, da er mehr Informationen aus dem Event Log einbezieht als klassisches Conformance Checking (z. B. Mitarbeiter, die einen Prozessschritt ausführen, in welchem Land der Prozess ausgeführt wird usw.) und somit eine neue Perspektive für den Pro-zessanalysten bietet.
A C K N O W L E D G M E N T S
Without the wonderful support of my amazing advisors, colleagues, friends, and my loving family, this dissertation would not have been possible. Many thanks to each and every one of you, for making this time of my life as amazing as it was.
First and foremost there is Max, my doctoral advisor, mentor, and friend. It was an honor for me to work so closely with you over the last five of years. You always supported me in my work and gave me the freedom and the space I needed to be creative. Without exception, you amazed me with your direct and profound feedback on my ideas. Thank you for everything you have done.
I would also like to thank Ingo Weber for serving as the co-referee for my dissertation. Your detailed feedback and constructive criticism helped me in the final phase of writing and in the preparation for the disputation. I am grateful for the support you have given me.
The kindness with which the Telecooperation group has welcomed me is second to none. It has been a pleasure to work with all of you. A special thanks goes to my colleagues of the ISY group, Alex, Chris, and Sebastian. Without the countless hours we spent on presentations, paper ideas, and general discussions, I would not be who I am today. During the five years, I had the pleasure of working at an incredible startup from Darmstadt, PAF. I am very grateful for Tobias allowing me to follow my academic ambitions while simultaneously working for his company. Without your support, I would never have succeeded. I also want to thank Stefan for his willingness to listen to me and to serve as a motivator. Lastly, I want to thank Susanne, who, in countless evening sessions, listened to my research ideas and guided me through the last years of my dissertation.
I want to thank my family, Gaby, Thomas, and Lars, for their contin-uous support not only throughout this dissertation but throughout my Bachelor’s and Master’s degrees as well. You never stopped believing in me and this is what motivated me every day to keep going.
Finally, my deepest gratitude goes to my girlfriend, Ricarda. Thank you for five years of unequivocal support and infinite patience. You helped me become the best version of myself. I am looking forward to a wonderful future together with you and the two cutest little dogs in the world. You are the best!
C O N T E N T S
I s y n o p s i s
1 i n t r o d u c t i o n 3
2 s tat e-o f-t h e-a r t 9
2.1 Preliminaries . . . 9
2.2 Process Anomaly Detection . . . 11
2.3 Conformance Checking . . . 15
2.4 Towards Process Learning . . . 17
2.5 Shortcomings of Process Anomaly Detection . . . 18
3 c o n t r i b u t i o n s 21 3.1 RQ1: Providing Multi-perspective Detection . . . 22
3.1.1 Unsupervised Anomaly Detection in Noisy Busi-ness Process Event Logs Using Denoising Au-toencoders . . . 23
3.1.2 Analyzing Business Process Anomalies Using Autoencoders . . . 23
3.1.3 Discussion . . . 24
3.2 RQ2: Providing Automatic Parameterization . . . 24
3.2.1 BINet: Multivariate Business Process Anomaly Detection Using Deep Learning . . . 25
3.2.2 BINet: Multi-perspective Business Process Anomaly Classification . . . 26
3.2.3 Discussion . . . 27
3.3 RQ3: Bringing Alignments to Process Anomaly Detection 27 3.3.1 DeepAlign: Alignment-based Process Anomaly Correction Using Recurrent Neural Networks . 28 3.3.2 Discussion . . . 30 3.4 Summary . . . 30 4 c o n c l u s i o n a n d o u t l o o k 33 4.1 Summary of Achievements . . . 33 4.2 Future Work . . . 34 b i b l i o g r a p h y 37 II p u b l i c at i o n s p1 u n s u p e r v i s e d a n o m a ly d e t e c t i o n i n n o i s y b u s i -n e s s p r o c e s s e v e -n t l o g s u s i -n g d e -n o i s i -n g au t o e -n -c o d e r s 45 p2 a na ly z i n g b u s i n e s s p r o c e s s a n o m a l i e s u s i n g au -t o e n c o d e r s 63 p3 b i n e t: m u lt i va r i at e b u s i n e s s p r o c e s s a n o m a ly d e -t e c -t i o n u s i n g d e e p l e a r n i n g 89 ix
x c o n t e n t s
p4 b i n e t: m u lt i-p e r s p e c t i v e b u s i n e s s p r o c e s s a n o m a ly
c l a s s i f i c at i o n 107
p5 d e e pa l i g n: a l i g n m e n t-b a s e d p r o c e s s a n o m a ly c o r -r e c t i o n u s i n g -r e c u -r -r e n t n e u -r a l n e t w o -r k s 137
L I S T O F F I G U R E S
Figure1.1 A paper writing and reviewing process in form
of a process model . . . 4
Figure1.2 Comparison of process anomaly detection,
con-formance checking, and the proposed solution,
process anomaly correction . . . 6
Figure3.1 Current state-of-the-art and how the three
re-search questions relate to it . . . 22
Figure3.2 Process anomaly detection architecture . . . . 25
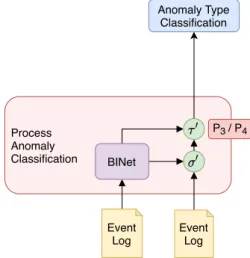
Figure3.3 Process anomaly classification architecture after
the addition of BINet . . . 28
Figure3.4 Process anomaly correction architecture after
the addition of DeepAlign . . . 30
Figure P1.1 t-SNE visualization of the randomly generated
datasets . . . 50
Figure P1.2 BPMN model of a simplified purchase to pay
process . . . 51
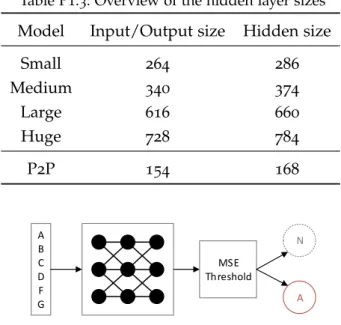
Figure P1.3 Autoencoder is trained to replicate the traces in
the event log after the addition of gaussian noise 53
Figure P1.4 Threshold classifier based on the mean squared
error between the input vector and the output
of the autoencoder . . . 54
Figure P1.5 The autoencoder succeeds in perfectly splitting
the dataset into normal and anomalous traces
solely based on the reproduction error . . . 56
Figure P1.6 Conformance check on a sample of the P2P
dataset . . . 58
Figure P2.1 BPMN model of a simplified purchase to pay
process; the italic names represent the users
allowed to execute that activity . . . 70
Figure P2.2 Autoencoder is trained to replicate the traces in
the event log after the addition of Gaussian noise 73
Figure P2.3 F1 score by process model and method . . . . 76
Figure P2.4 F1 score by percentage of anomalous traces in
the training set . . . 77
Figure P2.5 DAE error heatmap, trained on a P2P event log
with10% anomalous traces . . . 79
Figure P3.1 BINet architecture for a log with two event
at-tributes,supervisoranduser . . . 96
Figure P3.2 Effect of confidence normalization on BINet
anomaly scores (high scores indicate
anoma-lies); anomalies are marked with X . . . 97
xii l i s t o f f i g u r e s
Figure P3.3 F1 score, anomaly ratio r, and second order
derivativer00(scaled for clarity) byαfor BINet
on a dataset with 5attributes usingτa as the
baseline threshold . . . 100
Figure P3.4 F1 score by strategy and heuristic for BINet on
the P2P dataset . . . 101
Figure P3.5 F1 score by method and detection level using
helbow where applicable . . . 102
Figure P3.6 Anomaly score heatmap for BINet trained on
P2P with 2 attributes (supervisor and user);
anomalies are marked by X . . . 103
Figure P4.1 A simple paper submission process which is
used as an example throughout the paper . . . 114
Figure P4.2 A likelihood graph with user attribute;1.0
prob-abilities omitted for simplicity . . . 115
Figure P4.3 Anomalies applied to cases of the paper
sub-mission process . . . 116
Figure P4.4 BINet architectures for a log with two event
attributes,UserandDay; the three versions of
BINet differ only in the inputs they receive . . 119
Figure P4.5 Output of the activity softmax layer after
read-ing activityResearch Related Workand userMain
Author . . . 121
Figure P4.6 Example of how an anomaly detection
visu-alization changes with different threshold set-tings; the rightmost setting corresponds to how
a user would likely set the slider manually . . 122
Figure P4.7 Thresholds as defined by the heuristics in
re-lation to the anomaly ratio r and its plateaus
(blue intervals) . . . 123
Figure P4.8 AverageF1 score by method and strategy over
all synthetic datasets, usingbestas the heuristic125
Figure P4.9 AverageF1 score by method and heuristic over
all synthetic datasets, usingh(a) as the strategy 126
Figure P4.10 Average Precision, Recall, andF1 by dataset
type over all datasets; error bars indicate vari-ance over datasets with different numbers of
attributes and multiple runs . . . 126
Figure P4.11 Critical difference diagram for all methods on
all synthetic datasets . . . 128
Figure P4.12 Classification of anomalies on the Paper dataset
based on anomaly scores from BINetv1 using
h=lp(→a); colors indicate the prediction of the
classifier (see legend) and actual classes are
l i s t o f f i g u r e s xiii
Figure P4.13 Confusion matrix for all runs of BINetv1 on
synthetic datasets with h = lp(→a); color
indi-cates distribution of actual class . . . 130
Figure P5.1 The DeepAlign algorithm makes use of two
next event prediction RNNs and an extended bidirectional beam search (green) to produce
alignments . . . 142
Figure P5.2 RNN architecture for an event log with two case
attributes (Topic and Decision) and two event
attributes (UserandDay) . . . 142
Figure P5.3 The probability of a case c = ha,b,c,d,ei is
computed by the average probability of the case
under both the forward and the backward RNN143
Figure P5.4 The probability of a case c = ha,b,d,ei after
the insertion of an eventcafterbis computed
by the joint probabilityha,biunder the forward
RNN,hd,eiunder the backward RNN, and the
probabilities of continuing the case withc
un-der both RNNs . . . 144
Figure P5.5 The probability of a case c= ha,b,c,x,y,d,ei
after the deletion ofxandyis computed by the
joint probability ofha,b,ciunder the forward
RNN,hd,eiunder the backward RNN, and the
probabilities of continuing the case withdand
c under the forward and backward RNN,
re-spectively . . . 144
Figure P5.6 A simple paper submission process which is
used as an example in the evaluation . . . 146
Figure P5.7 A likelihood graph with user attribute;1.0
prob-abilities omitted for simplicity . . . 146
Figure P5.8 F1 score for each algorithm per noise ratio (left)
and per dataset (right); error bars indicate
L I S T O F TA B L E S
Table1.1 An example alignment of a case from an event
log and the closest path through the process
model . . . 4
Table2.1 Example event log of the paper writing and
reviewing process . . . 10
Table2.2 Summary of the state-of-the-art with respect to
desirable features . . . 19
Table3.1 Comparison of the solutions presented in this
thesis and the state-of-the-art; novelties to the
field are highlighted in red . . . 32
Table P1.1 Example event log of a procurement process . 48
Table P1.2 Overview over the four different randomly
gen-erated process models and the corresponding
event logs . . . 49
Table P1.3 Overview of the hidden layer sizes . . . 54
Table P1.4 Classification report for the anomalous traces
detector . . . 57
Table P1.5 Classification report for the anomalous activity
detector . . . 57
Table P2.1 Example event log of a procurement process . 68
Table P2.2 Overview over the5different randomly
gener-ated process models and the P2P process . . . 69
Table P2.3 Results of the experiments for all evaluated
methods for each process model; best results
are shown in bold typeface . . . 76
Table P2.4 Results on the BPIC event logs; best results are
shown in bold typeface . . . 77
Table P2.5 Results of the experiments for the anomalous
event classifier per label and process model;
best results are shown in bold typeface . . . . 81
Table P3.1 Overview showing dataset information . . . . 94
Table P3.2 Results showing F1 score over all datasets by
detection level and method; best results are
shown in bold typeface . . . 102
Table P4.1 Overview showing dataset information . . . . 117
Table P4.2 F1 score over all datasets by detection level
and method; best results (before rounding) are
shown in bold typeface . . . 127
Table P5.1 Correction accuracy, average error for
incor-rect alignments, and alignment optimality for
correct alignments . . . 148
Part I S Y N O P S I S
1
I N T R O D U C T I O NWhen striving for a career in academia, it is quite unavoidable to learn the process of writing a scientific paper. Picking up such a new skill can be very challenging. Where do we start? What general plan should we follow? How do we know what is right and what is wrong? Who to ask? Fortunately, some of us have had the privilege of having a mentor, guiding us through the initial hardship, pointing us in the right direction, and explaining to us what we were doing wrong and—more importantly—how to do it right.
Let us consider the following example: We are writing our first scientific publication and we plan to work in the following order:
Identify Problem, Develop Method, Experiment, Conduct Study, Research Related Work, Conclude, Submit. How do we know we are on the right track? At this point, we would probably ask our mentors for advice, and they would point out the mistakes we made: "You should research the related work earlier!". But how are they doing it?
They will base their assessment of our plan on their theoretical
knowledge andtheir practical experience, having mentored many
stu-dents over the years in the same process. In their mind, they built an abstract model of how the process of scientific writing works (for them), learning from the different scenarios they have experienced
throughout the years. Such a process model [15] could look as
de-picted in Figure1.1. Whenever a student approaches them with a new
question, they can utilize this model to check the plan of the student for its conformance with their mind’s model of the process.
c o n f o r m a n c e c h e c k i n g w i t h a l i g n m e n t s A more general
statement of the problem above is: Given a process modeland anevent
log, provide analignmentbetween thecasesof the event log and the
process model. To understand this statement, we have to define the emphasized terms. In the business process management (BPM) re-search community, process data is typically stored in a special data
structure calledevent log[1,2]. An event log consists ofcases, which in
turn are sequences ofevents(an event in its simplest form: an activity
ahappened in casecat timet) that happened during the execution of
a process. Aprocess modelis an abstract concept that holds information
about the process logic, for example, in which order the events have
to occur to be compliant with the process. Analignmentis a projection
of a single case onto the process model, which highlights where they
overlap and also where they diverge. The technique ofcheckingif the
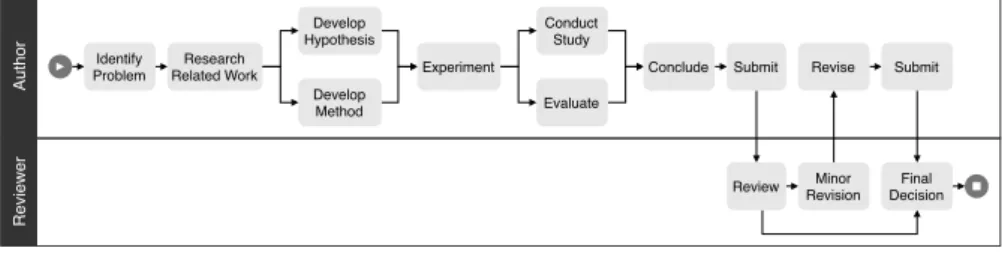
4 i n t r o d u c t i o n Author Reviewer Identify Problem Research Related Work Develop Hypothesis Develop Method Experiment Conduct Study Evaluate Conclude Submit
Review RevisionMinor Revise Submit
Final Decision
Figure1.1: A paper writing and reviewing process in form of a process model
Table1.1: An example alignment of a case from an event log (top row) and
the closest path through the process model from Figure1.1(bottom row);indicates that a necessary event has been skipped (when appearing in the top row) or that an event is not allowed by the process (when appearing in the bottom row)
Identify Problem Develop Method Experiment Conduct Study Research Related Work Conclude Submit Identify Problem Research Related Work Develop Method Experiment Conduct
Study Conclude Submit
cases of an event log areconforming with the logic as defined in the
process model is thus calledconformance checking[43].
In the context of the mentor example from earlier, the hint to "[...] research the related work earlier!" from the mentor can be visualized
as an alignment as shown in Table1.1.
While conformance checking can provide alignments which offer a detailed explanation of what is right and what is wrong in a case, it does have a downside: It relies on the existence of a predefined process model. In the mentor example introduced above, this process model is created over time and shaped by the experience of the mentor. In real-life scenarios, however, the process logic has to be manually transferred to a digital process model so it can be used for conformance checking. Such a digital process model cannot be assumed to always be available, and if it is, it might be outdated or even wrong.
p r o c e s s a n o m a ly d e t e c t i o n Process anomaly detection [3] is
a technique that can be used—without a process model—to automati-cally identify anomalous cases in an event log. Instead of relying on a process model as input, process anomaly detection infers the process logic directly from an event log. With increasing digitization, process data is much more readily available. It is generated as a side-effect of businesses running their processes guided by process-aware infor-mation systems. Thus, process anomaly detection can be a feasible alternative to conformance checking if no process model is available. However, most process anomaly detection algorithms focus on the
clas-i n t r o d u c t clas-i o n 5
sification as output. A case is either anomalous or it is normal. All
we know is if an execution is deemed to beright orwrong.Wherean
anomalous execution has diverged and how the mistake can be cor-rected remains to be investigated. In the context of the aforementioned mentor example, imagine our mentor simply proclaiming “Right!” or “Wrong!” whenever we asked them for guidance in a particularly tricky situation. This advice would not have been very helpful to us.
While process anomaly detection provides the benefit of not relying on a predefined process model, it is lacking in the quality of its output compared to conformance checking. To provide a solution that is as easy to use as it is to ask your mentor for advice, the benefits of process anomaly detection and conformance checking have to be combined. Since process anomaly detection is applied without being manually engineered to model the process logic, it has to provide explanations to the analyst so its detection can be interpreted by someone unfamiliar with the process. The concept of alignments provides these explanations, but it is tightly coupled to the idea of a process model serving as the definition of the normative behavior.
Inferring the normative behavior from the event log is beneficial for several reasons: The issue of a process model possibly being outdated is addressed by continuously updating the learned process logic based on the incoming event data. Furthermore, the a priori knowledge necessary to analyze a process is being reduced because the only input to the algorithm is the event log. However, basing the analysis solely on the event log also has a downside: Since no process model can be utilized to explain detected anomalies, the algorithm now has to
provide both the anomaly detectionandan explanation as to why this
anomaly has been detected.
Though alignments can be used to provide the explanations, they were not compatible with process anomaly detection algorithms. Hence, a new approach was necessary.
p r o c e s s a n o m a ly c o r r e c t i o n In this thesis, a new approach is proposed that combines the benefits of process anomaly detection and conformance checking. It uses as input only the event log itself but produces an output akin to alignments in conformance checking. The
technique is calledprocess anomaly correction. Note that we use the term
correction in the sense of corrective suggestions and not in the sense
of triggering corrective actions since the process anomaly correction
approach generally works independent from the system running the process. It is based on the application of a machine learning technique that exploits the event log data structure to learn the underlying
business process, which in this thesis will be referred to as process
learning. Similar to howprocess miningcan be seen as process-aware
data mining,process learningis process-awaremachine learning. Process
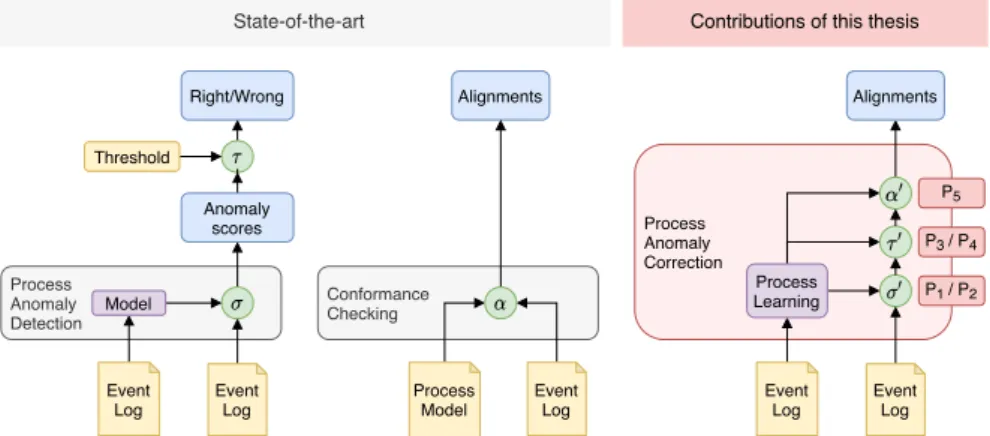
6 i n t r o d u c t i o n Process Anomaly Correction Conformance Checking Process Anomaly Detection Event Log Event Log Model Anomaly scores Right/Wrong Event Log Process Model Alignments Threshold Event Log Event Log Alignments Process Learning
State-of-the-art Contributions of this thesis
P1 / P2
P3 / P4
P5
Figure1.2: Comparison ofprocess anomaly detection,conformance checking, and
the proposed solution,process anomaly correction
the data found in the event log models an underlying process. Just as the mentors who developed their mastery of the scientific paper
writing process by experiencing various scenarios,process learningcan
be used to infer the process logic from an event log.
Figure 1.2 compares the two state-of-the-art approaches, process
anomaly detection and conformance checkingon the left, with the
pro-posed approach process anomaly correctionon the right. Conformance
checking, on the one hand, is based on an alignment function,α, that compares an event log and a process model and produces the
de-sired alignments. Process anomaly detection, on the other hand, first
infers an internal modelfrom the event log and then uses a scoring
function, σ, to assign an anomaly score to every case in the event
log based on its internal model. Secondly, the anomaly scores that result from the scoring function have to be passed through a threshold
function,τ, that maps the anomaly scores to either0or1. Note that
τ usually requires an input parameter setting the threshold value to
operate. This is another downside of most process anomaly detection algorithms since the users need to provide the threshold themselves. Setting the threshold to an appropriate value is challenging, especially for someone not familiar with the process. Hence, a manual setting of the threshold is best avoided.
Process anomaly correctionis achieved in four steps. (1) The modeling phase of the process anomaly detection algorithm is replaced by a
tailored process learning neural network architecture that is trained
on the event log to derive the process logic. The resulting process
learning modelis subsequently used to parameterize the three functions
σ0, τ0, and α0, which removes the necessity of human intervention.
(2) The scoring function σ is replaced by σ0 to not only allow the
detection of anomalous cases (rightvs.wrong), but also the detection
of anomalous events and the detection of anomalous event attributes
(e.g., the resource executing an event). (3) The threshold function
i n t r o d u c t i o n 7
process learning model. (4) The alignment algorithm αis replaced by
a specialized function, α0, that utilizes the process learning model to
analyze the event log and produce an alignment as the output. r e s u lt s This cumulative dissertation contains five contributions to the field of BPM that were published in conference proceedings and
scientific journals between2016and2020. The publications build upon
each other and, as a collection, serve as evidence thatprocess learning
is not only a viable base for state-of-the-art process anomaly detection
but further that fully autonomousprocess anomaly correctionis possible.
Each individual publication addressed specific shortcomings of the state-of-the-art at the time. The proposed solutions were evaluated on both synthetic and real-world event logs. The results of these evaluations demonstrated that process learning based solutions were able to outperform the respective state-of-the-art approaches known
at the time. The individual contributions are positioned in Figure1.2
(P1to P5in the red boxes) according to their scientific focus.
s t r u c t u r e o f t h i s d o c u m e n t This dissertation is structured
into two parts: PartI, the synopsis; and PartII, the cumulative part of
this thesis. PartIfirst introduces necessary concepts and terminology
and gives an overview of the development of the state-of-the-art
(ex-cluding the contributions presented in PartII) in Chapter2. Chapter 3
elaborates on the five individual contributions of this thesis and how
they relate to each other. PartIcloses with an overall conclusion as well
as an outlook on future work in Chapter 4. PartIIis the cumulative
part of this thesis and contains the five publications in chronological
2
S TAT E - O F - T H E - A R TThe concepts of process anomaly detection, conformance checking, and
process learninghave already been introduced in the preceding chapter. This chapter gives a summary of the essential contributions to the
fields of process anomaly detection and conformance checking.
Further-more, it outlines contributions to the field of BPM that base their
solutions on the concept ofprocess learningand its related areas.
Note that this overview of the state-of-the-art omits the contributions of this dissertation. The contributions of this thesis and how they chronologically fit into the state-of-the-art will be presented in detail
in Chapter3and the individual publication chapters in PartII.
2.1 p r e l i m i na r i e s
As already discussed in the introduction, the predominant data
struc-ture in process mining is theevent log. It is also the basis for process
anomaly detection algorithms. An event log is a set of ordered
se-quences ofevents, calledcases. The events in a case are ordered by a
timestamp that indicateswhenan event has been executed.Whathas
happened is described by the activity name of an event. In real-life
examples, event logs typically hold more auxiliary information about the process, the cases, and the events. An example event log following
the paper writing and reviewing process from Figure 1.1is shown in
Table2.1.
In the process mining literature [2], the concept of different process
perspectives has been introduced. In [2], the authors distinguish
be-tween four different process perspectives: Control-flow perspective, organizational perspective, time perspective, and data perspective.
Thecontrol-flow perspectiveis utilized to analyze the order in which activities are executed. An incorrect order of activities is thus some-thing that a process anomaly detection algorithm should detect. The
initial example of executing the activityResearch Related Worktoo late
is an example of a control-flow anomaly.
The organizational perspective focuses on the structure of an orga-nization running the process. Typically, this perspective is used to
analyze how different resourcesare utilized during the execution of
a process. The term resource can refer to employees of a company,
automated agents, or other intelligent systems. As a concrete example in the scientific writing process from earlier, only a reviewer resource is allowed to review a paper. If the author of a paper were to accept his or her own paper, this would constitute an organizational anomaly.
10 s tat e-o f-t h e-a r t
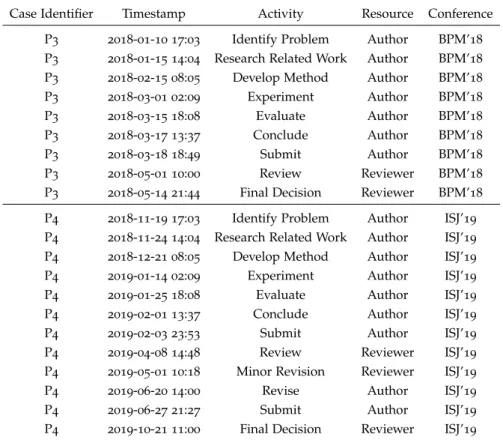
Table2.1: Example event log of the paper writing and reviewing process
Case Identifier Timestamp Activity Resource Conference
P3 2018-01-10 17:03 Identify Problem Author BPM’18 P3 2018-01-15 14:04 Research Related Work Author BPM’18 P3 2018-02-15 08:05 Develop Method Author BPM’18 P3 2018-03-01 02:09 Experiment Author BPM’18 P3 2018-03-15 18:08 Evaluate Author BPM’18 P3 2018-03-17 13:37 Conclude Author BPM’18 P3 2018-03-18 18:49 Submit Author BPM’18 P3 2018-05-01 10:00 Review Reviewer BPM’18 P3 2018-05-14 21:44 Final Decision Reviewer BPM’18 P4 2018-11-19 17:03 Identify Problem Author ISJ’19 P4 2018-11-24 14:04 Research Related Work Author ISJ’19 P4 2018-12-21 08:05 Develop Method Author ISJ’19 P4 2019-01-14 02:09 Experiment Author ISJ’19 P4 2019-01-25 18:08 Evaluate Author ISJ’19 P4 2019-02-01 13:37 Conclude Author ISJ’19 P4 2019-02-03 23:53 Submit Author ISJ’19 P4 2019-04-08 14:48 Review Reviewer ISJ’19 P4 2019-05-01 10:18 Minor Revision Reviewer ISJ’19 P4 2019-06-20 14:00 Revise Author ISJ’19 P4 2019-06-27 21:27 Submit Author ISJ’19 P4 2019-10-21 11:00 Final Decision Reviewer ISJ’19
Thetime perspectiveis adopted for analysis related to the time dimen-sion of a process, such as lead times between two specific activities, execution durations of single activities, or deadlines that must not be exceeded. For example, any paper that is submitted after the deadline should be rejected immediately.
Lastly, thedata perspectiveis used to inspect miscellaneous event and
case attributes that do not fit the other perspectives. For example, a paper can be published at a certain conference. This information can be included in the event log as a case attribute since its value will not change for the different events within this case. Conversely, the type of study that has been conducted can be included as an event
attribute, since it only relates to theConduct Studyactivity. An anomaly
connected to the data perspective is, for instance, if a study paper is accepted at a conference that only accepts proof papers.
As we have seen, anomalies can occur in all of these perspectives, and hence it is important for a process anomaly detection algorithm to support the different perspectives. A process anomaly detection algorithm that can detect anomalies across multiple perspectives is
thus referred to be amulti-perspectivealgorithm.
Inprocess anomaly detectionresearch, theorganizationaland thetime
perspective are often regarded to be part of thedata perspective since
they indeed are just event attributes, albeit special ones. Most process
2.2 p r o c e s s a n o m a ly d e t e c t i o n 11
event attributes, and thus no special meaning is connected to these attributes. Instead, this meaning is inferred from the patterns in the
data. Hence, we typically include these attributes as part of thedata
perspective, without specifically referring to the organizationalor the
timeperspective.
An important aspect of dealing with real-life event logs is that they cannot be expected to be free of anomalies. After all, the anomalies we are trying to detect occur during the real execution of the process, and therefore will be contained in the logs. An event log containing
anomalies is typically called a noisyevent log.
2.2 p r o c e s s a n o m a ly d e t e c t i o n
Process anomaly detection was introduced by van der Aalst et al. in
2005 [3]. Interestingly, the authors also proposed the idea of
confor-mance checking in their paper from 2005[3]. Back then, the two
ap-proaches were not clearly distinguishable yet. Though both apap-proaches have their roots in the same place, they developed in different direc-tions over time. Let us first take a look at the original publication that started both disciplines.
w o r k f l o w n e t s The concept of detecting anomalous process
executions was first coined by van der Aalst and Medeiros in 2005[3].
In their paper, they propose the concept of modeling the logic of a
process using workflow nets, a special version of Petri nets. Aworkflow
netis a directed graph, consisting of transitions and places (both are
nodes in the graph), in which a transition can only be connected to places, and a place can only be connected to transitions. Transitions can only be fired if all incoming places are active, indicated by at least one
tokenoccupying the place. Given an initialmarking(mapping of tokens to places in the workflow net), a correct sequence of transitions will result in a final marking where only a defined set of places contains tokens. Any incorrect sequence will lead to a deadlock in the workflow net, that is, no transition can fire but the final marking has not been reached.
To detect an anomaly in a sequence of events, the sequence is transformed into a sequence of transitions in the workflow net, and the transitions are successively fired. If the workflow net does not reach the final marking, the sequence is regarded as anomalous. They refer to this process as “playing the token-game”. Van der Aalst and Medeiros base their solution on the existence of such a workflow net.
If no workflow net is available, they suggest using process discovery
algorithms which, given an event log, can produce a process model in the form of a workflow net. However, the discovery algorithm they suggested in their paper (at the time) required a noise-free event log
12 s tat e-o f-t h e-a r t
to generate an appropriate process model, which cannot be assumed to be available.
h a n d l i n g n o i s y e v e n t l o g s Three years later, in 2008, pro-cess anomaly detection was picked up again by Bezerra and Wainer. They had identified the issue of relying on a noise-free event log and
proposed three different solutions throughout 2008 and 2009 [6–9]
that did not rely on a noise-free event log. The three methods are based on a discovery algorithm that can handle noisy event logs and a metric to quantify how different an anomalous execution is from the behavior in the discovered process model (conformance score). The three approaches differ in the way the event log is used in the process discovery algorithm.
In theirThresholdalgorithm, the authors iterate over all cases in the
log and if a case has a frequency of less than2percent in the log, they
remove the case from the log. After each removal of an infrequent case, they apply the discovery algorithm on all remaining cases to generate a process model. If the conformance score between the filtered log and the resulting process model is below a conformance threshold, the case is regarded to be anomalous. The iteration over all cases is
then continued until all cases have been processed. In theirIterative
algorithm, instead of removing all infrequent cases in one iteration, they opt to only remove the case with the lowest conformance score in each iteration. They still only consider cases that have a frequency
of less than2percent as potential anomalies. Lastly, in theirSampling
algorithm, for each case that is below the 2 percent threshold, they
sample a fixed percentage of cases from the whole log and discover a process model based on the sample. If the case in question is not an instance of the resulting process model, the case is regarded to be anomalous. The rationale behind the sampling approach is that if the case under inspection is normal, it should also be included in a representative sample of the entire log since anomalies are assumed to be rare.
All three approaches have in common that they rely on the definition of a threshold to indicate when a conformance score is low enough to indicate an anomaly. This threshold depends on the event log itself and must be fine-tuned to ensure proper operation. In their papers, they have set this threshold to a fixed value across all their experiments. Additionally, only the control-flow perspective is being addressed by Bezerra and Wainer. All three approaches will detect anomalies on the case level. The whole case is classified as either normal or anomalous. Localization of the event where the case diverged is thus not possible. Nevertheless, process anomaly detection had now, for the first time, been able to deal with noisy event logs.
2.2 p r o c e s s a n o m a ly d e t e c t i o n 13
l i k e l i h o o d g r a p h s In2016, Böhmer and Rinderle-Ma proposed the first solution incorporating multiple perspectives (control-flow,
and data perspective) [10]. The key idea behind their algorithm is a
probabilistic model which they refer to as a likelihood graph. A likeli-hood graph is computed by calculating pairwise probabilities between all possible combinations of activities based on their frequency in the event log. Afterwards, the likelihood graph is extended by calculating the probabilities of event attribute values co-occurring with a specific activity and annotating the activities with the respective probabili-ties. The extended likelihood is then used to identify anomalies by computing the probability of a new case under the likelihood graph. Any case that has a lower probability than any of the cases in the original log, is regarded as anomalous. A novel aspect of Böhmer’s and Rinderle-Ma’s work is how they deal with unseen data (event se-quences that were not part of the original dataset used to calculate the likelihood graph). Instead of regarding the appearance of a new event sequence as anomalous, they estimate its probability by mapping it to the closest known sequence through the process, which reduces the number of false-positive alarms in the later detection phase.
Every case in the original log is considered to be normal by defi-nition, and hence this approach is not applicable to noisy event logs. Again, like the approaches of Bezerra and Waidner, the approach of Böhmer and Rinderle-Ma detects anomalies based on the case level, which does not allow for localizing the point of divergence. This was the first publication on multi-perspective process anomaly detection. a s s o c i at i o n r u l e s Böhmer and Rinderle-Ma have proposed a
different approach in2018[11,13] that allows to analyze the detected
anomalies further. Instead of relying on a likelihood graph, they opt for use of association rule mining to model the process behavior. As-sociation rule mining is used to identify interesting relations between different events and their attributes. In a first step, a set of associa-tion rules is generated from the event log such that each case in the log is supported by these rules. To identify anomalies, new cases are compared to all cases in the original log and the most similar case with respect to the control-flow is returned. The rules associated with the most similar case are applied to the case under inspection and if the support for the case under inspection (i.e., the number of rules supporting the case) is lower than the support for the most similar case, it is regarded as anomalous.
This approach has the benefit of providing explanations of why a certain case is anomalous since the rules that are not supported by the case provide an indication. However, the rules still have to be analyzed by someone familiar with the process to find the point of divergence. The detection itself only indicates whether a case is anomalous or
14 s tat e-o f-t h e-a r t
not. Similar to their approach from2016[10], this method relies on a
noise-free event log to generate the association rules.
d y na m i c b ay e s i a n n e t w o r k s In 2019, Pauwels and Calders proposed their solution based on extended dynamic Bayesian
net-works [40,41]. Bayesian networks provide the benefit of modeling the
probability of unseen data through Bayesian logic while providing the benefit of being applicable to noisy event logs. Though dynamic Bayesian networks existed before, they were not applicable to sequen-tial data. Pauwels and Calders addressed this problem by introducing the concept of a k-contextlog. A k-contextlog is similar to an event log, but each event holds information (context) about the k events that preceded it. By incorporating the context, Pauwels and Calders were able to extend the dynamic Bayesian network to model the time dimension.
Böhmer’s and Rinderle-Ma’s approach also deals with unseen values but it relies on a noise-free dataset to achieve it. Pauwels’ and Calders’ approach removes this restriction and is applicable to noisy event logs, while still providing the benefit of handling unseen values in the event log. However, though their solution relies on the setting of a threshold, they provide no solution to this problem.
s h o r t c o m i n g s All aforementioned methods have in common that they rely on the definition of a threshold to distinguish anomalous from normal behavior. This means that the user has to define the anomaly, which requires knowledge about the process in the first place. Automatically defining the threshold based on the data itself, removing the need for manual intervention, would thus reduce the amount of a priori knowledge necessary to use the algorithm.
Although some of the approaches utilize multiple perspectives to model the process behavior, they do not incorporate them in the pre-sentation of the results. Yet, information about where the divergence occurred, whether it is connected to the control-flow or the data per-spective, as well as, what was the expected behavior, is important to identify the source of the anomalies, to isolate them, and to initiate timely countermeasures.
If someone was confronted with the picture of a case and a label deeming it to be incorrect, a natural question that arises is “Where exactly is the problem?”. Even if they were provided with a clear indication of where the anomaly occurred, someone unfamiliar with the process will likely ask “Ok, but why is it anomalous?” or “What should have been done instead?”. Answering these questions with current process anomaly detection algorithms is still challenging.
2.3 c o n f o r m a n c e c h e c k i n g 15
2.3 c o n f o r m a n c e c h e c k i n g
The term conformance checking was used multiple times already. This section shall give a brief introduction to the core concepts and how they relate to process anomaly detection.
Conformance checking can be utilized to relate the behavior found inside an event log to the behavior as defined by a predefined process
model [43]. Single cases of an event log can be checked for their
conformance with the process model. Similarly, the conformance of a process model with an entire event log can be calculated. While the initial focus of conformance checking had been to calculate the overall conformance between event logs and process models, the focus has later shifted towards a more detailed analysis of single cases.
a l i g n m e n t s After van der Aalst and Medeiros had pioneered the concepts of process anomaly detection and conformance checking in
2005 [3], conformance checking has seen a series of improvements.
Especially, the concept of alignments has stood the test of time. In
2010, Bose and van der Aalst proposed the use of sequence alignment
algorithms to relate the behavior of a single case to the behavior of an entire event log. The idea of alignments was borrowed from the field of bioinformatics where different DNA sequences are being compared following the same principle. An alignment is a mapping of one sequence onto another, indicating which parts of the first sequence have to be altered to align it with the second one. Alignments have the benefit that they provide the necessary context to understand where a sequence is diverging, why it is diverging, and how a corresponding correct sequence ought to look.
Later, in2013, Adriansyah, van Dongen, and van der Aalst expanded
this idea to relate single cases to process models [4]. Now, this concept
could be applied to visualize exactly which parts of a case were in alignment with the process and which parts were not. Furthermore, the resulting alignment relates the case to the most similar conforming path through the process model, thereby correcting it. However, this approach considers only the control-flow perspective when calculating the most similar path through the process.
m u lt i-p e r s p e c t i v e c o n f o r m a n c e c h e c k i n g De Leoni and
van der Aalst addressed this caveat later that year [28, 29],
demon-strating that a data-aware conformance checking algorithm based on multi-perspective alignments is possible, albeit under the assumption that the cardinality of the event attributes is very low. Mannhardt et al.
have rectified this shortcoming in 2015[31], demonstrating that the
requirement of low cardinality event attributes can be eliminated and, indeed, large-scale multi-perspective conformance checking is feasible.
16 s tat e-o f-t h e-a r t
To achieve multi-perspective conformance checking, the user is required to manually encode the process logic regarding the other perspectives (control-flow is already included in the process model) in forms of a ruleset, so that the conformance checking algorithm can check the event logs for conformance with the respective rules. To create this ruleset, a deep understanding of the process logic is required. Not every user of such algorithms can be expected to be an expert in the process they analyze.
Another approach to multi-perspective conformance checking is to encode the information of the data perspective in the names of the
events, e.g., by clustering them. In2014, Weber et al. proposed Process
Oriented Dependability (POD) Discovery [49], a process discovery
technique that incorporates information from the data perspective through a clustering algorithm. It was specifically targeted at discover-ing process models from low-level system log files comdiscover-ing from cloud applications.
Since the resulting process model holds the information about the data perspective in the event names, classical conformance checking can be used to identify errors in the system logs, as shown by Xu et al.
in2015[47,50,51]. The result of classical conformance checking only
provides information about the control-flow, so the authors investigate the root causes of a detected error by assertion evaluation of
prede-fined rules. Xu et al. later, in 2016, showed that similar techniques
can be utilized to trigger corrective actions to counteract detected
errors [22]. In the same context of system error diagnosis, Farshchi
et al. used statistical regression analysis on these process models to detect correlations between different activities, and hence provide root
cause analysis for system errors [20,21]. However, this technique only
considers pairwise correlations between activities and not the full context of a sequence of events.
o n l i n e c o n f o r m a n c e c h e c k i n g In 2015, Weber et al. intro-duced the concept of online conformance checking to the BPM
com-munity [48]. As opposed to classical conformance checking which
is typically an a posteriori analysis, errors in sporadic operations on cloud applications have to be detected timely to counteract downtimes of critical services. Instead of analyzing event logs, they propose the use of event streams. Another contribution of this work is the intro-duction of automated post-processing steps after the conformance checking to detect numerical invariants (based on a predefined spec-ification) and time anomalies (inferring anomaly intervals directly from the event stream). Though time anomaly intervals are derived automatically, numerical invariants still have to be specified manually. s h o r t c o m i n g s Conformance checking, as proposed in the works discussed, has two downsides. It relies on the existence of a predefined
2.4 t o wa r d s p r o c e s s l e a r n i n g 17
process model that captures the control-flow perspective of the process, and it relies on the manual definition of a ruleset (e.g., reviewer must take final decision) to account for the data perspective. Both the process model and the ruleset require diligent maintenance throughout the lifetime of a process, which often is too expensive to uphold. Nevertheless, conformance checking provides the benefit of generating explanations for divergences. The level of detail with which cases can be aligned to a process model, as well as the possibility of correcting the case, seem to be characteristics that process anomaly detection could benefit from.
2.4 t o wa r d s p r o c e s s l e a r n i n g
The goal of the proposed process anomaly correction approach is to
provide insights to divergences from the process without the need to manually define the process logic in the form of process model or similar structures. In essence, the machine needs to learn the concept behind the process itself by exploiting patterns in the data. Machine
learning, and especially deep learning [27], has become an integral
part of many areas where similar problems were faced, such as natural language processing. It has been shown that deep learning could consistently reach state-of-the-art performance in language tasks, at
times even surpassing it, without being specifically programmed [5,
16,42,46].
The structure of natural language holds some similarities to the structure of event logs. Just as natural language consists of sentences and words, following a certain grammar to make sense, an event log consists of cases and events, following the process logic to make sense. Naturally, deep neural networks should be an excellent choice to learn the underlying business process from the examples in an event log.
In2018, Klinkmüller, van Beest, and Weber showed that predictive
process monitoring algorithms that disregard the sequentiality of
pro-cess data, which they call localalgorithms, tend to make unjustified
predictions [26]. Instead, global algorithms should be applied that
consider the event sequences as a whole. The deep neural networks employed in natural language processing consider the sentences as sequences of words, and do not operate on individual words in isola-tion. Hence, they can be seen as global algorithms (according to the
definition from [26]).
The first publication applying deep learning techniques to event
logs is from 2016[18]. Evermann, Rehse, and Fettke demonstrate that
long short-term memory networks [24], a special kind of recurrent
neural networks, can be utilized to predict the final state of a running business process, its remaining time to completion, as well as the most likely next event. The same authors corroborated the applicability
18 s tat e-o f-t h e-a r t
2017[19]. Tax et al. followed their example, also in2017[45], providing
an elaborate evaluation of deep neural networks on the task of next
event prediction. Di Francescomarino et al., later in 2017, expanded
this idea by incorporating domain knowledge to enhance the quality
of the predictions [17]. The task of next event prediction has since
been researched rather frequently [14,30,32,33,39].
As we have seen, important work has been published on the task of next event prediction. Yet, to the best of our knowledge, none of the concepts has been applied to process anomaly detection, despite the tasks being connected. To be able to accurately predict the next event, the neural network requires a deep understanding of the underlying process. If the actual next event in a case does not match the predictions of a next event prediction model, it can be regarded as anomalous. This
concept serves as the basis for the work on BINet in PublicationsP3
andP4.
2.5 s h o r t c o m i n g s o f p r o c e s s a n o m a ly d e t e c t i o n
Process anomaly detection, unlike conformance checking, is lacking the ability to provide explanations for identified anomalies. Namely the detection resolution of a process anomaly detection algorithm should cover not only the case dimension but also the event and at-tribute dimensions of an event log. Lower-level detection is an essential aspect of being able to suggest a possible correction of an anomalous case.
A key requirement for process anomaly detection is that no a priori knowledge about the process is necessary for it to operate. The un-derstanding of the process behavior must be inferred from an event log. Furthermore, the event log cannot be assumed to only contain normal process behavior. Anomalies are naturally contained in it. An event log holds data about the control-flow perspective of a process, as well as, information about the data perspective. Attributes from the data perspective are usually either categorical or numerical in na-ture. To properly model the underlying process, an anomaly detection algorithm should cover these perspectives.
The requirement of not relying on a priori knowledge about the process can be extended to include the user of the algorithm itself. No assumption should be made about the expertise of the user with regard to the process. Hence, auto-parameterization is essential. Pro-cess anomaly detection lends itself to autonomous operation, but this requires an automatic parameterization of the thresholds that the algorithms rely on.
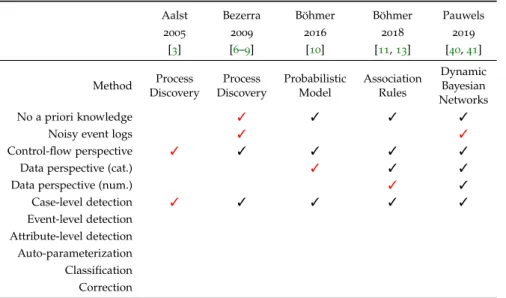
Table2.2summarizes the state-of-the-art related to process anomaly
detection as described before and highlights the novelties of the
indi-vidual contributions. Note that the last five columns of Table2.2do not
2.5 s h o r t c o m i n g s o f p r o c e s s a n o m a ly d e t e c t i o n 19
Table2.2: Summary of the state-of-the-art with respect to desirable features;
novelties to the state-of-the-art (omitting the contributions of this work) are highlighted in red
Aalst Bezerra Böhmer Böhmer Pauwels
2005 2009 2016 2018 2019 [3] [6–9] [10] [11,13] [40,41] Method Process Discovery Process Discovery Probabilistic Model Association Rules Dynamic Bayesian Networks No a priori knowledge 3 3 3 3
Noisy event logs 3 3
Control-flow perspective 3 3 3 3 3
Data perspective (cat.) 3 3 3
Data perspective (num.) 3 3
Case-level detection 3 3 3 3 3 Event-level detection Attribute-level detection Auto-parameterization Classification Correction
can see that none of these algorithms supports multiple perspectives in the detection result. Furthermore, none of the approaches provides an auto-parameterization solution. In every method, parameters have to be defined and fine-tuned to ensure good results. These are sig-nificant shortcomings of process anomaly detection that, so far, have not been sufficiently addressed. Lastly, the concept of alignments and corrective functionality has not yet been incorporated into process anomaly detection, as it has been done for conformance checking.
Conformance checking has addressed these issues by incorporating a predefined process model. To provide the same functionality without relying on such a predefined process model, these five issues needed to be addressed. The contributions of this dissertation demonstrate how
process anomaly detection can gradually be transformed intoprocess
anomaly correction, by iteratively addressing the five aforementioned issues.
These five open issues are connected to the four steps from the
introduction section (see Figure 1.2) in the following way: (1)Process
anomaly correctionemploys the concept ofprocess learningto learn the
business process from the event log. (2) This model is the basis to
provide event and case level detection capabilities, forprocess learning
does not regard a case of an event log as a single unit, but rather as a
sequence of events and their corresponding attributes . (3) The first step
is also essential to automatically parameterize the necessary threshold function because the process learning model, being a probabilistic model, encapsulates information about the distribution of normal
and anomalous cases in the event log. (4) Lastly, classification and
correction can be realized by exploiting the predictive capabilities of the process learning model.
3
C O N T R I B U T I O N SIn Chapter 2 we saw that to combine the benefits of conformance
checking and process anomaly detection, a new method was necessary. We identified five areas of improvement in state-of-the-art process anomaly detection. To improve upon these areas, this thesis addresses
three research questions (RQ1–RQ3). Figure3.1shows the current
state-of-the-art, as outlined in the introduction, and positions the respective research questions. The three research questions are formulated as follows:
RQ1 How can process anomaly detection provide more detailed results that allow pinpointing anomalies according to the different process perspec-tives?
To combine the benefits of conformance checking and process anomaly detection, it is necessary that the anomalies can be detected on a more granular level. If the detection is based on entire cases of an event log, the detected anomaly cannot be corrected on a lower level. Hence, event-level and attribute-level detection is necessary.
Publication P1 (conference paper) and P2 (extended journal
article) address RQ1.
RQ2 How can process anomaly detection be automatically parameterized, without relying on external input?
Most conformance checking approaches do not rely on external input to operate. To provide the same experience with a pro-cess anomaly detection algorithm, automatic parameterization is necessary.
Publication P3 (conference paper) and P4 (extended journal
article) address RQ2.
RQ3 How can the concept of alignments from conformance checking be transferred to process anomaly detection in order to provide process anomaly correction?
To transfer the concept of alignments from conformance check-ing, where cases of an event log are aligned with a process model, a new method is necessary that aligns cases of event logs with a process learning model.
PublicationP5(conference paper) addresses RQ3.
The following sections are dedicated to the three research questions
and how the five individual publications relate to them. In Section 3.1,
22 c o n t r i b u t i o n s Conformance Checking Process Anomaly Detection Event Log Event Log Model Anomaly scores Right/Wrong Event Log Process Model Alignments Threshold RQ1 RQ2 RQ3
Figure3.1: Current state-of-the-art (left part of Figure1.2from the introduc-tion) and how the three research questions relate to it
two publications on the application of denoising autoencoders are presented. It is demonstrated how they can be employed to first learn processes from event logs, and secondly how multi-perspective
detection can be realized. Section3.2summarizes our two publications
on recurrent neural networks and how their predictive capabilities can be utilized for automatic parameterization, as well as anomaly
classification. Section 3.3is dedicated to alignments and how they can
be obtained from the recurrent neural networks. This chapter closes
with a short summary in Section3.4.
3.1 r q 1: p r ov i d i n g m u lt i-p e r s p e c t i v e d e t e c t i o n
With the first two publications,P1andP2, we focused on RQ1. To work
towards RQ1, the way in which process anomaly detection algorithms
had been modeling the process based on the event log had to be improved. Denoising autoencoders (DAE) are commonly utilized for
classic anomaly detection tasks (see [23,25]).
An autoencoder is a neural network that is trained to predict its own input. Since the input and the expected output of the autoencoder are the same, an autoencoder could simply learn the identity function and thus would not learn anything reasonable. Two techniques are commonly employed to guarantee that the autoencoder does not learn the identity function. The first one is to limit the number of available neurons within a central layer of the neural network. This limitation
of capacity creates a bottleneck that forces the autoencoder toencode
(as in lossy compression) the input so that the original sequence can still be reproduced (decoded) from it.
The second technique to suppress the learning of the identity func-tion is to not give the autoencoder access to the original input but, instead, to an altered version of it. A typical alteration is the addition of Gaussian noise to the input. Since the input now differs from the
3.1 r q 1: p r ov i d i n g m u lt i-p e r s p e c t i v e d e t e c t i o n 23
expected output, the autoencoder cannot learn the identity function. The addition of noise to the input of an autoencoder transforms the
task into adenoising task, and hence these autoencoders were given the
namedenoising autoencoders.
Based on the assumption that anomalous cases in the event log are outnumbered by normal cases, the hypothesis is that the autoencoder will learn to correctly reproduce the normal cases while ignoring the anomalous ones. Any case where the mean absolute error between the original input of the autoencoder (without noise) and its output exceeds a threshold is regarded to be anomalous.
However, autoencoders were not directly applicable to sequential process data. Moreover, as most anomaly detection methods did, they treated the task as a binary classification problem (normal vs.
anomalous). To address RQ1, we had to extend the idea of denoising
autoencoders to fit the sequential nature of process data.
3.1.1 Unsupervised Anomaly Detection in Noisy Business Process Event
Logs Using Denoising Autoencoders
In this work, we demonstrated that denoising autoencoders can be extended to learn sequences of events coming from a noisy event log
by transforming the event log into a2-dimensional tensor. Even if not
all cases have the same length, they can be fit into a 2-dimensional
tensor by padding shorter sequences with zeros.
We also showed that both the input and the output of the autoen-coder can be split up along the time dimension of the original se-quence, and hence the error can be computed for individual events of a case, rather than the whole case at once. This novelty to autoencoders
addressed RQ1regarding the control-flow perspective.
Publication:This section summarized our work on denoising
autoencoders from2016[36]. The complete publication can be
found in PartIIas PublicationP1.
Contribution statement:I led the idea generation, implemented the prototype, performed the data evaluation, and formulated the manuscript. Alexander Seeliger and Max Mühlhäuser con-tributed to the conceptual design and the writing process.
3.1.2 Analyzing Business Process Anomalies Using Autoencoders
The previous work on denoising autoencoders had demonstrated that event level process anomaly detection was possible. In this paper, we extend this idea to provide detection on event attribute level, incorpo-rating the data perspective. Instead of splitting the inputs and outputs of the autoencoder only along the time dimension, additional dimen-sions can be added to facilitate the inclusion of the event attributes.