DOCUMEMT RESUME
ED 096 517
CE 002 150
TITLE
Marital and Family Characteristics of Workers, March
1973.
INSTITUTICN
Bureau of Labor Statistics (DOL), Washington, D.C.
PUB DATE
Aug 73
NOTE
6p.
EDRS PRICE
MF-$0.75 HC-61.50 PLUS POSTAGE
DESCRIPTORS
Employment; *Employment Statistics; Females;
Housewives; *Labor Force; Labor Supply; dales;
*Manpower Utilization; Marital Status; Mothers;
*Working Women
ABSTRACT
This brief report presents and discusses statistics
on the marital and family characteristics
of workers in 1973 [e.g.,
nearly 40 million married men and 20 million married women were
among
the 88 million person labor force, and of the
1.7 million increase in
the labor force, three-quarters consisted of
married women (34
percent), single men (24
percent) , and single women
(15 percent)].
Family statistics are reviewed,
and tables show employment status of
persons 16 years old and over by marital
status, sex, and race;
labor
force participation roles
of warted women
(husband present) by
presence and age of children; and employment
status of family head
u-
Su
--ary
U.S. DEPARTMENT OF LABOR
Bureau of Labor Statistics
1J
/SPECIAL LABOR V
FORCE REPORT
k'
U S DEPARTMENT OF HEALTH.
EDUCATION & WELFARE
NATIONAL INSTITUTE OF
EDUCATION
THIS DOCUMENT HAS BEEN
REPRO
DUCE° EXACTLY AS RECEIVED
FROM
THE PERSON OR ORGANIZATION ORIGIN
ATING IT POINTS OF VIEW OR OPINIONS
STATED DO NOT NECESSARILY REPRE
SENT OFFICIAL NATIONAL INSTITUTE
OFEDUCATION POSITION OR POLICY
-Marital
and Family Characteristics of
Workers,
March 1973
For every two married men in the labor force in March 1973,
one
married woman was also working or looking for work.
Nearly 40
mil-lion married men and 20 milmil-lion married
women were among the 88
million persons in the labor force. There were almost as many workers
who had never married-19 million- -as married women, and 10 million
were widowed, divorced, or separated persons.
Of the 1,7 million increase in the labor force in the year ending in
March 1973, three-quarters consisted of married
women (34 percent),
single men (24 percent) and single
women (15 percent)
.
While
popula-tion growth contributed to this increase,
a large part of the gain
result-ed from the strong pick-up in economic activity and demand for workers.
Employment increased in most -narital categories, cutting
back the
num-&ber unemployed and absorbing the labor force growth.
(See table 1.)
13.
August 1973
Married men made no significant
contribution to the year's labor
force growth, even though their population rose by a half million.
Their
labor force participation rate
continued its long-term gradual
decline,
slipl ing to 84.8 percent. As in past years,
this decline was
concentra-ted among husbands 45 years
old and over ,
a group that
includes those
who are reaching retirement age
and that has a greater
incidence of
disabling health problems than younger men.
Labor force rates for
Negro husbands declined as
well, especially in the older age groups.
The labor force participation rate
for all single men rose for the
second year in a row,
reaching 66.1 percent in March 1973.
The
in-crease was a.
reflection of the year's
improvement in economic
condi-tions; employment gains cut their unemployment rate to 10.9 percent,
the lowest level in 3 years,
and attracted a greater proportion
of single
men into the labor force.
The labor force participation rate of married women, husband
present, continued on its long-term upward path, reaching 42.2 percent
in March 1973.
Virtually all of this rise stemmed
from increases in the
number of women under age 35 in the labor force, including
both those
who had no children and those
who were mothers of preschool age
chil-dren.
The rate for wives 45 to 64 years old declined somewhat after
3
-Despite the fact that the presence of
young children in the family
exercises strong inhibitory effects
on the mother's labor force
partici-pation,
the labor force rate of wives with children under 6 years old
continued to increase, rising sharply
over the year to 33 percent.
(See
table 2.)
The increase in the rate for wives with children under 3
was
matched only once before in the past 12 years.
Familie s
In line with the rising labor rorce participation of
married women,
the number of husband-wife families with more than one worker
con-tinued to grow over the
year. In March 1973, there were about a
mil-lion husband-wife families that had other family members in addition to
the husband in the labor force.
This number represented about 56
per-cent of all husband-wife families in which the head
was in the labor
force. (See table 3.)
As in earlier years, the proportion of families
with more than one
worker was greater among Negroes (65 percent)
than among whites
(55 percent) due in part
to the lower income of Negro husbands relative
to white husbands.
Among both white and Negro families,
wives rather
than other family members were much more likely to be the additional
family workers.
4
-The number of female family heads
increased by more than
400,000 over the year to 6.6 million.
Their labor force participatior
rate, at 53.2 percent, remained
unchanged. Women who are heads of
families are more likely than wives to be
in the labor force but they
are not in the work
force to the same extent as married men
who are
family heads.
These findings are from the annual survey
of marit .
id family
characteristics of workers in the
population 16 years old
id over.
The survey was conducted in
March 1973 for the Bureau .4 Labor
Statistics by the Bureau of the Census. Additional information on this
subject will be published in a
forthcominr issue of the Monthly Labor
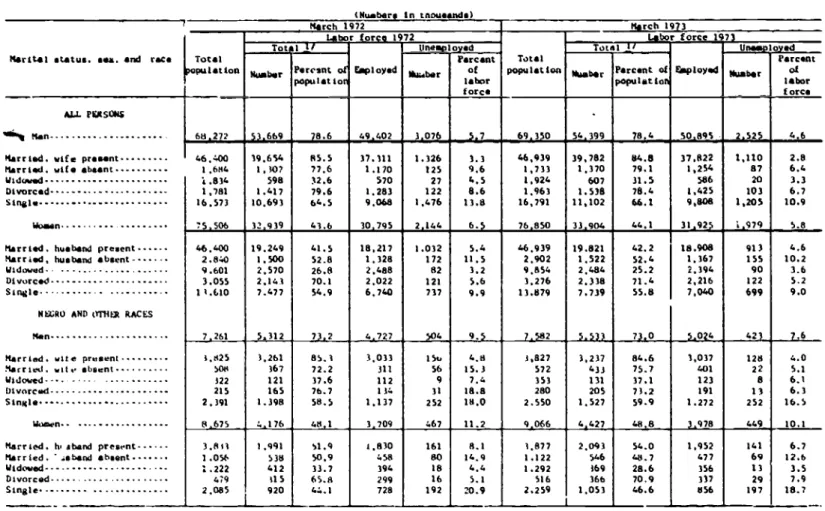
Table 1. Nmployeent status of persons 16 years old and over, by marital status, sax, and 7
1" Marital status. sex, and race Total
pulation
ALL PI:tt SEAS liable Man
Married. wife present Married. wife *burnt
Widowed Divorced Single 68,272 46,400 1.684 1.834 1,781 16,573 Woman 75,506
Married. husband present 46,400
Married, husband absent 2.840
Widowed 9.601
Divorced 3.055
Single 11.610
NIZRO AND OMR RACES
Men 7,261
Married. wife present 1.825
Married. ette absent 500
Widowed- 322
Divorced 215
Single 2.391
Women. 13,675
Married, h. shard present 3.813
Married. '..sband absent 1.056
Widowed 1.222
Divorced 479
Single 2,085
(Number* In tnousends)
BEST COPY AVAILABLE
race. March 1972 and 1973
March 1972 March 1973 Lebo r force 19 72 Total Population bor for a 197 Tottl Employed
Unemn oyed Total
gmployed Number Percent of population Nweber Percent of labor force Nuabar Percent of populetion Number Percent of labor force 53,669 78.6 49,402 3,076 5.7 69,350 54,399 78,4 50.895 2.525 4.6 39,654 85.5 37.311 1.326 3.3 46,939 39,782 84.8 37,822 1,110 2.8 1,107 77,6 1.170 125 9.6 1,733 1,370 79.1 1,254 87 6,4 598 32.6 570 27 4.5 1,924 607 31.5 586 20 3.3 1.417 79.6 1,283 122 8.6 1,963 1.538 76.4 1,425 103 6.7 10,693 64.5 9,068 1,476 13.8 16,791 11,102 66.1 9,808 1,205 10.9 32,939 43.6 30,795 2.144 6.5 76,850 33,904 44.1 31,925 1.979 5.8 19.249 41.5 18,217 1.032 5.4 46,939 19.821 42.2 18.908 913 4.6 1.500 52.8 1,328 172 11.5 2.902 1,522 52.4 1,367 155 10.2 2.570 26.8 2,488 82 3.2 9,854 2,484 25.2 2.394 90 3.6 2.14.3 70.1 2.022 121 5.6 3,276 2.338 71.4 2,216 122 5.2 7.477 54.9 6,740 737 9.9 13.879 7.739 55.8 7,040 699 9.0 5,312 73.2 4,727 504 9., 7,582 5,533 7,3,0 5_,034 423 7.6 1.261 85.3 3,033 154 4.11 3,827 1,237 84.6 7,037 128 4.0 )67 72.2 311 56 15.3 572 433 75.7 401 22 5.1 121 37.6 112 9 7,4 353 131 37.1 123 8 6.1 165 76.7 114 31 18.8 280 205 7).2 191 13 6.3 1.398 58.5 1,137 252 18.0 2.550 1.527 59.9 1.272 252 16.5 411,1 3,709 467 11.2 9,066 4,427 48,8 3,978 449 10.1 1,991 51.9 1,830 161 8.1 3,877 2,093 54.0 1,952 141 6.7 5311 50.9 458
so
14.9 1.122 546 48.7 477 69 12.6 412 33.7 394 18 4,4 1.292 169 28.6 356 13 3.5 115 65.8 299 16 5.1 516 366 70.9 337 29 7,9 920 44.1 728 192 20.9 2.259 1,053 46.6 856 197 18.71/ The male labor force includes members of the Armed Forces, living off post or with their families on post.
Table 2. Labor force participation rates 1/ of married women, husband pesent, by presence and age of children. March 1960.1973 Year All wives No children under 18 years
With children under 18 year.
Total 6 to 17 years only Under 6 years Total 3 to 5 years. none under 3 Years Under 3 years 1960 30.5 34.7 27.6 39.0 18.6 25.1 15.3 1961 32.7 37.3 29.6 41.7 20.0 25.' 17.0 1962 32.7 36.1 30.3 41.8 21.3 27.2 18.2 1963 31.7 32.4 31.2 41.5 22.5 23.5 19.4 1964 34.4 37.8 32.0 43.0 22.7 26.7 20.5 1965 34.7 38.3 32.2 42.7 23.3 29.2 20.0 1966 35.4 38.4 33.2 43.7 24.2 29.1 21.2 1967 36.8 38.9 35.3 45.0 26.5 31.7 23.3 1968 38.3 40.1 36.9 46.9 27.6 34.0 23.4 1969 39.6 41.0 38.6 48.6 28.5 34.7 24.2 1970 40.8 42.2 39.7 49.2 30.3 37.4 25.8 1971 40,8 42.1 39.7 49,4 29.6 36.1 25.7 1972 41.5 42.7 40.5 50.2 30.1 36.1 26.9 1973 42.2 42.8 41.7 50.1 32.7 78.3 29.4
1/ Leber force as percent of population.
BEST COPY AVAILABLE
Table 1. Employment statue of featly heed and other family members, by race, Merck 1971.1973
Employment status and relationship to heed 1971 1972
1973 Ali families White Negro and other races
HUSBAND -WIFE FAMILIES
Total families (thousands) 44,739 '4,752 46,314 42,585 3,729 Head in labor force: Number (thousands) 38,496 39.116 19,298 36,147 3,151
Percent.-- 100.is 100.0 100.0 100.0 100.0
Wife or other member in labor force 53.5 54.6 55.7 S4.9 64.7
Wife only 34.7 35.1 36.0 35.0 47.0
Wife end other member 9.2 9.9 9.8 9.3 10.8
Other eembet only 9.6 9.6 9.9 10.1 7.0
Neither wife nor other member in labor force 46.5 45.4 44.3 45.1 35,3 He4d Employed 1/
Total: Number (thousands) 37,146 37,855 38,247 35.215 3.032
Percent 100.0 100,0 100.0 100.0 100.0
Wife or other member to labor force 53.4 54.5 55.7 54.9 64.5
Wife only 34.5 34.9 15.9 34.9 47.0
Wife and other member 9.1 9,9 9.9 9.8 10.6
Other member only 9.8 9.7 9.9 10.2 6.9
Neither wits nor other membei in labor force 46.6 45.5 44.3 45.1 35.5
Head Unemployed
Total. Number (thousands)
Percent 1,350 100.0 1,261 100.0 1,051 100.0 932 100.0 119 100.0
Wits or other member in labor force 57.2 56.5 55.6 53.6 70.8
Wife only 41.2 40.6 40.6 39.6 48.3
Wife and other member 10.5 7.5 7.8 7.1 13.3
Other member only 5.5 8.3 7.1 6.9 9.2
Walther wife nor other member in labor force 42.8 43.5 44.4 46.4 29.2
FAMILIES WITH FINALE HEAD
Total families (thousands( 5.95. 6,184 6,600 4,666 1,934
Need in labor force: Number (thousands) 3.218 3,288 1.510 2.567 943
Percent 100.0 100.0 100.0 100.0 100.0
Other member in labor force 37.2 38.5 35.8 38.5 28.2
No other member in labor force 62.8 61.5 64.2 61.5 71.8 Head Employed
Total: Member (thousands) 2,989 3,062 3,274 2,438 816
Percent 100.0 100.0 100.0 100.0 100.0
Other member in labor force 18.1 39.1 36.6 19.: 29.0
No other member in labor force 61.9 60.9 61.4 60.8 71.0
Head Unemployed
Total. Number (thousands) 229 226 236 129 107
Percent 100.0 100.0 100.0 100.0 100.0
Other member in labor force 25.8 31.0 24.8 26.9 22.2
No other member in labor force 74.2 69.0 75.2 73.1 77.8
.__
1/ Includes members of the Armed Forces living off poet or with their families on poe .
NOTE. Figures for periods before March 1972 are not etrietly compsrable with later data. Data for 1972 and 1973 reflect the intinduction of 1970 Census data into the estimation procedures. For an explanation
of
thechanges due to the new Census data and an indication of differences. see "Revisions in the Current Population Survey" in the February 1972 issue of Employment and