California Flood
Central Valley
risk analysis
Emerging Risk Report – 2015
Lloyd’s is the world’s only specialist insurance and reinsurance market
that offers a unique concentration of expertise and talent, backed by
strong financial ratings and international licences. It is often the first
to insure new, unusual or complex risks, providing innovative insurance
solutions for local, cross border and global risks. Its strength lies in the
diversity and expertise of the brokers and managing agents working
at Lloyd’s, supported by capital from across the world. In 2015, more
than 90 syndicates are underwriting insurance and reinsurance at
Lloyd’s, covering all lines of business from more than 200 countries
and territories worldwide. Lloyd’s is regulated by the Prudential
Regulatory Authority and Financial Conduct Authority.
Acknowledgements
Hazard data and exposure analysis support has been provided by JBA
Consulting acknowledging JBA Risk Management for their support
with the underlying data. Exposure data has been obtained from the
Federal Emergency Management Agency, USA. Credit for aerial
imagery where shown: Esri, DigitalGlobe, Earthstar Geographics,
CNES/Airbus DS, GeoEye, USDA FSA, USGS, Getmapping,
Aerogrid, IGN, IGP, swisstopo, and the GIS User Community.
Disclaimer
This report has been produced by Lloyd’s and JBA Consulting for
general information purposes only. While care has been taken in
gathering the data and preparing the report, Lloyd’s does not make any
representations or warranties as to its accuracy or completeness and
expressly excludes to the maximum extent permitted by law all those
that might otherwise be implied.
Lloyd’s accepts no responsibility or liability for any loss or damage of
any nature occasioned to any person as a result of acting or refraining
from acting as a result of, or in reliance on, any statement, fact, figure or
expression of opinion or belief contained in this report. This report does
not constitute advice of any kind.
© Lloyd’s 2015 All rights reserved
Date of publication: August 2015
About Lloyd’s
Trevor Maynard
Head, Exposure Management & Reinsurance trevor.maynard@lloyds.com
Key contacts
For general enquiries about this report and Lloyd’s work on emerging risks, please contact
emergingrisks@lloyds.com Nick Beecroft
Manager, Emerging Risks & Research nick.beecroft@lloyds.com
Contents
Executive summary 02 1 Exposure 04 2 Hazard 07 3 Exposure at risk 09 4 Potential accumulations 12 5 Mitigation 15 6 Insurance market 17 7 Conclusion 20 8 Endnotes 22Central Valley, California 02
Executive summary
Although California is enduring its worst drought for 1,200 years, parts of the state remain highly and increasingly vulnerable to flooding.
Lloyd’s commissioned JBA Consulting to estimate the likelihood and impact of a severe flood in California’s Central Valley, which covers 19 counties, is home to 6.9 million people and contains $1 trillion of insurable assets, mostly agricultural.
Based on current estimates of population and assets, we assess that a 1-in-100-year event could result in $24.1 billion of damage, excluding demand surge or business interruption losses, which would likely be significant.
This estimate is made without considering the mitigating impact of defences. The Central Valley contains over 20,000km of levees and flood control structures, and around 150 reservoirs on tributaries.
However, we note that the standard of flood protection offered by these defences is highly variable. Generally, defences have a standard of protection for less than the 1-in-100-year flood. This level of protection will be eroded if infrastructure is not maintained. Analysis of the available data for some counties suggests that current budgets are insufficient to cover present and projected operation and maintenance costs.
We assess that, even if upkeep programmes maintain the 1-in-100-year protection, such protection will be gradually eroded by climate change. Climate change is
likely to result in adjustments to the flood probabilities assigned to much of the Central Valley, with the 1-in-100 and 1-in-200-year floodplains enlarged. Climate change will have implications for the US National Flood Insurance Program (NFIP), which provides subsidies to support take-up of flood insurance. The rising cost of climate change could add further costs to the programme.
The insurance industry can play a role in helping businesses and communities to better understand the potential risks they face from flooding and assist in mitigating these risks. The private insurance market currently provides ‘surplus flood’ cover above the NFIP limits and force placed cover, which is offered in conjunction with banks.
California is typically considered a potential growth market for flood insurance, but the Central Valley, in particular the Sacramento Valley, remains a challenging area to insure. The industry needs more sophisticated catastrophe modelling for the region and more investment in flood infrastructure.
We hope that the analysis in this report will support insurers to achieve more accurate risk-based pricing. This will ensure claims can be paid, and encourage responsible risk management. When this approach is combined with advanced modelling and forward-looking analysis, as outlined in this report, the private (re)insurance sector can and should play a major role in sustainable flood resilience.
Central Valley, California 04
California represents a considerable concentration of insured risk exposure, and over the last 60 years it has experienced more than 30 major flood events. These events have resulted in more than 300 lives lost, over 750 injuries and billions of dollars in disaster claims. Today, more than 7 million Californians, 20% of the state’s population, live in the 1-in-500-year floodplain.1
The Central Valley dominates the state of California, covering 58,000km2. It is 60–100km wide, 720km at
its longest, covers 19 counties and mostly comprises highly productive agricultural land. The biggest centres of population are the cities of Fresno (509,000
1 Exposure
residents), Sacramento (479,000 residents), Bakersfield (363,000 residents) and Stockton (298,000 residents).2
The Sacramento River and San Joaquin River drain the northern and southern parts of the valley to San Francisco Bay; both have extensive floodplains reclaimed by raised flood banks.
Despite a long history of flood management and improvement throughout California, and in particular The Central Valley, significant floods in 1995 and 1997 generated over $1 billion in economic damage,1
indicating both considerable risk and the potential for significant catastrophe losses.
Shasta Redding Chico Sacramento Stockton Modesto Merced Fresno Bakersfield Tehama Glenn Colusa Yuba Sutter Yolo
Placer CARSON CITY
C A L I F O R N I A C A L I F O R N I A SAN FRANCISCO SAN JOSE CARSON CITY SAN FRANCISCO SAN JOSE El Dorado Sacramento San Joaquin Stanislaus Merced Madera Fresno Kings Tulare Kern Butte LOS ANGELES LOS ANGELES Hydrologic Regions
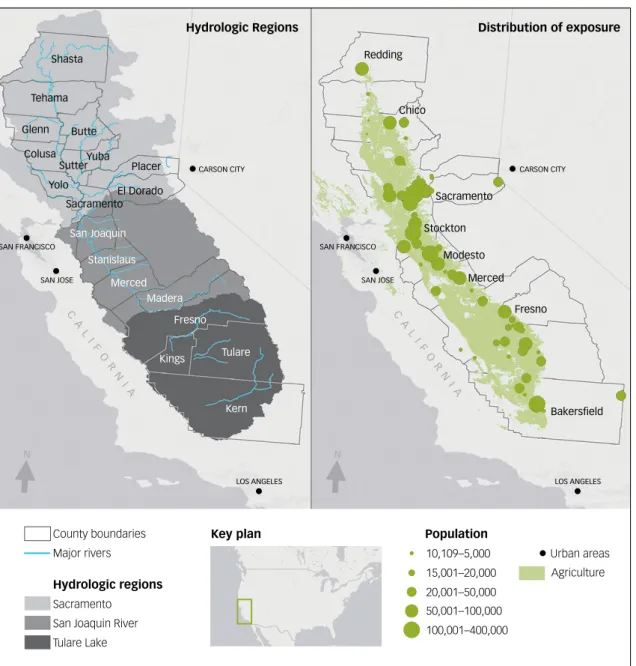
Figure 1: Counties and hydrologic regions within the Central Valley (left) and distribution of exposure (population 2000 census) and agricultural land (right)
Distribution of exposure N N County boundaries Major rivers Hydrologic regions Sacramento
San Joaquin River Tulare Lake Population Key plan 10,109–5,000 Urban areas Agriculture 15,001–20,000 20,001–50,000 50,001–100,000 100,001–400,000
Exposure by line of business
Exposure information has been obtained from the Federal Emergency Management Agency (FEMA) Hazards United States (HAZUS) dataset.3 This dataset
provides the replacement value of buildings and contents at census block resolution. There are over 185,000 census blocks in the Central Valley, covering a population of approximately 6.9 million people and a total exposure value of over $1 trillion. The distribution of exposure across each line of business is provided in Table 1 below.
Residential/commercial/industrial
Residential and commercial exposure in the Central Valley is highly clustered in the main cities and in particular around Sacramento at the base of the Sacramento Valley (see Figure 1). Industry is spread across the Central Valley, though it represents only 16% of the California total as the majority of industry is located along the Californian coast.1
Agriculture
Agricultural production is a significant exposure element in the flat, fertile land of the Central Valley. In addition to the building and content replacement values in Table 1, crops are valued at $14 billion and are spread over 7.8 million acres of land.1 Owing to the significance of
agriculture in the region, major flooding in the Central Valley could severely impact the Californian economy, and both national and international food supplies. California provides reliable, affordable food domestically and globally and accounts for 12% of the US total, and exports $10.9 billion in agricultural goods worldwide.4
Agriculture is historically and currently an important part of the Central Valley’s economy, but the economy is gradually diversifying into renewable energy, pharmaceuticals and service industries. Between 2000 and 2006, about 52,000 hectares of land in the Central Valley were converted into urban use. Of this, 28% was prime farmland.4
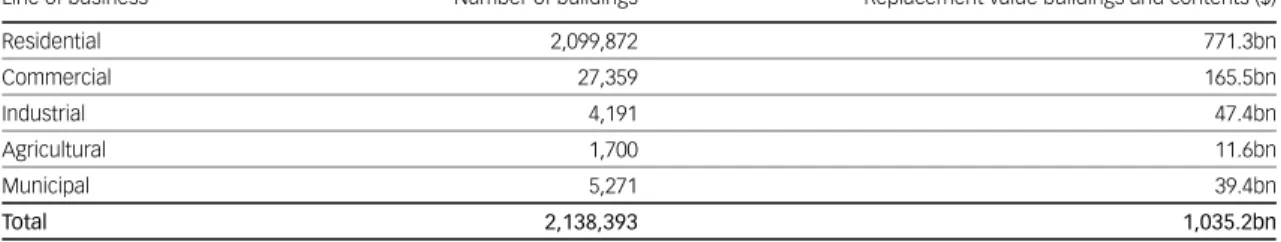
Table 1: Distribution of exposure by line of business, Central Valley California
Line of business Number of buildings Replacement value buildings and contents ($)
Residential 2,099,872 771.3bn Commercial 27,359 165.5bn Industrial 4,191 47.4bn Agricultural 1,700 11.6bn Municipal 5,271 39.4bn Total 2,138,393 1,035.2bn 1 8 2 3 4 5 6 7
Figure 2: Distribution of commercial and industrial exposure by occupancy type Distribution of commercial
exposure ($) by occupancy type %
1 Retail trade 17
2 Wholesale trade 13
3 Personal and repair services 12
4 Professional and technical services 28
5 Banks 2
6 Hospitals 5
7 Medical offices and clinics 10
8 Entertainment and recreation 13
1 2 3 4 5 6 Distribution of industrial
exposure ($) by occupancy type %
1 Heavy industry 28 2 Light industry 14 3 Food/drugs/chemicals 32 4 Metal/minerals pricing 4 5 High technology 1 6 Construction 20
The Central Valley is the extensive floodplains of the San Joaquin and Sacramento Rivers which, prior to reclamation for agriculture and human habitation, were subject to regular and prolonged seasonal inundation. Variations in weather, climate, hydrological conditions, soils, vegetation, land use and topography affect the type and severity of flood peril across California. Warning time, flood duration, water depth and damage caused vary with the type of flooding. Principal sources of flood peril in the Central Valley include:
• Failure of engineered structures, for example a dam or levee. This can have a possibly catastrophic impact depending on the volume of water released and downstream land use.
• Debris flow floods, consisting of water, liquid mud and debris. Common on de-vegetated burned hillsides, these can move quickly and travel great distances. • Slow rise floods caused by heavy rain or snowmelt.
Water levels take several days to peak, gradually overflowing river banks.
• Flash floods, often caused by intense storm rainfall on steep slopes or impermeable ground. Deep water can accumulate and disperse rapidly.
• Flooding on flat land where mountain rivers reach floodplains (areas known as alluvial fans), typically caused by locally intense rainfall. This leads to shallow flow with high velocity and sediment transport. • Surface water flooding in urban areas, often from
blocked or inadequate drainage. This is localised, and smaller in extent than other types of flooding.
2 Hazard
The historical record over the last 100 years shows that the most catastrophic floods occur when heavy rainfall is combined with spring snowmelt. The result is high flows along the main river, causing levees/defence structures to overtop or breach.
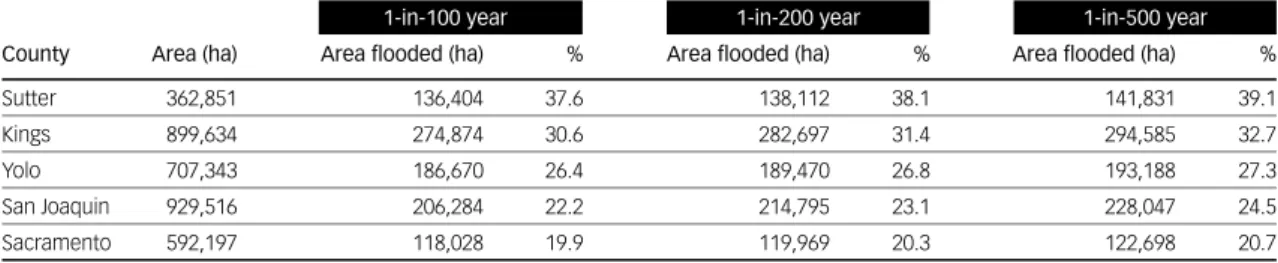
JBA’s Global Flood Hazard Maps for California have been used to quantify the potential exposure at risk to major river flooding. Design return period hazard maps are available for the 20, 50, 100, 1-in-200, 1-in-500 and 1-in-1,500-year return periods. While these maps represent only an approximation, and do not include defences, they do delineate the areas expected to flood with a given annual frequency and are widely used by insurers to assess potential exposures. Table 2 indicates the top five counties by percentage of area affected for the 1-in-100, 1-in-200 and 1-in-500-year return periods. While Sutter, Kings and Yolo counties are sparsely populated, San Joaquin and Sacramento contain major exposure concentrations.
Note that there is very little difference in the area flooded between return periods, indicating the large, flat nature of the Central Valley. Here, due to the topographical constraints (similar to a bathtub), the area affected does not significantly increase, though depths, and consequently damage, will increase with return period.
Table 2: Area and proportion flooded for top five counties in Central Valley for 1-in-100, 1-in-200 and 1-in-500 year return period hazard maps
County Area (ha) Area flooded (ha) % Area flooded (ha) % Area flooded (ha) %
Sutter 362,851 136,404 37.6 138,112 38.1 141,831 39.1
Kings 899,634 274,874 30.6 282,697 31.4 294,585 32.7
Yolo 707,343 186,670 26.4 189,470 26.8 193,188 27.3
San Joaquin 929,516 206,284 22.2 214,795 23.1 228,047 24.5
Sacramento 592,197 118,028 19.9 119,969 20.3 122,698 20.7
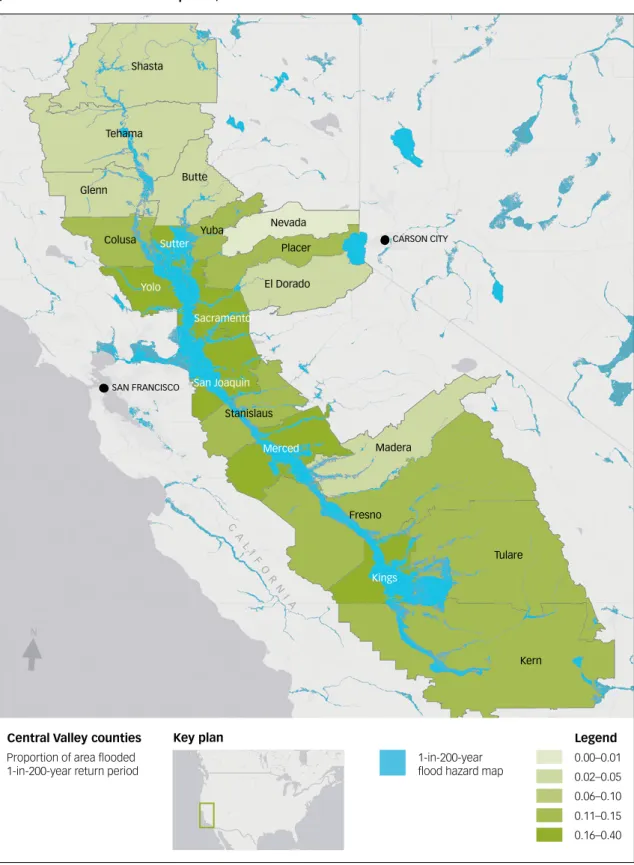
By analysing the HAZUS data at census block resolution against JBA’s Global Flood Map it is possible to calculate the potential exposure at risk to flooding within the
3 Exposure at risk
Central Valley, as shown for the 1-in-200-year flood in Figure 3. The values presented do not indicate damage; instead the value exposed is a function of the proportion
Shasta Tehama Glenn Colusa Yuba Nevada Placer El Dorado Sutter Yolo CARSON CITY C A L I F O R N I A Sacramento San Joaquin Stanislaus Merced Madera Fresno Kings Tulare Kern Butte SAN FRANCISCO
Figure 3: Central Valley counties with proportion of area flooded by 1-in-200-year flood (based on JBA Global Flood Map data)
N
Legend Central Valley counties
0.00–0.01 Proportion of area flooded
1-in-200-year return period 0.02–0.05
0.06–0.10 1-in-200-year
flood hazard map
0.11–0.15 0.16–0.40 Key plan
Central Valley, California 10
of area affected multiplied by the total values exposed. Furthermore, values are for an ‘undefended’ case, ie they assume that flood defence systems either fail in the case of flooding, or do not exist. Such a case can be viewed as extremely conservative, but nonetheless can be used to illustrate a worst case scenario from an insurance perspective. The values do not consider demand surge or business interruption losses.
Given the Central Valley’s geographical size and shape, it is split into three hydrologic regions (see Figure 1). While historical events have shown that all counties across the Central Valley may be affected by the same storm, they are unlikely to be affected simultaneously.
Typically, prevailing westerly winds bring moisture-laden storms over the California coastal range and then eastward towards the Sierra Nevada mountains. Flooding across California can therefore last for several weeks. This issue is further compounded by repeated winter storms – locally termed the ‘Pineapple Express’ – bringing repeated heavy rainfall in saturated catchments. This process has been responsible for a number of major historical flood events and may lead to potentially complex (re)insurance event definitions. Having said this, it is more likely that (re)insurance events will be limited to individual or perhaps neighbouring hydrologic regions.
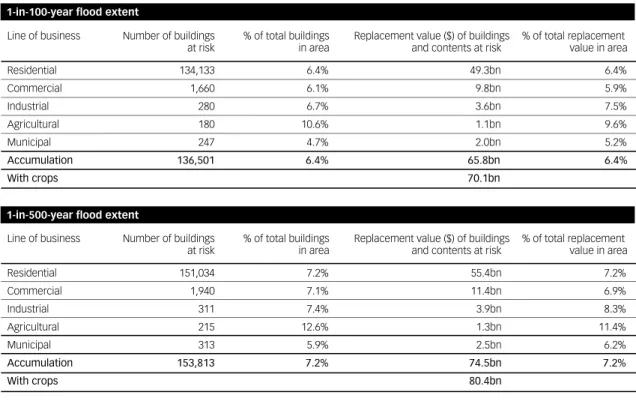
Table 3: Number and value of exposure at risk to flood in the 1-in-100 and 1-in-500-year return period
Line of business Number of buildings % of total buildings Replacement value ($) of buildings % of total replacement
at risk in area and contents at risk value in area
Residential 134,133 6.4% 49.3bn 6.4% Commercial 1,660 6.1% 9.8bn 5.9% Industrial 280 6.7% 3.6bn 7.5% Agricultural 180 10.6% 1.1bn 9.6% Municipal 247 4.7% 2.0bn 5.2% Accumulation 136,501 6.4% 65.8bn 6.4% With crops 70.1bn
1-in-100-year flood extent
1-in-500-year flood extent
Line of business Number of buildings % of total buildings Replacement value ($) of buildings % of total replacement
at risk in area and contents at risk value in area
Residential 151,034 7.2% 55.4bn 7.2% Commercial 1,940 7.1% 11.4bn 6.9% Industrial 311 7.4% 3.9bn 8.3% Agricultural 215 12.6% 1.3bn 11.4% Municipal 313 5.9% 2.5bn 6.2% Accumulation 153,813 7.2% 74.5bn 7.2% With crops 80.4bn
Central Valley, California 12
The figures presented in Section 3 consider the financial impact of a flood of a given frequency occurring simultaneously across the Central Valley. As the flood event of January 1997 demonstrates, while simultaneous flooding is possible, the severity of flooding and event timing may vary significantly. In reality, flood events vary spatially and temporally such that no single return period can predict the losses of a single event (although multiple smaller events may have a cumulative impact
4 Potential
accumulations
once flood storage capacity is filled). Given this, a more realistic accumulation is likely to occur within individual or neighbouring hydrologic regions. A breakdown of exposure by hydrologic region is provided in Table 4; a detailed breakdown of residential and agricultural crop exposure by region is at Figure 4. Here buildings and structure exposure is mostly concentrated within the Sacramento River region with $41.5 billion exposed to the 1-in-100-year flood extent.
1
2 3
Figure 4: Value at risk in the 1-in-100 year flood extent by hydrologic region
Distribution of residential exposure
by hydrologic region 1-in-100-year %
1 Sacramento 64
2 Tulare Lake 15
3 San Joaquin River 21
Distribution of crop exposure
by hydrologic region 1-in-100-year %
1 Sacramento 26
2 Tulare Lake 41
3 San Joaquin River 33
1
2 3
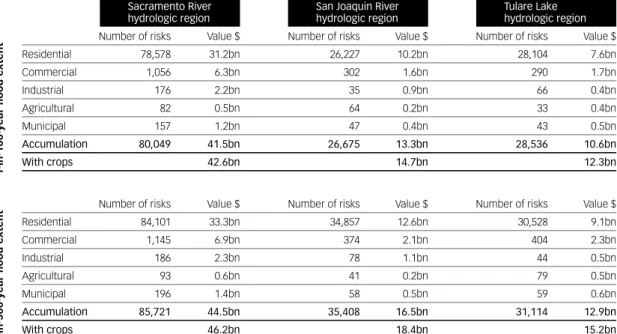
Table 4: Number and value of exposure at risk in the 1-in-100 and 1-in-500 year return period by hydrologic region
Number of risks Value $ Number of risks Value $ Number of risks Value $
Residential 78,578 31.2bn 26,227 10.2bn 28,104 7.6bn Commercial 1,056 6.3bn 302 1.6bn 290 1.7bn Industrial 176 2.2bn 35 0.9bn 66 0.4bn Agricultural 82 0.5bn 64 0.2bn 33 0.4bn Municipal 157 1.2bn 47 0.4bn 43 0.5bn Accumulation 80,049 41.5bn 26,675 13.3bn 28,536 10.6bn With crops 42.6bn 14.7bn 12.3bn Sacramento River
hydrologic region San Joaquin Riverhydrologic region Tulare Lakehydrologic region
1-in-100-year flood extent
Number of risks Value $ Number of risks Value $ Number of risks Value $
Residential 84,101 33.3bn 34,857 12.6bn 30,528 9.1bn Commercial 1,145 6.9bn 374 2.1bn 404 2.3bn Industrial 186 2.3bn 78 1.1bn 44 0.5bn Agricultural 93 0.6bn 41 0.2bn 79 0.5bn Municipal 196 1.4bn 58 0.5bn 59 0.6bn Accumulation 85,721 44.5bn 35,408 16.5bn 31,114 12.9bn With crops 46.2bn 18.4bn 15.2bn
In order to rationalise these potential accumulations, present exposure is compared against the size and severity of flooding for a number of historical events. Ground-up losses have been estimated by applying indicative damage ratios based on the United States Army Corps of Engineers (USACE) depth damage functions5 and JBA’s modelled water depths. These ratios
give typical damages of between 20 and 40% of the
total property value. Exposure and a range of potential loss given these ratios is provided in Table 5 below. Insurance penetration, event windows, crop losses and (re)insurance terms and conditions are not considered. Two plausible events have also been developed for comparison. Further context is provided by Figure 5 which compares losses for the Lloyd’s River Thames flood Realistic Disaster Scenario.
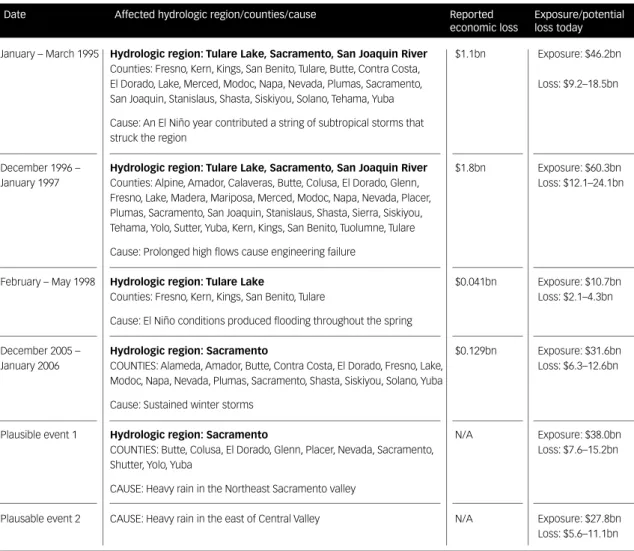
Table 5: Reported loss for historical events with present exposure and potential loss
Date Affected hydrologic region/counties/cause Reported Exposure/potential
economic loss loss today January – March 1995 December 1996 – January 1997 February – May 1998 December 2005 – January 2006 Plausible event 1 Plausable event 2 $1.1bn $1.8bn $0.041bn $0.129bn N/A N/A Exposure: $46.2bn Loss: $9.2–18.5bn Exposure: $60.3bn Loss: $12.1–24.1bn Exposure: $10.7bn Loss: $2.1–4.3bn Exposure: $31.6bn Loss: $6.3–12.6bn Exposure: $38.0bn Loss: $7.6–15.2bn Exposure: $27.8bn Loss: $5.6–11.1bn Hydrologic region: Tulare Lake, Sacramento, San Joaquin River
Counties: Fresno, Kern, Kings, San Benito, Tulare, Butte, Contra Costa, El Dorado, Lake, Merced, Modoc, Napa, Nevada, Plumas, Sacramento, San Joaquin, Stanislaus, Shasta, Siskiyou, Solano, Tehama, Yuba Cause: An El Niño year contributed a string of subtropical storms that struck the region
Hydrologic region: Tulare Lake, Sacramento, San Joaquin River Counties: Alpine, Amador, Calaveras, Butte, Colusa, El Dorado, Glenn, Fresno, Lake, Madera, Mariposa, Merced, Modoc, Napa, Nevada, Placer, Plumas, Sacramento, San Joaquin, Stanislaus, Shasta, Sierra, Siskiyou, Tehama, Yolo, Sutter, Yuba, Kern, Kings, San Benito, Tuolumne, Tulare Cause: Prolonged high flows cause engineering failure
Hydrologic region: Tulare Lake
Counties: Fresno, Kern, Kings, San Benito, Tulare
Cause: El Niño conditions produced flooding throughout the spring Hydrologic region: Sacramento
COUNTIES: Alameda, Amador, Butte, Contra Costa, El Dorado, Fresno, Lake, Modoc, Napa, Nevada, Plumas, Sacramento, Shasta, Siskiyou, Solano, Yuba Cause: Sustained winter storms
Hydrologic region: Sacramento
COUNTIES: Butte, Colusa, El Dorado, Glenn, Placer, Nevada, Sacramento, Shutter, Yolo, Yuba
CAUSE: Heavy rain in the Northeast Sacramento valley CAUSE: Heavy rain in the east of Central Valley
Figure 5: River Thames, UK, Realistic Disaster Scenario
Comparison:
The River Thames, UK Realistic Disaster Scenario
Residential $6.7bn
Commercial/industrial $2.4bn
Agriculture $0.07bn
Motor $0.07bn
Industry property loss of $9.2bn
Source: Lloyd’s Realistic Disaster Scenarios 2015
Cities/towns Flood area OXFORD
READING
LONDON
SOUTHEND LONDON
Despite having over 20,000km of levees and flood control structures, and some 150 reservoirs on tributaries, significant flood exposure remains in the Central Valley. Most watercourses draining catchments larger than 500km2 in total are protected on both banks by levees,
but the standard of protection is variable. Figure 6 summarises the existing flood protection infrastructure. Flood infrastructure must be maintained to perform to its design standard, which requires sufficient funding for operation and maintenance from federal or state partnerships with local agencies. Analysis of the available data for some counties in the Central Valley suggests that, given current and projected operation and maintenance costs, major budget deficits could arise if all ongoing and planned infrastructure projects are built.1
Expenditure on flood management reached a high in 2007 at $2.3 billion but slowly declined between 2008 and 2013. This has resulted in the available funding for flood infrastructure being directed more towards operating expenses than to new construction.1
5 Mitigation
Ten major reservoirs in the Central Valley are operated according to rules for flood control set out by USACE; generally these ensure that storage volume is available during the flood season so that run-off from the upper catchment does not overwhelm downstream channels. Specific adjustments to the rules may be made according to recent rainfall, soil moisture and snowpack. During a flood event the state, federal and local agencies work together to forecast river levels and run-off volumes, manage dam releases, maintain levees and operate weirs, pumps and other flood infrastructure.
Management of flood infrastructure may be the responsibility of one or more local agencies, meaning overall control is complex and fragmented. Within the Central Valley hundreds of agencies have flood management responsibilities, including Irrigation Districts, Flood Control Districts, Conservation Districts, Levee Districts, city and county authorities.
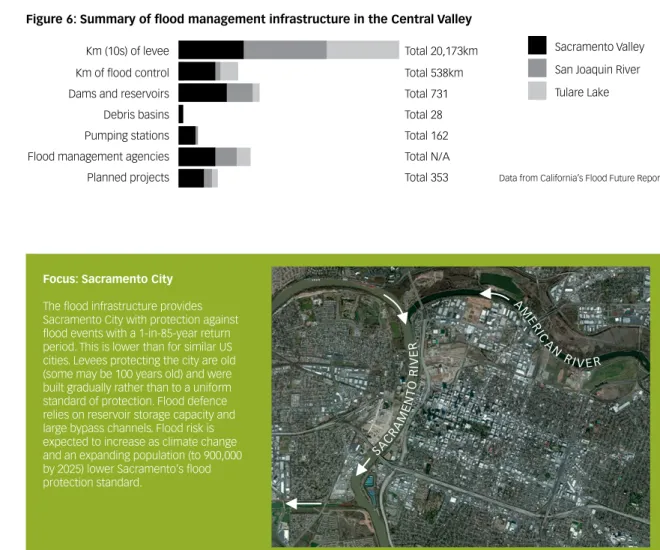
Figure 6: Summary of flood management infrastructure in the Central Valley Km (10s) of levee
Km of flood control Dams and reservoirs Debris basins Pumping stations Flood management agencies Planned projects
Total 20,173km Sacramento Valley Total 538km Total 731 Total 28 Total 162 Total N/A Total 353
San Joaquin River Tulare Lake
Data from California’s Flood Future Report
Focus: Sacramento City
The flood infrastructure provides Sacramento City with protection against flood events with a 1-in-85-year return period. This is lower than for similar US cities. Levees protecting the city are old (some may be 100 years old) and were built gradually rather than to a uniform standard of protection. Flood defence relies on reservoir storage capacity and large bypass channels. Flood risk is expected to increase as climate change and an expanding population (to 900,000 by 2025) lower Sacramento’s flood protection standard. AM E RIC AN RI V E R SACR AM EN TO RIV E R
The National Flood Insurance Program
In 1968 the US Congress passed the National Flood Insurance Act, enabling property owners in participating communities to buy flood protection insurance backed by the federal government. This insurance scheme (the National Flood Insurance Program or NFIP), is managed by FEMA. Its primary intention was to reduce government liability for flood damage by replacing public disaster aid with pay-outs funded by insurance premiums from those living in risk areas. The programme was also designed to encourage development away from floodplains, and to require improved
building standards and flood resilience for properties in floodplains.
Under the scheme, communities are eligible to participate in the NFIP if they agree to abide by floodplain management practices which will reduce future flood risks.6 In the event of flood damage to
their homes, insured owners that have purchased NFIP coverage can make a claim to cover flood-related losses. Together with the community commitment to reduce flood risk, this should limit federal aid costs from flood damage. Within Special Flood Hazard Areas (SFHAs),7
purchase of NFIP insurance is mandatory to obtain a mortgage.
Some critics of the scheme believe it has failed to discourage building in SFHAs because flood control measures have actually encouraged further ill-advised floodplain development.8
Climate change is likely to result in adjustments to the flood probabilities assigned to much of the Central Valley, with the 1-in-100 and 1-in-200-year floodplains enlarged. This will have implications for the NFIP in terms of flood insurance costs, floodplain development and the economic viability of floodplain communities.9
In recent years borrowing from the US Treasury to cover the cost of NFIP claims has increased up to an estimated $24 billion.10 A variety of factors contribute
to this financial ill health, notably the losses incurred due to Hurricane Katrina and Superstorm Sandy. Ironically, when more property owners buy the insurance, the NFIP
6 Insurance market
debt may increase as it must then make more payments following a flood. Although the law requires occupiers of all properties in the 1-in-100-year floodplain to buy flood insurance in order to obtain a mortgage from a federally backed lender, this does not always occur. Therefore, uninsured flood losses can be much higher than predicted. Additionally, the FEMA flood maps may under-represent flood risk from sources such as storm water or groundwater, resulting in uninsured claims for aid. NFIP premiums do not reflect real flood risk to a property, as they are based on historical claims information as opposed to catastrophe modelling, so the programme frequently pays out claims well in excess of the premium collected. Properties built before 1974, when flood mapping began, are eligible for lower premiums; however, these are often properties at high risk. If a property suffers repeated flood losses, a subsidised premium may even be applied, in some cases, despite previous claims exceeding the property value. The NFIP has been subject to reform through the 2012 Biggert-Waters Flood Insurance Reform Act, which phased in risk-based premiums for certain properties including where flood mapping has been updated, and the 2014 Homeowner Flood Insurance Affordability Act, which repealed some of the steep premium increases authorised under Biggert-Waters but retained requirements for a gradual phasing-in of risk-based premiums.
Private insurance market
Private insurers are playing an increasing role in the US flood insurance market alongside the NFIP. The private insurance market currently provides ‘surplus flood’ cover above the NFIP limits and force placed cover, which is offered in conjunction with banks. The insurance industry can play a role in helping businesses and communities to better understand the potential risks they face from flooding and assist in mitigating these risks. California is typically considered a potential growth market for flood insurance, but the Central Valley, in particular the Sacramento Valley, remains a challenging area to insure. The industry needs more sophisticated catastrophe modelling for the region and more investment in flood infrastructure.
Central Valley, California 18
Flood compared with other perils
Due to a number of high profile events and high exposure in the San Francisco and Los Angeles area, there has been large investment in earthquake catastrophe modelling in this region. California overlies
two tectonic plates, and the United States Geological Survey estimates that there is more than a 99% chance of the state experiencing a serious earthquake (magnitude 6.7 or greater) in the next 30 years.11 Figure 7 below
gives a comparison of potential Central Valley flood loss against potential earthquake losses from the Lloyd’s Realistic Disaster Scenarios (RDS).12
Note: RDS results give losses based on the Lloyd’s suggested property distributions and modelled damage factors. Central Valley losses are based on the HAZUS exposure data and indicative damage estimates.
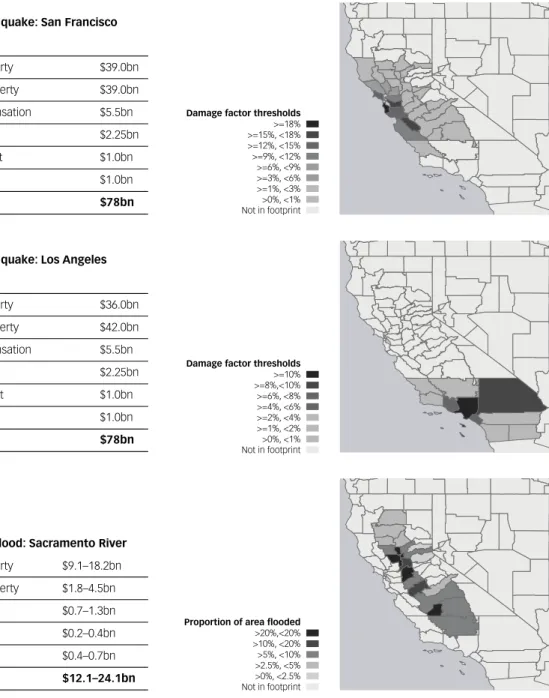
Figure 7: Comparison of potential losses – Lloyds RDS 2015 –
San Francisco and Los Angeles earthquake, vs. potential Central Valley flood
California earthquake: San Francisco
Residential property $39.0bn Commercial property $39.0bn Workers’ compensation $5.5bn Marine $2.25bn Personal accident $1.0bn Auto $1.0bn Total $78bn
California earthquake: Los Angeles
Residential property $36.0bn Commercial property $42.0bn Workers’ compensation $5.5bn Marine $2.25bn Personal Accident $1.0bn Auto $1.0bn Total $78bn
Central Valley flood: Sacramento River Residential property $9.1–18.2bn Commercial property $1.8–4.5bn Industrial $0.7–1.3bn Agricultural $0.2–0.4bn Municipal $0.4–0.7bn Total $12.1–24.1bn
Damage factor thresholds
>=18% >=15%, <18% >=12%, <15% >=9%, <12% >=6%, <9% >=3%, <6% >=1%, <3% >0%, <1% Not in footprint
Damage factor thresholds
>=10% >=8%,<10% >=6%, <8% >=4%, <6% >=2%, <4% >=1%, <2% >0%, <1% Not in footprint
Proportion of area flooded
>20%,<20% >10%, <20% >5%, <10% >2.5%, <5% >0%, <2.5% Not in footprint
Central Valley, California 20
Flooding remains a significant natural peril in Central Valley, California. Although there are extensive flood defences in place, these generally have a standard of protection less than the 1-in-100-year flood; even if upkeep programmes maintain this protection, it is likely to be gradually eroded by climate change. Further, population expansion is likely to cause pressure for urban development on protected floodplains, thereby increasing risk.
With the benefit of recent flood modelling and mapping, it is relatively straightforward to estimate in detail the population at flood risk in Central Valley. It is much harder to assess the protection available against this risk and potential losses for property and agriculture.
7 Conclusion
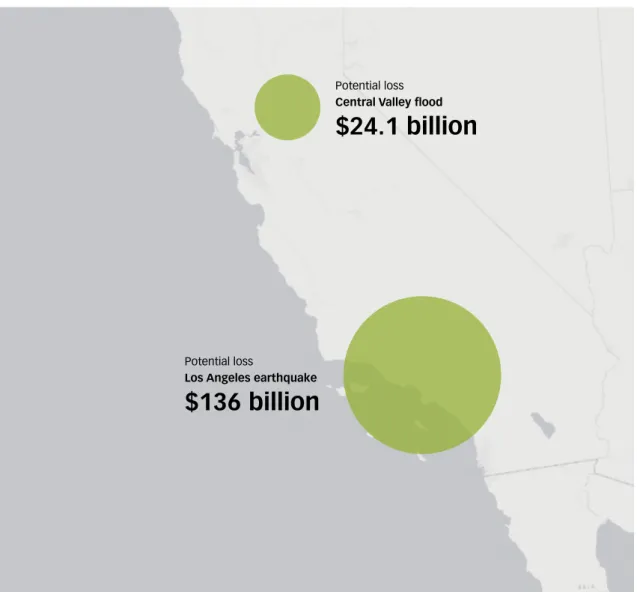
Based on current estimates of population and assets, a likely event with an approximate 1-in-100-year return period could result in $24.1 billion of damage to floodplain assets in Central Valley. This can be compared with the estimate of damage from a severe earthquake of $136 billion (direct liability, 2010 property values)13
(Figure 8).
In order to examine the potential exposures in more detail, a deterministic scenario could be developed or a full probabilistic catastrophe model could be used to build up a broad picture of potential losses and examine the uncertainty.
Potential loss Central Valley flood
$24.1 billion
Potential loss
Los Angeles earthquake
$136 billion
Central Valley, California 22
8 Endnotes
1 California Department of Water Resources. 2013. California’s Flood Future: Recommendations for Managing the State’s Flood Risk. Available from: www.water.ca.gov/sfmp/resources.cfm#floodreport 2 United States Census Bureau. 2015. QuickFacts.
[Online]. Available from:
www.census.gov/quickfacts/#table/PST045214/00 3 United States Federal Emergency Management Agency.
2015. HAZUS. [Online]. Available from: www.fema.gov/hazus
4 Great Valley Center. 2009. Indicators Report Series: The Economy. 3rd edn. Available from:
www.greatvalley.org/work/indicators
5 United States Army Corps of Engineers Institute for Water Resources. 1992. Catalog of Residential Depth-Damage Functions Used by the Army Corps of Engineers in Flood Damage Estimation. Available from: http://planning.usace.army.mil/toolbox/library/ IWRServer/92-R-3.pdf
6 United States Federal Emergency Management Agency. 1986. A Unified National Program for Floodplain Management. Available from:
www.fema.gov/media-library-data/20130726-1503-20490-9177/fema100.pdf 7 The SFHA is the area where the NFIP floodplain
management regulations must be enforced and where the mandatory purchase of flood insurance applies. See: www.fema.gov/special-flood-hazard-area
8 Hanscom, G. 2014. Flood pressure: Climate disasters drown FEMA’s insurance plans. [Online]. Available from: http://grist.org/cities/flood-pressure-how-climate- disasters-put-femas-flood-insurance-program-underwater/
9 California Department of Water Resources. 2012. FloodSAFE California: 2012 Central Valley Flood Protection Plan. Available from:
www.water.ca.gov/floodsafe/publications/ 10 Business Insurance. 2014. Commentary: National
Flood Insurance Program is drowning in debt. [Online]. Available from:
www.businessinsurance.com/article/20140330/ NEWS04/303309980
11 United States Geological Survey. 2008. Forecasting California’s Earthquakes – What Can We Expect in the Next 30 Years? Available from:
http://pubs.usgs.gov/fs/2008/3027/
12 Lloyd’s. 2015. Realistic Disaster Scenario Specification 2015. Available from:
www.lloyds.com/the-market/tools-and-resources/ research/exposure-management/realistic-disaster-scenarios
13 California Department of Insurance. 2012. California Earthquake Zoning and Probable Maximum Loss Evaluation Program. Available from:
www.insurance.ca.gov/0400-news/0200-studies-reports/