People screening using terahertz technology
Colin Baker, William R. Tribe, Thomas Lo, Bryan E. Cole, Simon Chandler, Michael C. Kemp
*TeraView Ltd, Platinum Building, St John’s Innovation Park,
Cambridge, CB4 0WS, United Kingdom
ABSTRACTThere is a need for ever more effective security screening to detect an increasing variety of threats. Many techniques employing different parts of the electromagnetic spectrum from radio up to X- and gamma-ray are in use. Terahertz radiation, which lies between microwave and infrared, is the last part to be exploited for want, until the last few years, of suitable sources and detectors. Terahertz imaging and spectroscopy has been shown to have the potential to use very low levels of this non-ionising radiation to detect and identify objects hidden under clothing. This paper describes recent work on the development of prototype systems using terahertz to provide new capabilities in people screening - both at security checkpoints and stand-off detection for remote detection of explosives and both metallic and non-metallic weapons.
Keywords: Terahertz, security screening, THz stand-off detection, THz wand, explosives detection
1. INTRODUCTION
The terahertz (THz) region of the electromagnetic spectrum is typically considered to occupy 300 GHz to 10 THz, bridging the gap between millimeter waves and the infrared. Recent developments have started to address the previous lack of sources and sensitive detectors in this range.1,2 Consequently, the technological advances have been accompanied by much interest in possible applications in the security,3,4 pharmaceutical,5 non-destructive testing (NDT),6 and medical industries.7,8
There are unique properties of THz radiation that make it a potentially powerful technique in security screening. Firstly, THz radiation penetrates many everyday physical barriers such as typical clothing and packing materials with modest attenuation.3 Secondly, many chemical substances and explosive materials exhibit characteristic spectral responses at THz frequencies that can be used for threat object identification.4 Additionally, being at sub-millimeter wavelengths, THz radiation is of low energy and non-ionising. THz techniques, therefore, combine safe-to-use high-resolution imaging, and the identification through spectroscopy of threat materials – even when hidden in packages or under clothes.
THz imaging systems can be passive, simply detecting the THz part of the thermal black-body radiation given off by objects. Alternatively, active schemes can be implemented whereby the object being imaged is illuminated by a THz source. Whilst passive systems may be effective for 2-D low frequency (e.g. 100 GHz) millimeter wave imaging, chemical/structural analysis of suspect objects is restricted to higher frequency techniques, since there are virtually no spectroscopic features in solids below 500 GHz. Active techniques, such as terahertz pulsed imaging (TPI), and terahertz continuous wave (TCW) imaging can be several times more sensitive. Pulsed techniques enable 3-D imaging, much like radar by using time of flight analysis providing increased contrast and discrimination.
Thus by combining imaging and spectroscopy THz has the potential to be an important tool for the detection of hidden metallic and non-metallic objects, such as ceramics and explosives, for people screening.
In this paper, we discuss some of the important factors involved in addressing practical systems in the security industry, and describe two ongoing development programmes for use in people screening applications. The first is a stand-off detection system, aimed at detecting threats such as explosives using spectroscopy at a distance. The second project is a hand-wand which is intended to operate much like a hand-held metal detector wand, but which will also detect
non-metallic weapons and explosives.
*[email protected]; phone: +44 1223 435380; fax: +44 1223 435382; www.teraview.com
2. TERAHERTZ SYSTEMS
Established experimental THz systems are largely based on photoconductive switches, which rely on the production of few-cycle THz pulses using an ultrafast (femtosecond) laser to excite a biased photoconductive antenna. This technique is inherently broadband, with the emitted power distributed over several THz (typically 0.1 – 4 THz). Pulsed THz emission in photoconductive antennas is produced when the current density, j, of a biased semiconductor is modulated on subpicosecond timescales ETHz∝dj/dt.9 The change in current density, and hence photocurrent, arises from two
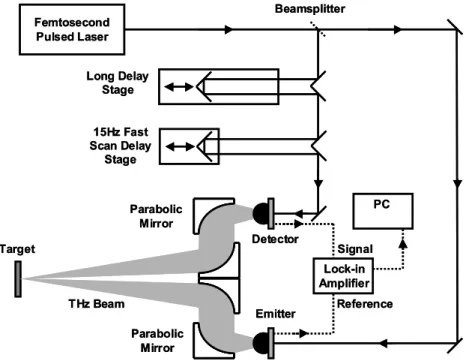
processes: the rapid change of the carrier density via femtosecond laser illumination, and the acceleration of photogenerated carriers under an external electric field.10 Coherent detection of the incident THz radiation can be performed in a similar photoconductive antenna circuit.11-14 By gating the photoconductive gap with a femtosecond pulse synchronised to the THz emission, a dc signal that is proportional to the THz electric field may be measured. Further, by varying the optical path length to the receiver, the entire THz time domain can be sampled. Hence both the amplitude and phase of the incident THz wave can be obtained, and a dynamic range of ~60 dB demonstrated using time-gated detection.15 Femtosecond Pulsed Laser Beamsplitter Long Delay Stage Detector Emitter Target 15Hz Fast Scan Delay Stage Lock-in Amplifier PC Signal Reference Parabolic Mirror Parabolic Mirror THz Beam Femtosecond Pulsed Laser Beamsplitter Long Delay Stage Detector Emitter Target 15Hz Fast Scan Delay Stage Lock-in Amplifier PC Signal Reference Parabolic Mirror Parabolic Mirror THz Beam
Fig. 1. Schematic of a THz photoconductive system. In this example, specifically designed for stand-off explosives detection, the THz beam is manipulated for reflection spectroscopy of a target material.
In a typical pulsed THz system (see figure 1), the beam from the ultrafast femtosecond laser is split by a beamsplitter into two components, a pump beam and probe beam, used to illuminate the emitter and receiver respectively. A motorised delay stage is then incorporated into the probe beam to vary the difference in optical delay around zero between the incoming THz pulse and the probe laser pulse at the detector. A rapid scanning delay line is often utilised since it allows both the delay position and the lock-in output to be digitized and re-interpolated to obtain the THz field as a function of optical delay in real time. The frequency Fourier transform can then also be displayed in real-time on a computer display. Typically, the output from the THz emitter is coupled from the rear surface of the device using a high-resistivity silicon lens, which, in combination with off-axis parabolic mirrors/lenses, allows the THz beam to be manipulated as required. Additionally, to couple the THz radiation from free-space into the receiver, a second silicon lens in contact with the rear of the receiver chip is used.
The THz emitter and detector are manufactured from SI and LT GaAs materials respectively, using, for the detectors, recently developed materials processing techniques.18 A bias of 50 V was applied across the emitter electrodes, and the gated output signal from the receiver was fed to a lock-in amplifier.
3. SPECTROSCOPY OF EXPLOSIVE MATERIALS
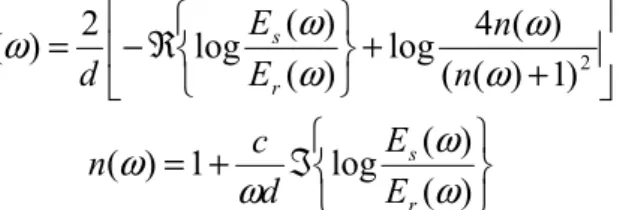
To validate that THz technology is capable of detecting explosives, we first measured the spectrum of various common explosives in transmission. This was performed using our commercially available transmission spectrometer, TPI spectra 1000. In transmission the THz field is modified by dispersion and the absorption of the media under examination. The ratio of the electric field strength before Er(ω) and after transmission Es(ω), is given by:
−
+
−
=
c
d
n
d
t
E
E
n r sα
ω
ω
ω
ω
ω
ω)
1
)
(
(
2
)
(
exp
)
(
)
(
) ((
)
2 ) (1
)
(
)
(
4
+
=
ω
ω
ωn
n
t
nwhere d is the thickness of the sample, ω the frequency of the radiation, c the speed of light, and tn(ω) is the reflection loss at the sample surface as defined above. Hence, in transmission spectroscopy both the refractive index n(ω) and the absorption coefficientα(ω) can be determined from the measured amplitude and phase information by:
+
+
ℜ
−
=
2)
1
)
(
(
)
(
4
log
)
(
)
(
log
2
)
(
ω
ω
ω
ω
ω
α
n
n
E
E
d
r s
ℑ
+
=
)
(
)
(
log
1
)
(
ω
ω
ω
ω
r sE
E
d
c
n
In figure 2 we show the absorption spectra (solid line) and refractive index (dashed line) of Semtex-H. The features appearing in the absorption spectra of Semtex-H can be understood from the constituent explosives. Semtex-H consists of approximately equal amounts of RDX and PETN, with the remainder comprising of poly(butadiene-styrene) and oil. It can be seen that the absorption of Semtex-H is the sum of its active constituents, shown as the dotted line.
10 20 30 40 50 60 70 80 90 100 110 0 10 20 30 40 50 60 70 80 0.3 0.6 0.9 1.2 1.5 1.8 2.1 2.4 2.7 3.0 3.3
Frequency/THz
Wavenumber/cm
-1A
bsorpti
on/cm
-1 1.5 1.6 1.7 1.8Refractive index
Fig. 2. The THz absorption spectra (solid line) and refractive index (dashed line) of Semtex-H. The dotted line shows the combined absorption spectra of RDX and PETN.
Despite the high sensitivity and dynamic range of THz pulsed spectroscopy (TPS) techniques any practical implementation of a people screening system will need to work in reflection rather than transmission geometry. From the refractive index, as determined from transmission spectroscopy, the reflectance can be determined. The reflectance,
defined as the frequency dependent ratio of the reflected intensity to the incident intensity, is related approximately to the refractive index by:
2
1
)
(
1
)
(
)
(
+
−
≈
ω
ω
ω
n
n
R
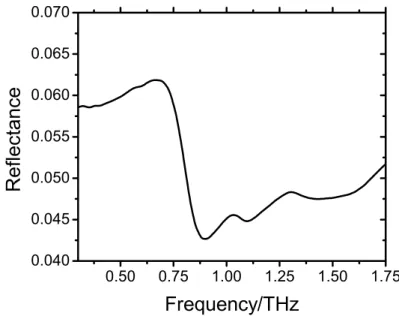
Thus using transmission spectroscopy it is possible to determine the expected result from a reflection spectroscopy measurement. Figure 3 shows the expected reflectance of Semtex-H as determined from the above equation.
0.50 0.75 1.00 1.25 1.50 1.75 0.040 0.045 0.050 0.055 0.060 0.065 0.070
Refl
ectance
Frequency/THz
Fig. 3. The calculated reflection spectrum of Semtex-H, as determined by the above equation using transmission spectroscopy.
4. TERAHERTZ HAND-HELD WAND
As reported in reference [17] we have recently developed a prototype THz hand-held detection and identification wand that, as well as metals, can also detect and identify hidden non-metallic objects and explosives.
Such a system would have a number of benefits over current checkpoint screening approaches. The key benefit would be improved detection of explosives and non-metallic weapons without the need for hand searches, which are both time consuming and invasive to passengers. Other benefits include the more reliable identification of threat materials, reduced false alarms, and reduced inconvenience to passengers. These would contribute both to reducing staff costs and increasing throughput.
Fig. 4. Photograph of the THz wand prototype. The system is based around the TPI-core system.
The wand prototype, as shown in figure 4, is driven by a TeraView Ltd TPI core system adapted to support multiple devices and to meet the specific needs of the application. In our prototype, the output of an ultrafast femtosecond laser (as described in section 3) is split into two beams, a pump and probe beam by an 80% reflective high-energy beamsplitter. A rapid scanning delay line (oscillating at 30 Hz), and a conventional long delay stage is incorporated into the probe beam. The pump beam is coupled into a single optical fibre to illuminate the THz photoconductive emitter. However, the probe beam is further split into six beams of equal power by beamsplitters, and coupled into multiple fibres to illuminate six photoconductive detectors. The photoconductive THz emitter is coupled to a silicon lens located at the centre of a head unit, and generates a quasi-collimated beam of THz radiation. The six photoconductive THz detectors are incorporated in the head unit, and surround the emitter, each with a silicon lens to capture the reflected and scattered THz signal in multiple directions from the target. The signals from each detector can be analysed independently to form both spatial and spectroscopic information of the target.
Much of the development work has been creating a compact design/layout of the optical components and the probe head, whilst in parallel developing more powerful sources and highly sensitive detectors.
Using the THz wand we have successfully identified targets consisting of pieces of metal, ceramic, plastic, and SX2 plastic sheet explosive, hidden beneath up to three layers of cotton, polyester, or leather. A typical measured B-scan is shown in figure 5 for the case of an SX2 target concealed beneath two layers of leather. The horizontal axis represents the optical time delay, and relates directly to the wand target distance. The vertical axis represents time of acquisition. As the wand is moved over the target region at a constant speed, the time of acquisition relates directly to the wand position with respect to the target. The scale shows the THz field amplitude at each point.
In figure 5, THz reflections from both the front and back sides of the target are evident (since SX2 is largely transparent at low frequencies). The higher refractive index of the SX2 compared to the surrounding air means that the back-side reflection is somewhat delayed in time, with the result that the back-side of the target appears beyond the level of the target skin. The front-side of the target generates a reflection earlier in time and the combination of these two yields a very clear “gap” in the otherwise uninterrupted skin reflection. The clothing layers are also clearly visible in the B-scan data.
Fig. 5. THz B-scan plots showing the THz reflection obtained through 2 layers of leather both with (shown right), and without (shown left) a piece of sheet explosive SX2 against the skin.
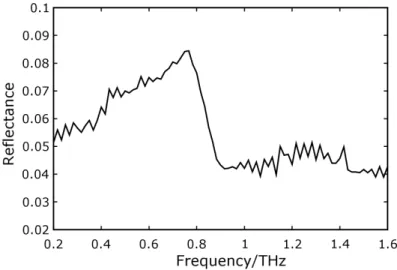
To demonstrate the spectroscopic capabilities of the THz wand, figure 6 shows measured reflection spectra (acquired in a time of 1/30 seconds) from the RDX-based sheet explosive SX2. The absolute reflectance was determined by division of the measured power spectrum, by a power spectrum from a mirror reference, measured in an otherwise identical fashion. A clear feature is present in the reflection spectra centered at 0.8 THz, which agrees well with the predicted reflection spectra of SX2, calculated from experimental transmission data measured, as described in Section 3.
Currently algorithms are being developed for automatic identification of hidden objects based on edge detection of hard objects beneath layered materials, and matching spectra with known features of common explosives.
5. STAND-OFF EXPLOSIVES DETECTION
For many THz applications, including security screening, it may be necessary to perform measurements in reflection over a distance through the atmosphere. In this paper we demonstrate for the first time the spectroscopic detection of concealed explosives at a stand-off distance of 1 m, both real time, in reflection, and under normal atmospheric conditions.
A schematic of the pulsed THz photoconductive system used is shown in figure 1. In our setup, a Coherent Vitesse laser was used to generate pulses of average power 800 mW, at 800 nm centre wavelength, 80 MHz repetition rate, and with a bandwidth-limited pulse duration of 80 fs. As described in Section 2, the output of the ultrafast laser was split into two components, a pump beam and probe beam, used to illuminate the emitter and receiver respectively. This was achieved by using a high-energy beamsplitter, with 80% of the beam being reflected into the probe beam, and 20% transmitted as the pump beam. A rapid scanning delay line oscillating at 15 Hz, and a 1000 mm delay stage were incorporated into the probe beam. The optical laser powers at the emitter and receiver were controlled by using neutral density filter wheels in both the pump and probe beams. In this arrangement, the pump and probe laser powers incident on the photoconductive devices were measured to be 5 mW, and 20 mW respectively.
The optical scheme for the THz radiation was as follows: the generated THz radiation from the photoconductive emitter was coupled from the rear surface of the device using a high-resistivity silicon hyperhemispherical lens, which, in combination with an f /1 off-axis gold parabolic mirror, collimated the THz beam. This was then focused and directed onto a target object at a stand-off distance of 1 m by second off-axis parabolic reflector. The reflected THz beam from the target object then followed an identical reverse scheme, using two parabolic mirrors and a hyperhemispherical silicon lens, allowing the THz beam to be focused onto the photoconductive gap of the receiver. This allows us to perform single point reflection spectroscopy of targets at a stand-off distance of 1 m.
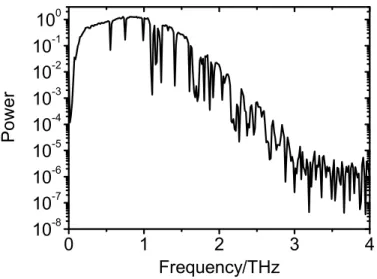
As a demonstration of the performance (measured in rapid scan and collected in a time of 1/15 seconds), figure 7 shows the measured power spectrum with a mirror placed at the focal plane. From Figure 7, we show that, at a stand-off distance of 1 m, a system dynamic range of >60 dB, and a spectral bandwidth extending from 0.1 THz to about 3.0 THz is demonstrated. Sharp absorption features can be seen in the THz spectrum shown in figure 7, which correspond to atmospheric water vapor line – these can be removed algorithmically from the spectrum. These absorption bands in the THz spectrum are occurring after traversing a total path length of 2.4 m through the atmosphere. It can be seen that there are numerous water attenuation windows through which the signal is relatively unattenuated.
0
1
2
3
4
10
-810
-710
-610
-510
-410
-310
-210
-110
0Power
Frequency/THz
Fig. 7. The power spectrum from the stand-off system with a mirror as the target material. The sharp absorption lines in the spectrum are due to atmospheric water vapour, with the THz path length equal to 2.4 m.
In figure 8, we show a reflection measurement from two explosive samples, (a) Semtex-H, and (b) SX2, taken using the stand-off instrument at a distance of 1m, measured in rapid scan and collected in a time of 1/15 seconds. As before, the absolute reflectance was determined by division of the measured power spectrum, by a power spectrum from a mirror reference, measured in an otherwise identical fashion (see figure 7). Also shown in figures 8 (a) and (b) are the predicted reflection spectra of Semtex-H and SX2. The agreement between calculation and experiment is excellent, with features being observed in both spectra at 0.8 THz, 1.05 THz and 1.4 THz. For the measured spectra, data processing techniques were applied real time to the dataset to remove the water vapor absorption lines i.e. both the data acquisition and data processing was performed in 1/15 seconds.
0.50 0.75 1.00 1.25 1.50 1.75 2.00 0.02 0.04 0.06 0.08 Re fle ctance Frequency/THz 0.50 0.75 1.00 1.25 1.50 1.75 2.00 0.02 0.04 0.06 0.08 0.10 Re flect a nce Frequency/THz
Fig. 8.The measured (solid line) and calculated (dashed line) reflectance spectra of (a) Semtex-H, and (b) SX2 at a stand-off distance of 1 m, under normal atmospheric conditions, taken real time. The calculated spectra were derived from transmission spectroscopy data.
Also, there is agreement between the frequencies of the spectral features of Semtex-H and SX2. This is to be expected because both explosives contain substantial components of RDX, which dominate the spectral features over the frequency range of the figure. Since SX2 is predominately RDX (over 80% by volume), whereas Semtex-H contains only around 40%, the spectral features in SX2 are stronger than those from Semtex-H.
0.50 0.75 1.00 1.25 1.50 0.00 0.01 0.02 0.03 0.04 0.05 0.06 0.07 Refl ect a nce Frequency/THz
Increasing layers of cotton
0.50 0.75 1.00 1.25 1.50 -0.20 -0.15 -0.10 -0.05 0.00 0.05 0.10 0.15 0.20 0 layers Cotton 1 layers Cotton 2 layers Cotton 3 layers Cotton 4 layers Cotton Derivat ive Reflectance Frequency/THz
Fig. 9. (a) The reflectance of SX2 behind cotton clothing, and (b) the first derivative of the reflectance of SX2 behind cotton clothing. The RDX spectral feature is clearly visible in (b) through 4 layers of cotton.
Clearly clothing is crucial to the prospect of practical stand-off detection. We have performed a series of measurements of explosives hidden behind increasing numbers of clothing layers. Shown in figure 9(a) is the effect of increasing numbers of clothing layers on the 1 m spectrum of SX2 sheet explosive. The clothing layers were from a typical cotton/polyester shirt loosely placed in front of the explosives, in a manner consistent with normal wear. As before, these measurements were taken at a distance of 1 m, in a time 1/15 second, and with automated water vapor removal. The
(a)
(b)
rapidly diminishing reflectance, as the frequency rises, is a straightforward consequence of the exponentially increasing attenuation of clothing layers with frequency – the clothing layers acting as a low-pass filter to the spectrum. The effects of this can be visually removed by taking the derivative the reflectance spectrum, as shown in figure 9(b). The reflectance feature of SX2 centered at 0.8 THz manifests itself as an oscillation in the derivative spectrum. Although difficult to recognize from the linear scaling of figure 9(a), the derivative spectra (figure 9(b)) clearly shows that we can convincingly identify spectral features through several layers of clothing.
As we have discussed in this paper, there are characteristic spectral features in many common types of explosives materials at THz frequencies. Relatively few other materials have strong spectral features in the range of 0.5 to 1.0 THz. A substance that does exhibit interesting features in this range is D-tartaric acid, as shown in figure 10. This measurement was performed in reflection at a stand-off distance of 1 m, and was acquired under normal atmospheric conditions, hence data processing algorithms to remove water vapor noise features. Both acquisition and data processing were performed in a time of 1/15 second. For comparison the calculated reflectance spectra of D-tartaric acid is shown as the dashed line in figure 10, as determined from transmission spectroscopy. Again we can see an excellent agreement between calculation and experiment. Although the form of the reflection spectrum of D-tartaric acid is similar to that of RDX, the center frequency and magnitude is different, demonstrating that we can spectrally distinguish between explosives and other materials in reflection.
0.50 0.75 1.00 1.25 1.50 1.75 0.02 0.04 0.06 0.08 0.10 0.12
Refl
ectan
ce
Frequency/THz
Fig. 10. The measured (solid line) and calculated (dashed line) reflection spectrum of tartaric acid at a stand-off distance of 1 m. This demonstrates the ability of the technique to distinguish between materials.
6. CONCLUSION
In this paper, we have discussed some of the important factors involved in addressing practical systems in the security industry, and presented results from two prototype THz systems specifically designed for security applications. Firstly, a THz hand held wand for detection of concealed objects, to be used much like a metal detector. Using the THz wand we have successfully identified explosive, metallic and non-metallic targets hidden beneath several layers of clothing. We have also successfully measured spectroscopic features from SX2 sheet explosive in reflection using the wand at a 30 Hz scan rate. Secondly, we have demonstrated a prototype terahertz stand-off detection system. Using this apparatus we have verified spectroscopic detection of explosives at a stand-off distance of 1 m, both real time, in reflection, under normal atmospheric conditions, and behind several layers of clothing.
ACKNOWLEDGEMENTS
Parts of this work were carried out under contract for the UK Government whose support is gratefully acknowledged.
REFERENCES
1. D. H. Auston, ‘Picosecond optoelectronic switching and gating in silicon’, Appl. Phys. Lett., 26, pp. 101-103, 1975.
2. P. Uhd Jepsen, R. H. Jacobsen, S. R. Keiding, ‘Generation and detection of terahertz pulses from biased semiconductor antennas’, J. Opt. Soc. Am. B, 13, pp. 2424-2436, 1996.
3. M.C. Kemp, P.F. Taday, B.E. Cole, J.A. Cluff, A.J. Fitzgerald and W.R. Tribe, ‘Security applications of terahertz technology’, SPIE 5070, 44, 2003.
4. W.R. Tribe, D.A. Newnham, P.F. Taday and M.C. Kemp, ‘Hidden object detection: security applications of terahertz technology’, SPIE 5354, 168, 2004.
5. C. J. Strachan, P. F. Taday, D. A. Newnham, K. C. Gordon, J. A. Zeitler, M. Pepper, and T. Rades, ‘Using terahertz pulsed spectroscopy to quantify pharmaceutical polymorphism and crystallinity’, Journal of
Pharmaceutical Sciences, 94, pp. 837-846, 2005.
6. D. M. Mittleman, R. H. Jacobsen, M. C. Nuss. ‘T-Ray Imaging’ IEEE J. Selected Topics in Quantum
Electronics, 2, pp. 679-692, 1996.
7. E. Pickwell, B. E. Cole, A. J. Fizgerald, M. Pepper, and V. P. Wallace, ‘In vivo study of human skin using pulsed terahertz radiation,’ Physics in Medicine and Biology, 49, pp. 1595-1607, 2004.
8. V. P. Wallace, A. J. Fizgerald, S. Shankar, N. Flanagan, R. Pye, J. Cluff, and D. D. Arnone, ‘Terahertz pulsed imaging of basal cell carcinoma ex vivo and in vivo,’ British Journal of Dermatology, 151, pp. 424-432, 2004. 9. P. R. Smith, D. H. Auston, and M. C. Nuss, ‘Subpicosecond photoconducting dipole antennas,’ IEEE J.
Quantum Electronics, 24, pp. 255-260, 1988.
10. Z. Piao, M. Tani, and K. Sakai, ‘Carrier dynamics and terahertz radiation in photoconductive antennas,’ Jpn. J.
Appl. Phys., 39, (Part 1), pp. 96-100, 2000.
11. F. W. Smith, H. Q. Le, V. Diadiuk, M. A. Hollis, A. R. Calawa, S. Gupta, M. Frankel, D. R. Dykaar, G. A. Mourou, and T. Y. Hsiang, ‘Picosecond GaAs-based photoconductive optoelectronic detectors,’ Appl. Phys.
Lett., 54, pp. 890–892, 1989.
12. Y. Chen, S. Williamson, T. Brock, F. W. Smith, and A. R. Calawa, ‘375-GHz-bandwidth photoconductive detector,’ Appl. Phys. Lett., 59, pp. 1984–1986, 1991.
13. M. Tani, K. Sakai, and H. Mimura, ‘Ultrafast photoconductive detectors based on semi-insulating GaAs and InP,’ Jpn. J. Appl. Phys., 36, pp. L1175–L1178, 1997.
14. S. Kono, M. Tani, P. Gu, and K. Sakai, ‘Detection of up to 20 THz with a low-temperature-grown GaAs photoconductive antenna gated with 15 fs light pulses,’ Appl. Phys. Lett., 77, pp. 4104–4106, 2000.
15. C. Baker, I. S. Gregory, W. R. Tribe, I. V. Bradley, M. J. Evans, M. Withers, P. F. Taday, V. P. Wallace, E. H. Linfield, A. G. Davies, M. Missous, ‘Terahertz pulsed imaging with 1.06 µm laser excitation’, Appl. Phys. Lett.,
83, pp. 4113-4115, 2003.
16. I. S. Gregory, C. Baker, W. R. Tribe, M. J. Evans, H. E. Beere, E. H. Linfield, A.G. Davies, and M. Missous, ‘High resistivity annealed low-temperature GaAs with 100 fs lifetimes,’ Appl. Phys. Lett., 83, pp. 4199-4201, 2003.
17. C. Baker, W. R. Tribe, B. E. Cole, and M. C. Kemp, ‘Developments in people screening using terahertz technology,’ SPIE 5616, pp. 61-68, 2004.