April 2016
NASA-TM-2016-219181
Unmanned Aircraft Systems Human-in-the-Loop
Controller and Pilot Acceptability Study: Collision
Avoidance, Self-Separation, and Alerting Times
(CASSAT)
James R. Comstock, Jr., Rania W. Ghatas, Michael J. Vincent, Maria C. Consiglio, and César Muñoz
Langley Research Center, Hampton, Virginia James P. Chamberlain
Sunrise Aviation Inc., Newport News, Virginia Paul Volk
Adaptive Aerospace Group, Hampton, Virginia Keith E. Arthur
Langley Research Center, Hampton, Virginia
NASA STI Program . . . in Profile
Since its founding, NASA has been dedicated to the advancement of aeronautics and space science. The NASA scientific and technical information (STI) program plays a key part in helping NASA maintain this important role.
The NASA STI program operates under the auspices of the Agency Chief Information Officer. It collects, organizes, provides for archiving, and disseminates NASA’s STI. The NASA STI program provides access to the NTRS Registered and its public interface, the NASA Technical Reports Server, thus providing one of the largest collections of aeronautical and space science STI in the world. Results are published in both non-NASA channels and by NASA in the NASA STI Report Series, which includes the following report types:
• TECHNICAL PUBLICATION. Reports of
completed research or a major significant phase of research that present the results of NASA
Programs and include extensive data or theoretical analysis. Includes compilations of significant scientific and technical data and information deemed to be of continuing reference value. NASA counter-part of peer-reviewed formal professional papers but has less stringent limitations on manuscript length and extent of graphic presentations.
• TECHNICAL MEMORANDUM.
Scientific and technical findings that are preliminary or of specialized interest, e.g., quick release reports, working
papers, and bibliographies that contain minimal annotation. Does not contain extensive analysis.
• CONTRACTOR REPORT. Scientific and
technical findings by NASA-sponsored contractors and grantees.
• CONFERENCE PUBLICATION.
Collected papers from scientific and technical conferences, symposia, seminars, or other meetings sponsored or
co-sponsored by NASA.
• SPECIAL PUBLICATION. Scientific,
technical, or historical information from NASA programs, projects, and missions, often
concerned with subjects having substantial public interest.
• TECHNICAL TRANSLATION.
English-language translations of foreign scientific and technical material pertinent to NASA’s mission.
Specialized services also include organizing and publishing research results, distributing specialized research announcements and feeds, providing information desk and personal search support, and enabling data exchange services. For more information about the NASA STI program, see the following:
• Access the NASA STI program home page at
http://www.sti.nasa.gov
• E-mail your question to [email protected]
• Phone the NASA STI Information Desk at
757-864-9658
• Write to:
NASA STI Information Desk Mail Stop 148
NASA Langley Research Center Hampton, VA 23681-2199
National Aeronautics and Space Administration Langley Research Center Hampton, Virginia 23681-2199
April 2016
NASA-TM-2016-219181
Unmanned Aircraft Systems Human-in-the-Loop
Controller and Pilot Acceptability Study: Collision
Avoidance, Self-Separation, and Alerting Times
(CASSAT)
James R. Comstock, Jr., Rania W. Ghatas, Michael J. Vincent, Maria C. Consiglio, and César Muñoz
Langley Research Center, Hampton, Virginia James P. Chamberlain
Sunrise Aviation Inc., Newport News, Virginia Paul Volk
Adaptive Aerospace Group, Hampton, Virginia Keith E. Arthur
Available from:
NASA STI Program / Mail Stop 148 NASA Langley Research Center
Hampton, VA 23681-2199 Fax: 757-864-6500
The use of trademarks or names of manufacturers in this report is for accurate reporting and does not constitute an official endorsement, either expressed or implied, of such products or manufacturers by the National Aeronautics and Space Administration.
i
Table of Contents
Table of Tables ... iv Table of Figures ... iv List of Acronyms ... v Abstract ... 1 Introduction ... 1Phase I – Air Traffic Controller Acceptability Study ... 3
1. Phase I General Information ... 3
1.1 Approach and Objectives ... 3
2. Phase I Method ... 3
2.1 Subjects ... 3
2.2 Procedure ... 4
2.3 Independent Variables ... 4
2.4 Scenarios ... 5
2.5 Communications, Navigation, and Surveillance Assumptions ... 6
2.6 Software, Hardware, and Facilities ... 7
2.7 Dependent Variables ... 7
2.7.1 Horizontal Miss Distance. ... 7
2.7.2 Alerting Times. ... 8
2.7.3 Workload Assessment. ... 8
2.7.4 System Performance Metrics. ... 9
2.7.5 Post-run Questionnaires. ... 9
3. Phase I Results ... 9
3.1 Horizontal Miss Distance Ratings ... 9
3.2 Alerting Times Ratings ... 11
4. Phase I Discussion ... 13
Phase II – Pilot Acceptability Study ... 14
5. Phase II General Information ... 14
5.1 Approach and Objectives ... 14
6. Phase II Method ... 14
6.1 Subjects ... 14
6.2 Procedure ... 15
ii
6.4 Scenarios ... 17
6.5 Communications, Navigation, and Surveillance Assumptions ... 17
6.6 Software, Hardware, and Facilities ... 17
6.7 Dependent Variables ... 17
6.7.1 Horizontal Miss Distance (DTHR). ... 17
6.7.2 Alert Times Ratings. ... 17
6.7.3 Workload Assessment. ... 17
6.7.4 System Performance Metrics. ... 17
6.7.5 Secondary Task. ... 18
6.7.6 Post-encounter Questionnaires... 18
6.7.7 Post-run Questionnaires. ... 18
7. Phase II Results ... 18
7.1 Horizontal Miss Distance Ratings ... 18
7.2 Alert Times Ratings ... 20
7.3 Distance from Well Clear Boundary ... 22
7.4 Vertical Encounters ... 26 7.5 Alerting Structures ... 28 8. Phase II Discussion ... 28 9. Conclusion ... 29 Acknowledgements ... 30 References ... 31
Appendix A – Air Traffic Operations Laboratory (ATOL) CASSAT Layout ... 32
Appendix B – Phase I Initial Questionnaire ... 33
Appendix C – Encounter Geometries from Phase I and Phase II ... 34
Head-on Encounter Geometry ... 34
Crossing Encounter Geometry ... 35
Overtake Encounter Geometry ... 36
Vertical-Crossing Encounter Geometry ... 36
Vertical-Overtake Encounter Geometry ... 37
Appendix D – Phase I Workload Ratings by Test Hour ... 38
Appendix E – Phase I End of Hour Questionnaire ... 39
Appendix F – Phase II Initial Questionnaire... 41
Appendix G – Phase II Secondary Task Questions for Sessions 1-3 ... 43
iii
iv
Table of Tables
Table 1- Independent Variables for Phase I ... 5
Table 2 - Rating scale definitions used for assessment of Horizontal Miss Distance (HMD) ... 8
Table 3 - Rating scale definitions used for assessment of Maneuver Request Timing. ... 8
Table 4 - Independent Variables for Phase II ... 16
Table 5 - Cases where CPA was less than HMD ... 25
Table of Figures
Figure 1. Chart showing McKinney National (KTKI), upper right; DFW is in the lower left. ... 6Figure 2. Controller ratings for Crossing Geometry Encounters by Horizontal Miss Distance. . 10
Figure 3. Controller ratings for Overtake Geometry Encounters by Horizontal Miss Distance. . 10
Figure 4. Controller ratings for Head-on Geometry Encounters by Horizontal Miss Distance. .. 11
Figure 5. Controller miss distance ratings by UAS alert times of 30, 45, and 75 seconds. ... 12
Figure 6. Controller timing rating by UAS alert times of 30, 45, and 75 seconds. ... 12
Figure 7. Alerting Structure "A”………...15
Figure 8. Alerting Structure "B”………...16
Figure 9. UAS Pilot ratings for Crossing Geometry Encounters ... 19
Figure 10. UAS Pilot ratings for Overtake Geometry Encounters ... 19
Figure 11. UAS Pilot ratings for Head-on Geometry Encounters. ... 20
Figure 12. UAS Pilot ratings for Crossing Geometry Encounters ... 21
Figure 13. UAS Pilot ratings for Overtake Geometry Encounters ... 21
Figure 14. UAS Pilot ratings for Head-on Geometry Encounters ... 22
Figure 15. Mean distance from Horizontal Miss Distance at CPA for Crossing Geometry Encounters... 23
Figure 16. Mean distance from Horizontal Miss Distance at CPA for Overtake Geometry Encounters... 23
Figure 17. Mean distance from Horizontal Miss Distance at CPA for Head-on Geometry Encounters... 24
Figure 18. UAS Pilot Distance ratings for Vertical Geometry Encounters for each Alert Time. All HMDs were 0.7 for Vertical Geometry Encounters ... 26
Figure 19. UAS Pilot Alert Time ratings for Vertical Geometry Encounters ... 27
Figure 20. Mean distance from Horizontal Miss Distance at CPA for Vertical Geometry Encounters... 27
v
List of Acronyms
AT Alerting Times ATC Air Traffic Control
ATOL Air Traffic Operations Laboratory ATWIT Air Traffic Workload Input Technique CA Collision Avoidance
CAS Controller Acceptability Study
CASSAT Collision Avoidance, Self-Separation, and Alerting Times CFR Code of Federal Regulations
CNS Communication, Navigation, and Surveillance CPA Closest Point of Approach
DAA Detect and Avoid
DAIDALUS Detect and Avoid Alerting Logic for Unmanned Systems DFW Dallas-Fort Worth
DTHR Distance-threshold
FAA Federal Aviation Administration GCS Ground Control Station
HMD Horizontal Miss Distance IFR Instrument Flight Rules
KTKI Airport Identifier for Collin County Airport (aka McKinney National Airport) MACS Multi Aircraft Control System
msec Millisecond
NAS National Airspace System
NASA National Aeronautics and Space Administration nmi Nautical Mile
RA Resolution Advisory (from TCAS)
RTCA Radio Technical Commission for Aeronautics SS Self-Separation
SSV Self-Separation Volume
TCAS Traffic Alert and Collision Avoidance System TCOA Time to Co-Altitude
TRACON Terminal Radar Approach Control Facility UA Unmanned Aircraft
UAS Unmanned Aircraft Systems VFR Visual Flight Rules
1
Abstract
The Federal Aviation Administration (FAA) has been mandated by the Congressional funding bill of 2012 to open the National Airspace System (NAS) to Unmanned Aircraft Systems (UAS). With the growing use of unmanned systems, NASA has established a multi-center “UAS Integration in the NAS” Project, in collaboration with the FAA and industry, and is guiding its research efforts to look at and examine crucial safety concerns regarding the integration of UAS into the NAS. Key research efforts are addressing requirements for detect-and-avoid (DAA), self-separation (SS), and collision avoidance (CA) technologies. In one of a series of human-in-the-loop experiments, NASA Langley Research Center set up a study known as Collision Avoidance, Self-Separation, and Alerting Times (CASSAT). The first phase assessed active air traffic controller interactions with DAA systems and the second phase examined reactions to the DAA system and displays by UAS Pilots at a simulated ground control station (GCS). Analyses of the test results from Phase I and Phase II are presented in this paper. Results from the CASSAT study and previous human-in-the-loop experiments will play a crucial role in the FAA’s establishment of rules, regulations, and procedures to safely, efficiently, and effectively integrate UAS into the NAS.
Introduction
Unmanned Aircraft Systems (UAS) have become the forefront of aviation technology and will soon be commonplace in the National Airspace System (NAS) as a result of the Congressional funding bill of 2012, which mandated the Federal Aviation Administration (FAA) to open the NAS to UAS. In response to this effort, and with safety being the primary concern, the National Aeronautics and Space Administration (NASA) has established a “UAS Integration in the NAS” project that spans four NASA centers, in collaboration with the FAA and industry, to examine essential safety concerns regarding the integration of UAS in the NAS. Routine access to the NAS will require UAS to have new equipage, minimum operations standards, rules and regulations, and procedures. Many supporting research efforts will be required to answer difficult questions concerning these standards, regulations, and procedures. Detect-and-avoid (DAA) implementations, self-separation (SS) procedures, and collision avoidance (CA) technologies to remain well-clear of other aircraft are top research priorities in assuring safe integration. Research efforts at NASA Langley Research Center are guiding the answer to those difficult questions to assure safe and efficient integration of UAS into the NAS. The present study focuses on DAA system acceptability to both air traffic controllers and pilots of UAS and is entitled Collision Avoidance, Self-Separation, and Alerting Times (CASSAT) human-in-the-loop experiment – a two-phase study and the third in a series of Controller Acceptability Studies (CAS).
Many hurdles accompany the safe integration of UAS in the NAS, including the requirement to see-and-avoid other aircraft per Title 14 of the United States Code of Federal Regulations (CFR) 14, Parts 91.111 and 91.113 and other applicable regulations and accepted practices. Pilots are required to follow right-of-way rules and remain well clear of other aircraft. In all airspace classes, pilots are expected to comply with these see-and-avoid requirements while also complying with Air Traffic Control (ATC) instructions and clearances or to negotiate changes to these instructions
2
and/or clearances as necessary. See-and-avoid capable pilots are generally expected to maneuver and communicate in predictable ways and in a manner that preserves the safety, orderliness, and efficiency of the Airspace system when operating in a positive control environment. UAS will likely be expected to operate in a similar manner, but with DAA replacing the see-and-avoid capability of a manned aircraft. The acceptable design space and capabilities for DAA systems in this environment are largely undefined. CAS-1 and CAS-2 controller-in-the-loop simulation experiments sought to illuminate the DAA design space for UAS operating in a positive control ATC environment. Reports on the CAS-1 study may be found in Chamberlain, Consiglio, Comstock, Ghatas, and Muñoz (2015), and Ghatas, Comstock, Consiglio, Chamberlain, and Hoffler (2015). Reports on the CAS-2 study may be found in both a NASA Technical Memorandum (TM), Comstock, Ghatas, Consiglio, Chamberlain, and Hoffler (2015), and in a conference proceedings paper, Comstock, Ghatas, Consiglio, Chamberlain, and Hoffler (2015). As an extension of CAS-1 and CAS-2, CASSAT focused on addressing minimum and maximum acceptable declaration times for projected well clear losses from the perspective of active air traffic controllers and of Instrument Flight Rules (IFR) rated pilots and explored alerting structures as DAA and CA functions are integrated.
The DAA technology employed in the present study worked much like the algorithms in the Traffic Alert and Collision Avoidance System (TCAS), but with a Self-Separation Volume (SSV), also referred to as the well-clear volume, that was large enough to avoid (a) corrective Resolution Advisories (RAs) for TCAS equipped intruders; (b) safety concerns for controllers; and, (c) undue concern for proximate see-and-avoid pilots. The present series of studies sought to determine operationally acceptable SSV sizes and look-ahead prediction times to inform system designers about required DAA surveillance range and accuracy. Guidance from the DAA system was provided to the UAS pilot to maintain positions outside the well-clear boundary. Details of the self-separation guidance shown to the UAS pilots to maintain well-clear may be found in the CAS-1 paper (Chamberlain, et al., 20CAS-15).
In addition to avoiding the issuance of TCAS RAs, the DAA system should also be designed to prevent the issuance of traffic alerts, avoid capturing the attention of, or otherwise precluding increases in workload, or prevent additional vectoring requirements for ATC and the UAS pilot. This work attempts to provide guidance for DAA standards for “well clear” (following 14 CFR §91.113) that consider these ATC and UAS pilot concerns. Further information may also be found in Consiglio et al. (2015).
3
Phase I – Air Traffic Controller Acceptability Study
1.
Phase I General Information
1.1 Approach and Objectives
The primary focus of the Phase I portion of the Collision Avoidance, Self-Separation, and Alerting Times (CASSAT) experiment was to address minimum and maximum acceptable declaration times for projected well clear losses from the perspective of active air traffic controllers. In this simulation study, controllers managed a mix of manned aircraft and DAA-equipped UAS traffic and provided ratings on acceptability of Horizontal Miss Distances (HMDs) (see section 2.7.1) when near traffic encounters occurred, acceptability of alerting times, and workload ratings during test sessions.
The following research questions, which drove the experiment design, were proposed:
A. Given a projected well clear loss, which of the three values evaluated is the minimum acceptable alert time?
B. Given a projected well clear loss, which of the three values evaluated is the maximum acceptable alert time?
C. Which, if any, of the alert times are too excessive leading to nuisance alerts for the air traffic controllers?
D. Is there an interaction between Alerting Time and Horizontal Miss Distance?
2.
Phase I Method
2.1 Subjects
Eleven active Air Traffic Controllers, with no experience at the Dallas-Fort Worth (DFW) East-side facility, were recruited to perform traffic separation tasks for the scenarios developed in the phase I study. Each of the controllers was the sole controller and performed ATC tasks in the simulated DFW East-side environment over a span of three days. To maintain a near real-world environment and workload similar to that of actual DFW traffic, background traffic was controlled by pseudo-pilots at two separate pilot stations located in another room within the Air Traffic Operations Laboratory (ATOL, see Appendix A for the layout). UAS aircraft were controlled by two additional pseudo-pilots each having access to Ground Control Station (GCS) displays showing the self-separation guidance information in real-time; ground control stations were located in a third separate room within the ATOL. Pseudo-pilots in this study refer to pilots who were either part of the research team or were trained and hired by the research team to regularly participate in the CAS studies. ATC subjects were also in communications with other controllers at towers and adjacent airspace who handled handoffs to and from the subject controller’s airspace. These “other” controllers were trained and hired by the research team to regularly participate in the CAS studies. For a visual representation of the lab layout, please see Appendix A.
4
2.2 Procedure
The traffic scenarios were designed so that there were 14 UAS traffic encounters per scenario session for six hours of evaluation, with each scenario session lasting approximately one hour. An initial questionnaire (Appendix B) and training occurred on day one. On day two, additional training runs were conducted followed by the first three hours of testing with the remaining three hours of testing on day three. UAS aircraft were controlled by two pseudo-pilots, each having access to GCS displays showing the DAA self-separation guidance information in real-time. Background traffic, to maintain the environment and workload close to that of actual DFW traffic, was controlled by pseudo-pilots at two additional pilot stations. The controller managed the manned and unmanned traffic which were all flying in the same airspace (DFW East side) and communicating with ATC by simulated Very High Frequency (VHF) radio communications. Communications with the UAS were handled the same as manned aircraft communications. The auditory communications with the UAS had a 400 millisecond (msec) delay each way to simulate terrestrial link and digital link delays. Prior results from the CAS-2 study showed that 400 msec delays were not a problem for controllers and often not noticed. UAS traffic encounters were between the UAS and Visual Flight Rules (VFR) traffic that was transmitting position and altitude information (transponding) but not in voice communications with ATC. This meant that if a maneuver was required to maintain separation, the UAS would make the maneuver. Additional IFR and VFR traffic present was traffic taking off, landing, or transitioning the airspace and communicating with the controller. Background traffic in the airspace consisted of about 50 aircraft per hour which were a mix of IFR and VFR aircraft.
2.3 Independent Variables
To address the research questions noted above, multiple independent variable of interest were examined, which included:
1. Horizontal Miss Distance (HMD). There was an adjustable parameter used in the DAA self-separation algorithms that yields a given HMD if the UAS pilot flies just at the edge of the navigation display guidance “bands.” See Chamberlain et al. (2015) for details. The UAS pilots who were part of the research team would fly at the edge of this guidance, yielding the desired HMD for each particular encounter distance, so that controllers could evaluate that distance. Simulator data yielded the actual Closest Point of Approach (CPA) during the encounter as a check to insure that the desired HMD was obtained. The controller observed the miss distance and geometry on the radar scope and evaluate the acceptability of that HMD.
2. Alerting Time. The amount of lead time the guidance presented to the UAS pilot before loss of well clear.
3. Encounter Geometry. The geometry between the aircraft in the encounter situation and the speed differentials between the encountering aircraft. The variable of interest for a minority of encounters (vertical encounters) was a “look-ahead” parameter of Time to Co-altitude (TCOA) that was used by the Detect and Avoid Alerting Logic for Unmanned Systems (DAIDALUS) algorithms.
The parameters of these independent variables are shown in Table 1. Additionally, two variables that were manipulated in the earlier CAS-1 and CAS-2 studies were held constant for this study.
5
These were a fixed wind profile of 21 knots at 3000 feet and a fixed 400 msec voice communications delay with the UAS pilot.
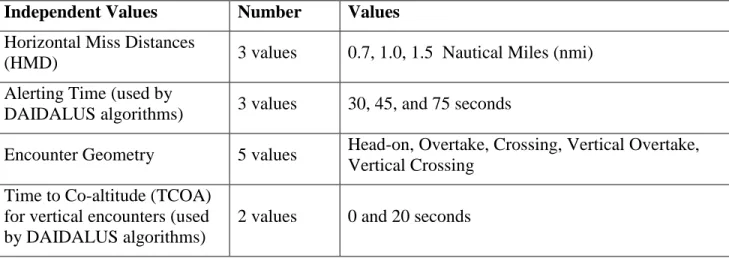
Table 1- Independent Variables for Phase I
Independent Values Number Values Horizontal Miss Distances
(HMD) 3 values 0.7, 1.0, 1.5 Nautical Miles (nmi) Alerting Time (used by
DAIDALUS algorithms) 3 values 30, 45, and 75 seconds
Encounter Geometry 5 values Head-on, Overtake, Crossing, Vertical Overtake, Vertical Crossing
Time to Co-altitude (TCOA) for vertical encounters (used by DAIDALUS algorithms)
2 values 0 and 20 seconds
The encounter geometries noted in Table 1, had the following specifications. Head-on: intruder (VFR manned) track at 180 degrees from ownship (UAS) +/- 15 degrees; Crossing: intruder track at 90 degrees from ownship +/- 15 degrees; Over-take: intruder track at 0 degrees from ownship +/- 15 degrees. The encounter speed differential for crossing geometries was +/- 60 knots. A single speed differential was used for head-on and over-take encounters. A sample of encounter geometries can be found in Appendix C.
2.4 Scenarios
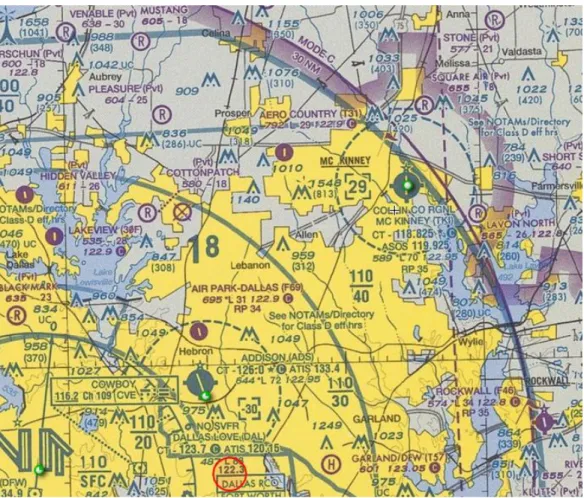
The airspace modeled for this experiment was a portion of airspace delegated to the DFW Terminal Radar Approach Control Facility (TRACON) (D10), specifically, Sector DN/AR-7 South Flow. The majority of UAS traffic arrived or departed McKinney National (FAA airport identifier: KTKI), formerly known as Collin County Regional, and is approximately 28 nautical miles (nmi) Northeast of DFW. The scenarios were designed and situated in this airspace so as to enable various encounter geometries between the UAS and intruder aircraft while manned aircraft traffic was handled in order to achieve realistic levels of workload for the Controllers. A chart of the area that was used in the initial training session on Day 1 is shown in Figure 1.
6
Figure 1. Chart used in initial training showing McKinney National (KTKI), upper right; DFW is in the lower left.
The three HMD values (shown in Table 1) were varied within the test hours such that a given encounter might follow an encounter with a different HMD. The alert time remained constant for each test hour. For a given test hour, there were 14 encounters consisting of six crossing encounters, three head-on encounters, three overtake encounters, and two vertical encounters. Each subject controlled traffic for six test hours across two days for a total of 84 encounters. Nine hundred and twenty-four (924) encounters were made for a total of eleven (11) air traffic controller test subjects.
2.5 Communications, Navigation, and Surveillance Assumptions
The experiment assumed Communication, Navigation, and Surveillance (CNS) architectures and capabilities appropriate for current-day operations in the applicable airspace classes, and that these capabilities were available to all aircraft (manned and unmanned) in the simulation environment. UAS were communicating with ATC in a similar manner to the manned aircraft. The intruders were VFR traffic that were transponding but were not in voice communications with ATC. UAS command, control, and communication capability was assumed available between Unmanned Aircraft (UA) and their respective GCS. The UA was assumed to be capable of receiving/transmitting voice communications to and from ATC facilities and proximate “party-line” aircraft via VHF radio in the same manner as manned aircraft in the same airspace and of
7
relaying these voice communications to/from the GCS pilot via one or more UA-GCS links. “Party line” refers to the open radio channel through which all aircraft in a given airspace communicate ATC; pilots are able to hear their own clearances in addition to those of the other aircraft. It was further assumed that, in addition to the relayed voice communications, the UA-GCS link(s) carried all command/control data between the UAS and GCS. The communications delays were for the voice communications channel only and no delay was introduced for UAS control or position reporting. This study assumed large size UAS (e.g., Predator or Global Hawk class). For Phase I, the UAS GCS pilots were confederate participants (not subjects). It was assumed that surveillance sensors applicable to support DAA were available and functioned without failures.
2.6 Software, Hardware, and Facilities
The displays for the UAS and manned aircraft control stations and the ATC displays were driven by modified versions of the Multi Aircraft Control System (MACS) software (Prevot, 2002), running on Windows-based computers. Modifications included incorporation of DAIDALUS algorithms to drive Navigation display “bands” which indicated a range of headings that would result in a loss of well clear with one or more traffic aircraft (Consiglio et al., 2015). The DAIDALUS algorithms are an update of the Stratway+ algorithms used in prior controller acceptability studies. These displays provided the information which guided UAS pilots to make requests for maneuvers in the encounter scenarios. Details of the appearance of the Navigation display “bands” can be found in the CAS-1 report (Chamberlain et. al., 2015). Additional information on the DAA algorithms may be found in Hagen, Butler, and Maddalon, 2011, and Muñoz et al. (2014).
2.7 Dependent Variables
2.7.1 Horizontal Miss Distance. After each traffic encounter, an ATC subject matter expert seated next to the Controller subject asked: “How was the spacing of that last encounter?” or “How acceptable was the miss distance in the previous encounter?” Subjects had a copy of the information shown in Table 2 available to them during the test sessions. They were briefed that fractional responses, such as 1.5 or 3.5, were completely acceptable. If time permitted, an explanation for the rating was asked and noted.
8
Table 2 - Rating scale definitions used for assessment of Horizontal Miss Distance (HMD). (Note that fractional values, e.g., 1.5, were acceptable)
1 Much too close; unsafe or potentially so; cause or potential cause for issuance of a traffic alert 2 Somewhat close, some cause for concern
3 Neither unsafely close nor disruptively large, did not perceive the encounter to be an issue
4
Somewhat wide, a bit unexpected; might be disruptive or potentially disruptive in congested airspace and/or with high workload
5
Excessively wide, unexpected; disruptive or potentially disruptive in congested airspace and/or with high workload
2.7.2 Alerting Times. In addition to the HMD rating after each encounter, a rating was requested on the timing of the maneuver request using the scale shown in Table 3. Subjects had a copy of the scale definitions available to them during the test sessions.
Table 3 - Rating scale definitions used for assessment of Maneuver Request Timing. A Too Early: Request made too early; potentially
disruptive if a maneuver not required A/B Between A and B
B Timing Okay: Not too early or too late; timing of request completely acceptable
B/C Between B and C C
Too Late: Request made too late; potentially disruptive to adjacent traffic if a large maneuver required
2.7.3 Workload Assessment. About every five minutes during each hour long test session, a workload rating was requested. This was done similar to the Air Traffic Workload Input Technique (ATWIT) method of workload assessment (Stein, 1985). A scale with numbers from 1 to 6 was presented at the top of the ATC display and the subject clicked on their selection (one of the numbers 1-6) when prompted (i.e., an aurally presented “Ding” – through headphones – occurred and the rating scale turned yellow). ATC test subjects were briefed on definitions of the 1 to 6 scale during the training and also had the scale definitions available during the test sessions. For this study, the scale definitions were: 1 – Minimal mental effort required; 2 – Low mental effort required; 3 – Moderate mental effort required; 4 – High mental effort required; 5 – Maximal mental effort required; and, 6 – Intense mental effort required. Appendix D shows the scale definitions table handout that was provided to the subjects.
9
2.7.4 System Performance Metrics. Data concerning the encounter aircraft separation distances were recorded throughout the period of the encounter and included aircraft-to-aircraft separation distances and time to the Closest Point of Approach (CPA). Data was also obtained on the DAA band information presented to the GCS pilots when flying the traffic encounters.
2.7.5 Post-run Questionnaires. After each one-hour test session, a questionnaire was administered to each subject to record ratings and comments on the preceding test session (Appendix E). Specific topics addressed included: 1 – Effects of communications delay; 2 – Realism of traffic density; 3 – Realism of workload; and, 4 – Realism of communications rate.
3.
Phase I Results
3.1 Horizontal Miss Distance Ratings
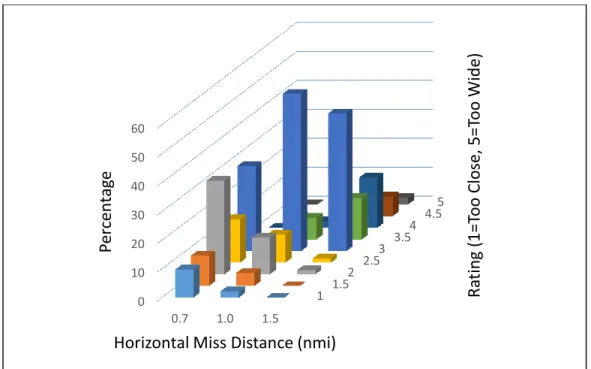
Traffic encounters between DAA equipped UAS and manned aircraft that were transmitting position and altitude information (transponding), but not in voice communications with ATC occurred 14 times in a test session hour. After each encounter, ratings using the scale shown in Table 2 were obtained. Figure 2 shows the controller ratings for Crossing Geometry Encounters for each of the Horizontal Miss Distances under test. The figure shows a greater frequency of “too close” or “somewhat close” responses for the 0.7 nmi HMD, and these “close” responses diminished somewhat for the 1.0 nmi HMD and were nearly non-existent for the 1.5 nmi HMD. For the 1.5 nmi HMD, there were an increased frequency of responses on the “wide” end of the rating scale. These results confirm for active controllers the results found in CAS-1 and CAS-2 with retired controllers.
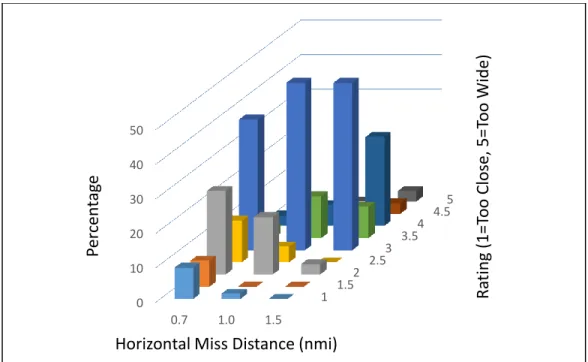
Figure 3 shows similar results for the overtake encounters, where the DAA equipped UAS was overtaking the manned aircraft. Figure 4 show the rating results for the head-on geometry cases. Both of these encounter geometries show similar distributions to the crossing encounter geometry case described above. The highest frequency of “3” response, defined as “Neither unsafely close nor disruptively large, did not perceive the encounter to be an issue,” occurred at the 1.0 and 1.5 nmi HMD values. These results were consistent with the prior CAS-1 and CAS-2 results, even with the change from 0.5 to 0.7 nmi for the smallest HMD.
10
Figure 2. Controller ratings for Crossing Geometry Encounters by Horizontal Miss Distance.
Figure 3. Controller ratings for Overtake Geometry Encounters by Horizontal Miss Distance.
1 1.5 2 2.5 3 3.5 4 4.5 5 0 10 20 30 40 50 60 0.7 1.0 1.5 Ra tin g (1=T oo C lose , 5= Too Wid e) P er cen tag e
Horizontal Miss Distance (nmi)
1 1.5 2 2.5 3 3.5 4 4.5 5 0 10 20 30 40 50 60 0.7 1.0 1.5 R at in g (1=T oo C lose, 5=T oo Wide) Per cen tag e
11
Figure 4. Controller ratings for Head-on Geometry Encounters by Horizontal Miss Distance.
3.2 Alerting Times Ratings
The alert time was a parameter set in the UAS DAA software and can be thought of as analogous to the beam of a flashlight at night which permits seeing things out to a certain distance. The alert time represented the DAA detection time before loss of well clear. The Alert Time values under test for Phase I of the study were 30, 45, and 75 seconds. The well clear boundary was defined for all cases as 30 seconds before the CPA, meaning that the total look ahead times were 30+30=60, 30+45=75, and 30+75=105 seconds. The objective of the DAA system is to keep the aircraft outside the 30 second well clear boundary by having the addition of the alert time.
The impact of Alert Time is indirect for the controller, as it would be evidenced by the timing of when the UAS pilot facing an encounter requiring maneuvering called to request a maneuver to avoid the traffic. Figure 5 shows the controller miss distance ratings across all HMD values for each of the Alert Times. Changes in alert times for the displays for the UAS pilots did not reflect any systematic difference in the HMD ratings by the controllers.
Figure 6 shows the results of the Maneuver Request Timing Rating made by the controllers using the scale shown in Table 3. It should be noted that there were many cases in which the controller called the UAS traffic before the traffic made a call to ATC, so no timing rating was available in such cases. The percentage of cases in which the controller called the traffic first, or for other reasons a rating was not made, were 49.3% for the 30 second alert time, 51.5% for the 45 second alert time, and 36.0% for the 75 second alert time. For the cases where a rating was made, it is interesting to note that the most frequent response “B - Timing Okay” was made for all alert time values. It is also interesting to note that there were no “A – Too Early” responses for the 30 second alert time. Also worth noting is that there were very few “C – Too Late” ratings for any of the Alert Time values.
1 1.5 2 2.5 3 3.5 4 4.5 5 0 10 20 30 40 50 0.7 1.0 1.5 Ra tin g (1=T oo C lose , 5= Too Wid e) P er cen tag e
12
Figure 5. Controller miss distance ratings for Crossing Encounters by UAS alert times of 30, 45, and 75 seconds.
Figure 6. Controller timing rating for Crossing Encounters by UAS alert times of 30, 45, and 75 seconds. 0 10 20 30 40 50 60 1 1.5 2 2.5 3 3.5 4 4.5 5 P er cen tag e
Horizontal Miss Distance Rating (1=Too Close, 3=Okay, 5=Too Wide)
30 45 75
Alert Time (seconds)
0 5 10 15 20 25 30 35 A AB B BC C P er cen tag e
Alert Timing Rating
A=Too Early, B=Timing Okay, C=Too Late
30 45 75
13
4.
Phase I Discussion
The research questions for Phase I will be repeated here so that results related to each question can be explored.
A. Given a projected well clear loss, which of the three values evaluated is the minimum acceptable alert time?
B. Given a projected well clear loss, which of the three values evaluated is the maximum acceptable alert time?
C. Which, if any, of the alert times are too excessive leading to nuisance alerts for the air traffic controllers?
As previously noted, the values of alert time in the DAA algorithm have only an indirect effect on the air traffic controller as the timing may be reflected in when the UAS pilot calls ATC to request a maneuver. Examination of controller ratings on the Maneuver Request Timing scale showed no consistent effects by the Alert Time. As noted in Section 3.2, there were many cases in which the controller notified the UAS pilot of the traffic before the pilot made a call to the controller. That provides a rationale for why, in Figure 6, there were no ratings at the “too late” end of the scale as the controller would have already called those aircraft. On the opposite end of Figure 6, the magnitude of ratings for “A = Too Early” roughly align with the magnitude of the alert times. However, the most frequent responses for all alert times was “B = Timing Okay.” Therefore, of the times tested, none appear to consistently fall into the “A = Too Early” category, which may lead to a nuisance alert.
D. Is there an interaction between Alerting Time and Horizontal Miss Distance?
From the ATC rating data, there appears to be no interaction between the Alerting Time and the HMD. The separation distances are directly observable by the controller, and as noted, the alerting time is only noticeable indirectly through a call from a UAS when a traffic maneuver is needed.
14
Phase II – Pilot Acceptability Study
5.
Phase II General Information
5.1 Approach and Objectives
The primary focus of the Phase II portion of the CASSAT experiment was to address minimum and maximum acceptable declaration times for projected well clear losses from the perspective of Instrument Flight Rules (IFR) rated pilots with and without experience controlling large size UAS, such as a Predator or Global Hawk. In this phase of CASSAT, pilots controlled simulated DAA-equipped UA and provided ratings on acceptability of distance-threshold (DTHR) values when near traffic encounters occurred, acceptability of alerting times, workload ratings during test conditions, and feedback regarding the Alerting Structure. The DTHR value is the distance that the DAIDALUS algorithms use to provide band guidance to the pilot, and was experimentally varied in the study. DTHR is used in this phase of the study to avoid confusion with the use of HMD as a fixed minimum value that constitutes a well clear loss, which may not be same as the DTHR value.
The following research questions, which drove the experiment design, were proposed:
A. Given a projected well clear loss, which of the three values evaluated is the minimum acceptable alert time?
B. Given a projected well clear loss, which of the three values evaluated is the minimum acceptable alert time?
C. Which, if any, of the alert times are too excessive leading to nuisance alerts for the UA pilots?
D. Which, if any, of the alert times are too short providing insufficient time to query/negotiate maneuvers with ATC and execute said maneuvers before triggering TCAS RAs?
E. Is there an interaction between Alerting Time and DTHR?
F. Which of two candidate alerting structures, with different use of auditory cues and icon colors, is preferred by the UA pilot?
G. In Vertical Encounters, does prediction of time to co-altitude (TCOA) affect acceptability of the Alert?
6.
Phase II Method
6.1 Subjects
Twelve pilots from across the country were recruited to perform traffic separation tasks for the scenarios developed. All twelve of the pilots were instrument rated; six of the twelve pilots had experience flying manned aircraft exclusively while the remaining six had additional experience flying unmanned aircraft, such as Predators and Global Hawks. Pilots participated for two days each, and each data collection session consisted of two subject pilots independently flying a simulated UAS in the DFW East-side airspace. On Day 1, subjects were trained on the DFW airspace, the DAA concept, the simulation environment, and were given an initial questionnaire (Appendix F). All subjects had experience communicating with ATC and were current in their pilot ratings and certifications.
15
6.2 Procedure
Similar to Phase I, the traffic scenarios were designed so that there were 14 UAS traffic encounters per hour, and there were a total of six test hour sets split between the two data collection days. Traffic scenarios were split between two ground control stations so that each pilot saw seven UAS traffic encounters during each test hour for a total of 42 encounters per pilot, and for all twelve subjects, this meant a set of data with 504 encounters. Both ground control stations displayed the DAA self-separation guidance information in real-time along with one of two alerting structures. Additionally, GCS-1 was set to a TCOA of 0 and GCS-2 was set to a TCOA value of 20 – these TCOA values remained constant throughout the experiment. The pilots switched seats on Day 2 to allow exposure to each TCOA value. This TCOA value parameter only affected traffic encounters approaching vertically (from above or below). The two alerting structures, which contained different levels of aural and visual cues to alert pilots of oncoming and/or nearby traffic, were presented to the pilots subjects (see section 6.3 Independent Variables). One alerting structure was shown to the pilots on Day 1, and on Day 2, the pilots saw the other alerting structure. The order of presentation of alerting structures was counterbalanced across the six pairs of test subjects. To maintain a real-world environment and a workload similar to that of actual DFW traffic, the background traffic was controlled by two pseudo-pilots at two additional pilot stations located in a separate simulation room. The DFW East-side controller, with whom the test subjects were communicating, was part of the research team.
The pilot subjects began control of a given UAS with the aircraft already in flight by a handoff process, and when the aircraft completed the traffic encounter, control was handed off to a research team pilot. Each subject controlled one aircraft at a time and as a result, there was sufficient time between controlling each aircraft so that post-encounter questions could be answered and rating scales completed. Two pilots using separate GCS stations were run at the same time. To increase workload and add some degree of distraction from just looking for traffic encounters to appear, members of the research team asked the pilot subjects questions that required each pilot to conduct a map search task while flying the UAS in the scenarios. Secondary task questions (Appendix G) were tailored to each test session so that the questions matched the map area in which the encounters were scripted to occur.
As in Phase I, the voice communications channel had a 400msec two-way delay between the simulated UAS and ATC. Additional manned and unmanned traffic were also on the ATC frequency and could also be visible on the map display if within range, which was selectable by the pilots. This level of traffic meant that at times there could be delay in communicating with ATC due to voice traffic congestion. Similar to Phase I, traffic encounters were between the UAS and VFR traffic that was transmitting position and altitude information (transponding), but not in voice communications with ATC, thus all maneuvering, if required, was performed by the UAS.
6.3 Independent Variables
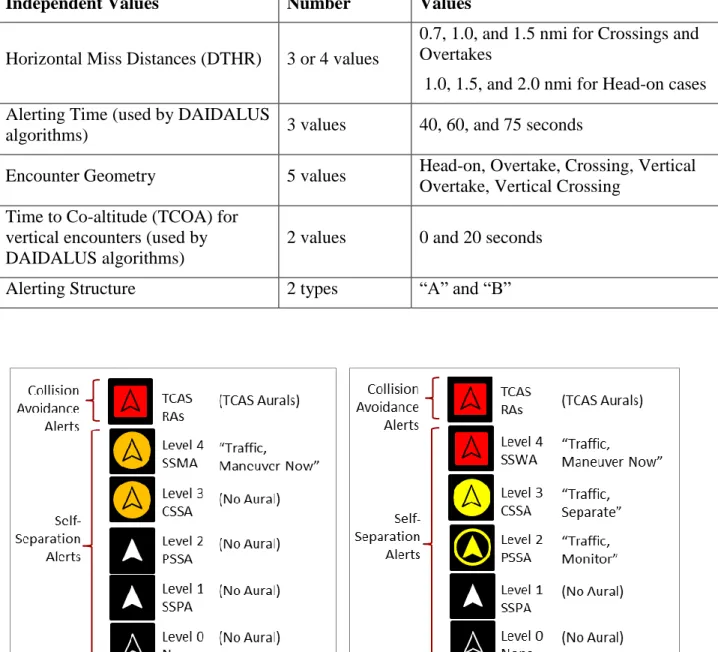
The independent variables evaluated in Phase II are shown in Table 4. There were some differences from those used in Phase I (shown back in Table 1). The first difference was in the case of head-on geometry encounters in which a subset of runs were dhead-one at a 2.0 nmi DTHR (not tested in phase I) in addition to 0.7, 1.0, and 1.5 nmi. Secondly, the alert times used in the DAA algorithms were changed to be 40, 60, and 75 seconds, in response to new information under discussion at standards organizations with regard to minimal alert times. The third difference was in the case of
16
the alerting structure that was displayed on the GCS station to the pilot subjects. Subjects were shown two separate alerting structures - Alerting Structure “A” (Figure 7) and Alerting Structure “B” (Figure 8). On Day 1, both subjects would see one alerting structure and the other alerting structure on Day 2; the order in which the alerting structures were presented changed for each pair of pilot subjects. Further information on the alerting structures may be found in Consiglio et al. (2015).
Table 4 - Independent Variables for Phase II
Independent Values Number Values
Horizontal Miss Distances (DTHR) 3 or 4 values
0.7, 1.0, and 1.5 nmi for Crossings and Overtakes
1.0, 1.5, and 2.0 nmi for Head-on cases Alerting Time (used by DAIDALUS
algorithms) 3 values 40, 60, and 75 seconds
Encounter Geometry 5 values Head-on, Overtake, Crossing, Vertical Overtake, Vertical Crossing
Time to Co-altitude (TCOA) for vertical encounters (used by DAIDALUS algorithms)
2 values 0 and 20 seconds Alerting Structure 2 types “A” and “B”
17
6.4 Scenarios
Scenarios in Phase II were similar to those used in Phase I (refer to Section 2.4), with the exception of data collection being focused on the GCS pilots as opposed to the ATC controller. A member of the research team sat near each test subject to ask the secondary task (map search) questions and to ask encounter rating questions.
6.5 Communications, Navigation, and Surveillance Assumptions
Communications, navigation, and surveillance assumptions remained constant between Phase I and Phase II of the experiment. Please refer to Section 2.5 of this paper for more information.
6.6 Software, Hardware, and Facilities
Software, Hardware, and Facilities remained the same between both phases of the experiment. Please refer to Section 2.6 of this paper for more information.
6.7 Dependent Variables
6.7.1 Horizontal Miss Distance (DTHR). Horizontal miss distances, or DTHR, were measured in the same manner as in Phase I. After each traffic encounter, a researcher, who was seated next to the pilot subjects, would ask “How was the spacing of that last encounter?” or “How acceptable was the miss distance in the previous encounter?” Subjects had a copy of the information shown in Table 2 available to them during the test sessions. They were briefed that fractional responses, such as 1.5 or 3.5, were acceptable. If time permitted, an explanation for the rating was asked and noted. Additionally, horizontal miss distances were also rated via an end-of-encounter questionnaire that was filled out by each subject after each encounter on a 7-point scale (0 = Much Too Close, 4 = About Right, 7 = Much Too Wide). Responses were scored on a 120 point range, since marks could occur between the 7 “tic” marks.
6.7.2 Alert Times Ratings. Ratings for alert times were requested on the timing of the maneuver request using the scale shown in Table 3. Subjects had a copy of the scale definitions available to them during the test sessions. The same researcher who asked questions regarding the horizontal miss distance would also ask the pilot subject “How was the alert time of that last encounter?” or “How acceptable was that alert time?”
6.7.3 Workload Assessment. A workload assessment was requested after each encounter and was filled out by each subject via the end-of-encounter questionnaire on a 7-point scale (0 = Low, 7 = High). Responses were scored on a 120 point range, since marks could occur between the 7 “tic” marks. Forty-two assessments of workload were collected from each subject.
6.7.4 System Performance Metrics. Data concerning the encounter aircraft separation distances were recorded throughout the period of the encounter and included aircraft-to-aircraft separation distances and time to the CPA. Data was also obtained on the DAA band information presented to the GCS pilots when flying the traffic encounters.
18
6.7.5 Secondary Task. In an attempt to increase workload and add some degree of distraction from just looking for traffic encounters to appear, members of the research team added a secondary task to the design of the experiment. Research team members asked questions that required the pilots to conduct a map search task while flying the UAS in the scenarios.
6.7.6 Post-encounter Questionnaires. After each encounter in each one-hour test session, a questionnaire was administered to record ratings and comments on the preceding encounter (Appendix H). Specific topics addressed included: 1 – Timing of the alert; 2 – Horizontal miss distance; 3 –Navigation scale (scaled used on display to view surrounding area); 4 – Alert level information (volume of alert); 5 – False alerts; 6 – Missed alerts; 7 – Workload; and, 8 – Time Pressure.
6.7.7 Post-run Questionnaires. After each one-hour test session, a questionnaire was administered to record ratings and comments on the preceding test session (Appendix I). Specific topics addressed included: 1 – Effects of communications delay; 2 – Realism of traffic density; 3 – Realism of workload; 4 – Realism of communications rate; 5 – Usability of display; and 6 – Ease of use of alerting structure.
7.
Phase II Results
7.1 Horizontal Miss Distance Ratings
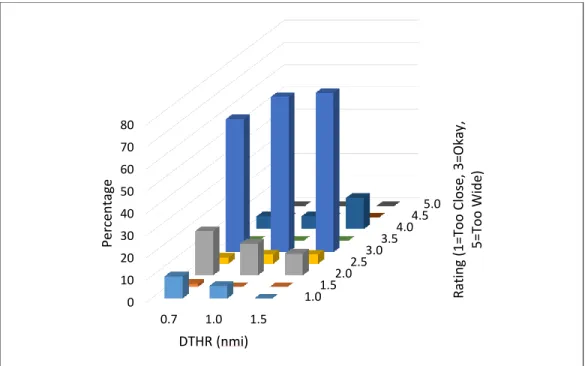
At the end of each traffic encounter, the GCS pilots were asked to rate the DTHR on the scale presented in Table 2. Figure 9 shows the distribution of their responses for the Crossing geometry encounters. This figure shows that the majority of the responses were a “3” on the scale indicating miss distances that were not too close or too wide. For the 0.7 nmi DTHR, over 30% of the ratings were on the “too close” or “somewhat close” end of the scale. For the 1.0 nmi DTHR encounters, ratings on this end of the scale dropped to about 20%, and for the 1.5 nmi DTHR dropped to about 15%.
Figure 10 shows the DTHR ratings for the overtake conditions. Here, about a third of the ratings for the 0.7 nmi DTHR were “somewhat close.” This dropped to about 20% for the 1.0 nmi distance, and to zero for the 1.5 nmi distance, where there were almost 20% of ratings on the “somewhat wide” end of the scale.
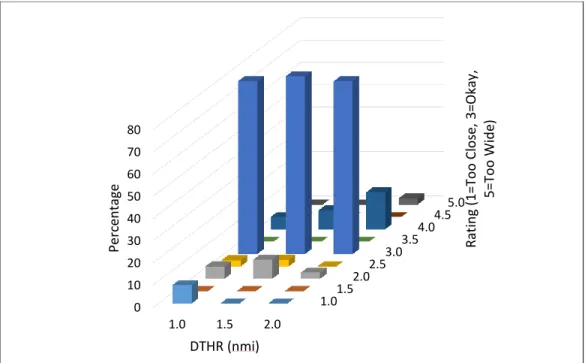
Figure 11 shows similar ratings for the head-on encounters. For head-on encounters, an additional DTHR of 2.0 nmi was also tested. Over 70% of the ratings for DTHR of 0.7 and 1.0 nmi, and over 80% for DTHR of 1.5 and 2.0 nmi indicated that the encounter separation distance was neither “too close” or “too wide” in the head-on geometry cases.
19
Figure 9. UAS Pilot ratings for Crossing Geometry Encounters with DTHR of 0.7, 1.0, and 1.5 nmi (216 encounters).
Figure 10. UAS Pilot ratings for Overtake Geometry Encounters with DTHR of 0.7, 1.0, and 1.5 nmi (108 encounters). 1.01.5 2.02.5 3.03.5 4.04.5 5.0 0 10 20 30 40 50 60 70 80 0.7 1.0 1.5 Rat in g (1= To o Cl o se , 3= Ok ay , 5= To o Wid e) Perc en ta ge DTHR (nmi) 1.01.5 2.02.5 3.03.5 4.04.5 5.0 0 10 20 30 40 50 60 70 80 90 0.7 1.0 1.5 Rat in g (1= To o Cl o se , 3= Ok ay , 5= To o Wid e) Perc en ta ge DTHR (nmi)
20
Figure 11. UAS Pilot ratings for Head-on Geometry Encounters with DTHR of 1.0, 1.5, and 2.0 nmi (108 encounters).
7.2 Alert Times Ratings
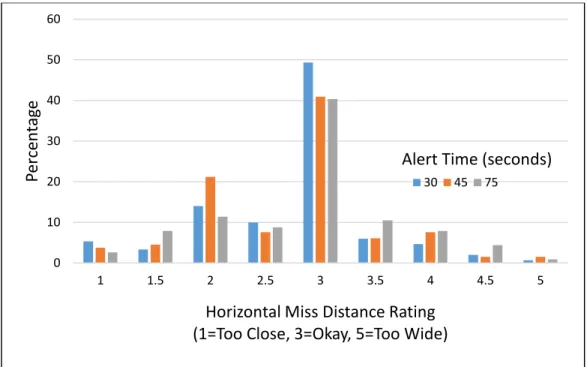
Three alert times values were tested during the study. These values are parameters in the DAIDALUS algorithm in software running on the GCS and were counterbalanced across the six one-hour test sessions, such that all three alert time values were presented on Day 1 and again on Day 2 of the study. Figure 12 shows the alert time ratings for the crossing geometry encounters. The majority of responses were in the “Timing Okay” category, with no systematic changes attributable to the alert time manipulation.
Figure 13 shows the alert time ratings for the overtake geometry encounters where the majority of the rating responses were in the “Timing Okay” category, but with about 20% of responses in the “Between B and C” (between Okay and Too Late) category. This reflects the overtake geometry in which the smaller speed differential between the two aircraft result in getting closer in distance before the time-based algorithm indicates that it is time for a maneuver. As in the crossing case, no systematic differences are noted across the three alert times tested.
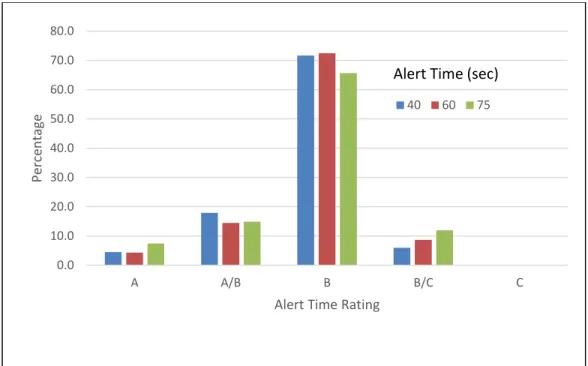
Figure 14 shows the alert time ratings for the head-on case. As in the other alert time geometries, the majority (>75%) of ratings were in the “Timing Okay” category, regardless of the alert time value. 1.01.5 2.02.5 3.03.5 4.04.5 5.0 0 10 20 30 40 50 60 70 80 1.0 1.5 2.0 Rat in g (1= To o Cl o se , 3= Ok ay , 5= To o Wid e) Perc en ta ge DTHR (nmi)
21
Figure 12. UAS Pilot ratings for Crossing Geometry Encounters with Alert Times of 40, 60, and 75 seconds (A = Too Early, B = Timing Okay, C = Too Late).
Figure 13. UAS Pilot ratings for Overtake Geometry Encounters with Alert Times of 40, 60, and 75 seconds (A = Too Early, B = Timing Okay, C = Too Late).
0.0 10.0 20.0 30.0 40.0 50.0 60.0 70.0 80.0 A A/B B B/C C Perc en ta ge
Alert Time Rating
40 60 75
Alert Time (sec)
0.0 10.0 20.0 30.0 40.0 50.0 60.0 70.0 80.0 90.0 A A/B B B/C C Perc en ta ge
Alert Time Rating
40 60 75
22
Figure 14. UAS Pilot ratings for Head-on Geometry Encounters for Alert Times of 40, 60, and 75 seconds (A = Too Early, B = Timing Okay, C = Too Late).
7.3 Distance from Well Clear Boundary
Figure 15 shows for the crossing geometry cases the mean distance outside the DTHR at the CPA that the UAS pilots flew the simulated aircraft in the traffic encounters. The set of data comprising this figure included 216 encounters, of which only four had losses of well clear (negative distances, CPA< DTHR). The alert time did not appear to have any systematic effect on the CPA distances. Figure 16 shows similar information for the overtake encounters. In this geometry, there were 108 encounters and six well clear losses. While no systematic differences occurred as a result of the alert time, the overall distances outside the DTHR for all DTHR values are smaller for the overtake geometry case than for either the crossing or head-on geometries. This may reflect the slower overtake speed differential leading to more time to fly closer to the DTHR boundary.
Figure 17 shows similar information for the head-on geometry case, where there were a total of 108 encounters and four losses of well clear. As in the crossing and overtake geometries, there were no systematic effects due to the alert time variable.
0 10 20 30 40 50 60 70 80 90 100 A A/B B B/C C Perc en ta ge
Alert Time Rating
40 60 75
23
Figure 15. Mean distance from DTHR at CPA for Crossing Geometry Encounters for 40, 60, and 75 second Alert Times (216 encounters, 4 losses of well clear). Error bars denote standard deviations.
Figure 16. Mean distance from DTHR at CPA for Overtake Geometry Encounters for 40, 60, and 75 second Alert Times (108 encounters, 6 losses of well clear). Error bars denote standard deviations. 0.00 0.10 0.20 0.30 0.40 0.50 0.60 0.70 0.7 1.0 1.5 Dis ta n ce f ro m DT H R at CPA (n m i) DTHR (nmi) 40 60 75
Alert Time (sec)
0.00 0.10 0.20 0.30 0.40 0.50 0.60 0.70 0.7 1.0 1.5 Dis ta n ce f ro m DT H R at CPA (n m i) DTHR (nmi) 40 60 75
24
Figure 17. Mean distance from DTHR at CPA for Head-on Geometry Encounters for 40, 60, and 75 second Alert Times (108 encounters, 4 losses of well clear). Error bars denote standard
deviations.
Table 5 shows those cases where CPA was less than DTHR so that the simulated aircraft had a loss of well clear on the basis of separation distance. These cases make up only 3.37% of the encounters and occurred for all DTHR values, and all encounter geometries.
0.00 0.10 0.20 0.30 0.40 0.50 0.60 0.70 1.0 1.5 2.0 Dis ta n ce f ro m DT H R at CPA (n m i) DTHR (nmi) 40 60 75
25
Table 5 - Cases where CPA was less than DTHR (Occurred in 17 of 504 encounters {3.37%}) Geometry HMD (nmi) CPA (nmi) Difference (nmi) Duration for
CPA<DTHR (sec) Comment
Head-On 1.5 1.47 -0.03 5.5 Turned once, did not turn further
Head-On 1.5 1.39 -0.11 12.5 Started maneuver too late
Head-On 1.5 1.39 -0.11 10 Turned once, did not turn further Head-On 2.0 1.4 -0.60 25.1 Overcorrection on return-to-course Crossing 0.7 0.1 -0.6 15.2 Late acquisition of aircraft, no time to maneuver Crossing 0.7 0.64 -0.06 6 Likely autopilot-induced “drift” towards intruder Crossing 1.5 1.49 -0.01 5 Overcorrection on return-to-course Crossing 1.5 1.09 -0.41 21
Pilot turned right, then left; insufficient time to recover well clear Crossing 1.5 1.47 -0.03 8 Overcorrection on return-to-course Overtake 1.0 0.94 -0.06 15.9 Overcorrection on return-to-course Overtake 1.5 1.48 -0.02 18.7 Overcorrection on return-to-course Overtake 1.5 1.49 -0.01 3.5 Overcorrection on return-to-course Overtake 1.5 1.29 -0.21 42.1 Overcorrection on return-to-course Overtake 1.5 1.38 -0.12 38.7 Overcorrection on return-to-course Overtake 1.5 1.4 -0.10 10.5 Overcorrection on return-to-course Vertical-Crossing 0.7 0.35 -0.35 9.5
Started maneuver too late
Vertical-Overtake 0.7 0.01 -0.69 17.1
Pilot did not deviate laterally before Loss of Well Clear
26
7.4 Vertical Encounters
Data were collected from a total of 72 vertical encounters in the study, meaning that each GCS pilot saw one in each hour, or six over the two days of testing. All vertical encounters had an DTHR of 0.7 nmi. Figure 18 shows the distance ratings by the GCS pilots and illustrates that a sizable proportion of these were considered “Too close” or “Somewhat close.” The alert time variable appeared to have no systematic effect on the distance ratings.
As would be expected from the distance ratings noted above, the GCS pilot alert time ratings, shown in Figure 19, show a shift in responses towards the “Too Late” end of the scale compared to other encounter geometries. In Figure 19, the number of responses to the right of “Timing Ok,” or in the “Too Late” direction were 62.5% for 40 seconds alert time, 50.0% for the 60 seconds alert time, and 33.3% for the 75 seconds alert time. This makes intuitive sense as additional alert time should diminish “Too Late” responses.
Figure 20 shows the distance from DTHR at the CPA for each of the alert times. There were only two losses of well clear among the 72 vertical encounters. This figure also shows a breakdown in the data set for a parameter in the DAA algorithm referred to as Time-to-Co-altitude (TCOA), a parameter considered useful in adding alert time to vertical encounters. In Figure 18, no difference appears attributable to the TCOA parameter, at least for the CPA data. Also worth noting in this figure is that 40 and 60 seconds alert time encounters were vertical overtakes, while 75 seconds alert time encounters were of the vertical crossing geometry. In agreement with non-vertical encounters presented earlier, the crossing geometry encounters have larger mean CPA - DTHR differences.
Figure 18. UAS Pilot Distance ratings for Vertical Geometry Encounters for each Alert Time. All DTHR values were 0.7 for Vertical Geometry Encounters.
0 10 20 30 40 50 60 1.0 1.5 2.0 2.5 3.0 3.5 4.0 4.5 5.0 Perc en ta ge
Distance Rating (1=Too Close, 3=Okay, 5=Too Wide) 40 60 75
27
Figure 19. UAS Pilot Alert Time ratings for Vertical Geometry Encounters (A = Too Early, B = Timing Okay, C = Too Late).
Figure 20. Mean distance from DTHR at CPA for Vertical Geometry Encounters for 40, 60, and 75 second Alert Times and Time to Co-Altitude values of 0 and 20 seconds (72 encounters, 2 losses of well clear). Encounters at 40 and 60 seconds are Vertical Overtake Encounters, 75 second encounters are Vertical Crossing Encounters. Error bars denote standard deviations.
0 10 20 30 40 50 60 70 A A/B B B/C C Perc en ta ge
Alert Time Rating
40 60 75
Alert Time (sec)
0.00 0.10 0.20 0.30 0.40 0.50 0.60 0.70 40 60 75 Dis ta n ce f ro m DT H R at CPA (n m i)
Alert Time (Seconds)
0 20
28
7.5 Alerting Structures
At the end of every one-hour test session, each GCS pilot was asked to answer a series of fifteen questions on an end-of-hour questionnaire. Seven of the fifteen questions focused on the alerting structure that was presented to the pilot subjects on the GCS display and consisted of the following questions:
1. Rate the ease of the display.
2. Rate the ease of the alerting structure. 3. Was the display user-friendly?
4. Did the display provide the necessary information to predict a potential loss of separation? 5. Rate your trust of the bands on the display?
6. Were the number of alert icons during the past hour acceptable? 7. Were the number of aural alerts during the past hour acceptable?
Based on responses provided on the end-of-hour questionnaires and during the de-brief session on Day 2 of testing, Alerting Structure “A” was the preferred schema. Pilot subjects commented that Alerting Structure “A” was user-friendly and intuitive. Additionally, although some subjects also found Alerting Structure “B” to be user-friendly, the majority of them did not find having two “red” icons to be appealing. Multiple pilot subjects commented that simpler is better in terms of alerting structures.
8.
Phase II Discussion
The research questions involved:
A. Given a projected well clear loss, which of the three values evaluated is the minimum acceptable alert time?
B. Given a projected well clear loss, which of the three values evaluated is the maximum acceptable alert time?
C. Which, if any, of the alert times are too excessive leading to nuisance alerts for the UA pilots? D. Which, if any, of the alert times are too short providing insufficient time to query/negotiate
maneuvers with ATC and execute said maneuvers before triggering TCAS RAs? E. Is there an interaction between Alerting Time and DTHR?
F. Which of two alerting structures, with different use of auditory cues and icon colors, is preferred by the UA pilots?
G. In Vertical Encounters, does prediction of time to co-altitude (TCOA) affect acceptability of the Alert?
For Phase II, three Alert Times were tested in the DAIDALUS algorithm, and these included 40, 60, and 75 seconds. The majority of ratings by the UAS pilots were in the “B = Timing Okay” category regardless of the Alert Time. As illustrated by Figures 12 to 14, very few rating responses occurred at either the “A = Too Early” or “C = Too Late” ends of the scale, regardless of the encounter geometry. These results suggest little change in perception of an acceptable alert time across the range of Alert Times evaluated. Based on these results, none of the values tested can be considered excessive, leading to a nuisance alert for the UAS pilot. Likewise, very few “Too Late” responses indicate that even the shortest Alert Time tested still provided enough time to negotiate
29
a maneuver. No consistent interaction between Alerting Time and DTHR was shown in the rating or CPA data sets for the lateral maneuver encounters.
For the Vertical encounters, a different picture emerges from the Alert Time ratings. Here, a higher percentage of rating responses were found on the “C = Too Late” end of the scale than for lateral maneuvers. Despite this, the greatest frequency still occurred at the “B = Timing Okay” category, as in the lateral maneuver conditions. The CPA-DTHR difference was not affected by the TCOA value (see Figure 20).
Of the total of 504 encounters for Phase II, only 17 (3.37%) had distance-based (CPA-DTHR) losses of well clear. These well clear losses occurred over all DTHR values and for all of the geometries under test. The most frequent cause was starting the traffic separation maneuver too late. Guidance for these maneuvers was guided by the navigation display bands.
9.
Conclusion
This study evaluated a candidate DAA system with adjustable parameters from the perspective of both ATC and the UAS pilot. In Phase I, building on Controller Acceptability Studies (CAS) 1 and 2, ATC acceptability ratings for DTHR of 0.7, 1.0 and 1.5 nmi showed the highest acceptability ratings for the 1.0 and 1.5 nmi DTHR values. DTHR ratings by active controllers were consistent with ratings by retired controllers in the earlier CAS-1 and CAS-2 studies. An Alert Time variable in the DAA software driving the UAS GCS displays did not show much effect on the ATC side in the ratings of the UAS maneuver request time ratings by ATC.
In Phase II, UAS pilots requested maneuvers, or in some cases ATC contacted them first, and followed the DAA guidance at the GCS, and rated each of the DTHR values more frequently as “Neither too close nor too large” indicating less sensitivity to the distance than found on the part of the ATC controllers. For the crossing traffic condition and the 0.7 nmi DTHR, over 30% of the ratings were on the “too close” or “somewhat close” end of the scale. For the 1.0 nmi DTHR encounters, ratings on this end of the scale dropped to about 20%, and for the 1.5 nmi DTHR dropped to about 15%. Alert Timing rating results showed no consistent interaction with DTHR or with CPA for the lateral maneuvers. Specifics of the vertical maneuvers were discussed in an earlier section.
The present study assumed perfect surveillance systems without positional error or uncertainty. Future studies, designed to inform the designers of DAA systems and critical parameters within them, need to incorporate sensor uncertainty and sensor effective range as variables of interest. Also of interest are simulation of failure modes, and especially from the ATC perspective, the maneuvers that a UAS would perform in a high traffic density environment if the communications or control link is lost. The aim of this work is to provide useful information for guiding future rules and regulations applicable to flying UAS in the NAS.
30
Acknowledgements
The support of the many people involved in the conduct of this study is gratefully appreciated. Thanks are extended to Anthony Narkawicz, George Hagen, and Jason Upchurch of the Safety Critical Avionics Systems Branch at the NASA Langley Research Center for contributions to the development of the DAIDALUS self-separation algorithms. Thanks are also extended to contributors participating through the NASA Langley Information Technology Enhanced Services (LITES) contract, including: Pierre Beaudoin, Anna Dehaven, Keith Hoffler, Steve Hylinski, Joel Ilboudo, Kristen Mark, Robb Myer, Gaurev Sharma, Jim Sturdy, and Dimitrios Tsakpinis as well as other support and management personnel. Thanks are also extended to members of the Air Traffic Operations Laboratory (ATOL) for their support, including: Chad Chapman, Ronald Maddox, and Edward Scearce. Thanks are also extended to the tireless efforts of the persons staffing the background traffic pilot stations, the UAS pilot stations, and the ATC adjacent sector/tower consoles.