IZA DP No. 1135
The Effects of the Minimum Wage
on Wages, Employment and Prices
Sara LemosDISCUSSION P
APER SERIES
Forschungsinstitut zur Zukunft der Arbeit Institute for the Study of Labor
The Effects of the Minimum Wage
on Wages, Employment and Prices
Sara Lemos
University of Leicesterand IZA Bonn
Discussion Paper No. 1135
May 2004
IZA P.O. Box 7240 53072 Bonn Germany Phone: +49-228-3894-0 Fax: +49-228-3894-180 Email: iza@iza.orgAny opinions expressed here are those of the author(s) and not those of the institute. Research
disseminated by IZA may include views on policy, but the institute itself takes no institutional policy positions.
The Institute for the Study of Labor (IZA) in Bonn is a local and virtual international research center and a place of communication between science, politics and business. IZA is an independent nonprofit company supported by Deutsche Post World Net. The center is associated with the University of Bonn and offers a stimulating research environment through its research networks, research support, and visitors and doctoral programs. IZA engages in (i) original and internationally competitive research in all fields of labor economics, (ii) development of policy concepts, and (iii) dissemination of research results and concepts to the interested public.
IZA Discussion Papers often represent preliminary work and are circulated to encourage discussion. Citation of such a paper should account for its provisional character. A revised version may be
IZA Discussion Paper No. 1135 May 2004
ABSTRACT
The Effects of the Minimum Wage
on Wages, Employment and Prices
This paper puts together evidence for the wages, employment and price effects of the minimum wage. This overall picture will help to understand the small employment effects prevalent in the literature in the light of price effects. The data used is an under-explored monthly Brazilian household survey from 1982 to 2000, similar to the US CPS. As the international literature on the minimum wage is scanty on non-US empirical evidence, in particular on developing countries, this paper will also help to extend the current understanding on the effects of the minimum wage in developing countries. This is crucial if the minimum wage is to be used as a policy to help poor people in poor countries.
JEL Classification: J38
Keywords: minimum wage, wage effect, employment effect, price effect, cost shock, pass-through, Brazil Sara Lemos Economics Department University of Leicester University Road Leicester LE1 7RH United Kingdom Tel.: +44 116 252 2480 Fax: +44 116 252 2908 Email: sl129@leicester.ac.uk
1. Introduction
The minimum wage helps the poor if it increases wages and does not destroy jobs or cause inflation. Thus, the main contribution of this paper is to put together evidence for the wages, employment and price effects of the minimum wage. This overall picture will help to understand the small employment effects prevalent in the literature (Brown, 1999) in the light of price effects. The price effect evidence provided is, in turn, another main contribution to a very under researched area. The data used is an under-explored monthly Brazilian household survey from 1982 to 2000, similar to the US CPS. As the international literature on the minimum wage is scanty on non-US empirical evidence, in particular on developing countries, another main contribution of this paper is to extend the current understanding on the effects of the minimum wage in developing countries. This is crucial if the minimum wage is to be used as a policy to help poor people in poor countries.
Wage Effects – It is well established in the international literature that minimum wage increases compress the wages distribution (Brown, 1999). As a result, the policy debate hinges on whether employers facing the associated higher labour costs respond by reducing profits, reducing employment, or raising prices.
Profit Effects – The empirical evidence to support the assumption that firms reduce profits following a minimum wage increase is very limited (Card and Krueger, 1995), but economic theory suggests that this does not occur. Low wage firms operate in competitive markets and are not able to absorb the extra costs.
Employment Effects – There is no consensus in the extensive empirical literature on employment effects, which implicitly assumes that output prices are given on a competitive market, and that firms lower employment as a result of a minimum wage increase (Brown, 1999). Results consistent with the prediction of a negative employment effect conflict with results that challenge such a prediction. Nonetheless, small employment effects, clustered around zero, are becoming prevalent in the literature (Freeman, 1994 and 1996; Brown, 1999).
Price Effects – Although much attention has been devoted to reconciling the theoretical prediction of employment decrease with the available empirical evidence (Card and Krueger, 1995; Brown, 1999), little attention has been paid to the theoretical prediction that an industry wide cost shock will be passed through to prices. The assumption of constant prices is reasonable for an industry where firms affected compete with firms not affected by the increase. However, an increase
in the minimum wage represents an industry wide increase in costs. It is then crucial to assume that
employment is given, and that firms raise their prices in response to a minimum wage increase. With employment and profits not significantly affected, higher prices is an obvious response to a minimum wage increase. Nonetheless, there is very little evidence on price effects in the literature, and none whatsoever for developing countries (Brown, 1999; Lemos, 2004a).
The limited empirical evidence for Brazil is in line with the international literature and it indicates that an increase in the minimum wage compresses the wage distribution and has a small adverse employment effect (Carneiro, 2002; Corseuil and Servo, 2002).
This paper follows recent strands in the international literature and discusses a number of conceptual and identification questions. It estimates the effect of the minimum wage at various points throughout the wage distribution; it uses an employment decomposition to separately estimate the effect of the minimum wage on the number of hours worked and on the number of jobs; it then estimates price effects, filling a gap in the literature. Robust results indicate that the minimum wage strongly compresses the wages distribution, has small adverse effects on employment, and raises overall prices in Brazil.
2. Analysis
The data used is PME (Monthly Employment Survey), a rotating panel data for six Brazilian metropolitan regions between 1982 and 2000, similar to the US CPS (Current Population Survey). The PME, together with the price data, IPC (Consumers Price Index), and the nominal minimum wage data, is available from IBGE (Instituto Brasileiro de Geografia e Estatistica).
Over the sample period, the nominal minimum wage was national, its coverage was full, and its adjustments were according to the indexation rules of successive stabilization plans, which ultimately depended on the inflation level. The correlation of the difference of the log nominal hourly minimum wage and the difference of the log 10th (90th) percentile of the nominal hourly wage distribution is 0.11 (0.05), suggesting that the minimum wage is more strongly correlated with wages at the bottom of the distribution. The correlation of the difference of log nominal hourly minimum wage and the difference of log employment rate is 0.05, offering little support for a negative employment effect of the minimum wage. The correlation of the difference of log nominal hourly
minimum wage and the difference of log price is 0.55, suggesting that the minimum wage affects prices positively.
As in Lemos (2004b), a simple empirical wage equation, grounded on the standard theory, is delivered by a labour market equilibrium reduced form equation:
w rt w t w r rt w rt w rt w t w w rt MW lation urate X f f u W = + ∆ + + ∆ + + + +
∆log α β log γ inf −1 δ −1 λ (1) where Wrt is nominal hourly average wages in region r and month t, r=1,...,6, and t=1,...,214;
t
MW is nominal hourly minimum wage; inflationrt−1 is past inflation; uratert−1 is past
unemployment rate; w r
f and w t
f are region and time fixed effects modelled by region and time dummies; w
irt
u is the error term; and Xrt are labour supply shifters, ie. the proportion of workers in the population who are: young, younger than 10 years old, women, illiterates, retired, students, in urban areas, in the public sector, in the building construction industry, in the metallurgic industry, basic education degree holders, high school degree holders, and with a second job. This equation can be estimated not only using average wages, but also the 10th, 20th, 30th, 40th, 50th and 90th percentiles, their ratios, and the standard deviation of the wage distribution. This makes it possible to estimate the effect of the minimum wage throughout the wage distribution (Dickens et al., 1999).
Because the nominal minimum wage does not vary across regions, the fraction of workers at the minimum wage in the wage distribution (plus or minus 0.02% to account for rounding approximations) is used as the minimum wage variable in Equations (1), (2) and (3) (Dolado et al, 1996), as it is now standard in the literature (Brown, 1999). Even though “fraction at” has variation across regions and over time, modelling time effects with a full set of interactions of (12) month and (16) year dummies would eliminate all the variation that identifies the minimum wage effect. That is because the variation in the minimum wage (and associated variation in “fraction at”) is not independent of the variation in the time dummies, since the minimum wage is systematically increased on a particular month (mostly May). To preserve the relevant variation, only the interaction of (11) month and (16) year dummies, excluding the May interaction but including a month May dummy, are included to model macro shocks in each time period and seasonally in May.
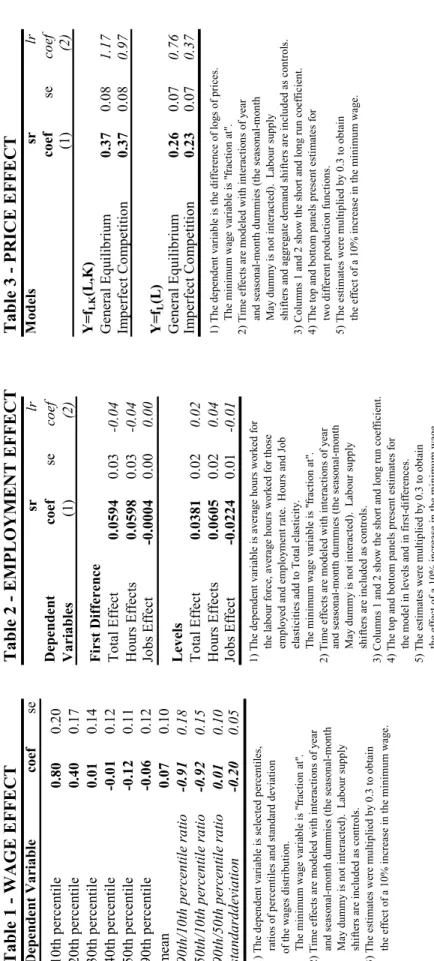
Table 1 shows positive estimates, more robust and larger at lower percentiles, suggesting that the minimum wage compresses the wage distribution. A 10% increase in the minimum wage increases the wage of those in the 10th (20th) percentile by 0.80% (0.40%), and decreases the 90th
-10th percentile gap by 0.91%, decomposed into a decrease in the 50th-10th gap of 0.92% and an increase in the 90th-50th gap of 0.01%.1 Spillovers for Brazil extend relatively higher in the wage
distribution than for other countries for which empirical evidence is available (Brown, 1999). The counterpart empirical employment equation, as in Lemos (2004b), is:
∑
= − − + + ∆ + + + + ∆ + = ∆ 24 1 1 1 log inf log log l e rt e t e r rt e l rt e rt e t e e rt MW lation X N f f u Nα
β
γ
λ
ρ
(2)where Nrt is taken in turn to mean average hours in the population (T ), average hours for those working (H ) and the employment rate (E). Equation (2) is separately estimated using each of the three employment variables (T , H and E) in turn as dependent variables. Thus, the estimate of the minimum wage in the T equation equals the sum of the estimates of the minimum wage in the
Hand E equations, i.e. Ee e H e
T β β
β = + .2 This makes it possible to decompose the total effect of a
minimum wage increase on employment into hours effect and jobs effect (Lemos, 2004b).
Table 2 shows positive and significant total and hours estimates as well as non-significant jobs estimates; the total effect appears to be dominated by the hours rather than the jobs effects. This suggests that the minimum wage does not hurt as much where it hurts the most: causing disemployment. A 10% increase in the minimum wage increases total employment by 0.0594%, decomposed into a 0.0598% increase in the number of hours worked and a 0.0004% decrease in the number of jobs. In the long run, total employment decreases by 0.04%. Robustness checks, where Equation (2) is re-estimated in levels, show similar estimates, perhaps suggesting a slightly more (less) adverse effect in the short (long) run. The employment effect for Brazil is small when
1 The estimates of “fraction at” were multiplied by 0.3 to obtain the effect of a 10% increase in the minimum wage.
The 0.3 factor was obtained by regressing the difference of “fraction at” on the difference of the log of nominal hourly minimum wage and controls associated to each empirical equation. Because the nominal minimum wage does not vary
across regions, it was normalized by the average wages (and also by the median wage, 25th and 10th percentile wage).
The 0.3 estimate was remarkably robust across specifications. The intuition is given by a deterministic model where x
b a
y= 1+ 1 , y=a2+b2z, z=a3+b3x and b1=b2b3, ∀b1,b2,b3≠0 (Lemos, 2004b).
2 Because of dynamics, the set of regressors is not the same in all three equations and the OLS additivity property does
not hold exact. To preserve the decomposition, lagged T , which embodies the variation of H and E, was used in all
compared to the -1% effect in the international literature (Brown, 1999) and given the evidence of sizeable wage effects.
As in Lemos (2004c), a simple empirical price equation, grounded on standard theory, is delivered either by a general equilibrium reduced form equation solved for prices, or by inverting the imperfect competition profit maximizing equation. Consider the following model:
p rt p t p r rt p rt p rt p rt p rt p t t p t t p p rt MW logMW W r C K Zs f f u P = + ∆ + ∆ + ∆ + ∆ + ∆ + ∆ + + + + ∆ − =
∑
β γ δ ς κ λ β α 6 1 1 log log (3)where Pit is log prices; rit is nominal interest rate; Cit is average costs; Kit is capital; and Zit is labour supply shifters, as above, and aggregate demand shifters, which include consumption, Government expenditure, taxes, capital investment, imports and exports. The empirical counterpart of the general equilibrium equation is obtained if αp, βp, p
t
β , δ p, κp, and λp are nonzero, and
the imperfect competition equation, if αp, βp, p t
β , γ p, δ p, and ςp are nonzero.
Table 3 shows positive and significant estimates, suggesting partial pass-through. A 10% increase in the minimum wage increases prices by 0.37% (0.97%-1.17%) in the short (long) run. Robustness checks show similar but smaller estimates, where Equation (3) is re-estimated assuming the production function to be Y=fL(L), instead of Y=fLK(L,K), in which case δ p and κp are zero.
The overall long run price effect for Brazil is large, but the short run effect is comparable to the 4%
food sector price effect and the 0.4% overall price effect in the international literature (Lemos, 2004a). It is also consistent with the evidence of modest employment effects and sizeable wage effects.
All models were White-corrected and sample size weighted, to account for the relative importance of each region (and for heteroskedasticity arising from aggregation). Serial correlation was assumed to vanish after differencing, adding dynamics, controls, regional and time dummies.3
3 The results were robust to SUR estimation. GMM a la Arellando and Bond (1991) is not an option because T>N.
Lemos (2003) shows that any endogeneity coming from the simultaneous determination of spike and employment is
3. Conclusions
Despite of much effort to reconcile the available empirical evidence with the theoretical prediction of employment decrease following a minimum wage increase, very little effort has been devoted to study the theoretical prediction that such an industry wide cost shock will be passed through to prices. Firms will not incur any in employment adjustment costs if they are able to pass through to prices the higher costs associated to a minimum wage increase.
The evidence here is an important contribution to the literature because it helps to reconcile this debate. Standard economic theory is not hurt if wage increases do not cause employment decrease but cause price increases. That is what the evidence here suggests: an increase in the minimum wage strongly compresses the wages distribution, has small adverse effects on employment, and raises overall prices in Brazil. In other words, the minimum wage increases the wages of low paid workers, does not destroy many jobs and causes some price inflation.
Moreover, the evidence here is also an important contribution to the literature because it helps to understand the effects of the minimum wage in developing countries. The main message here is that wage and price effects in Brazil are large whereas employment effects are small. Small employment effects are sensible not only when large price effects are uncovered, but also when a number of other specificities inherent to developing countries are considered. For example, employment effects would not be too adverse in an economy where: non-compliance is large and the public sector has an inelastic labour demand (Lemos, 2004d and 2004e; Neumark et al, 2003; Fajnzylber, 2001); inflation is high and firms do not adjust employment because they perceive the minimum wage increase as temporary (Lemos, 2004f); low wage workers are a large proportion of the labour force (Lemos, 2004g). Such specificities suggest that the economics of the minimum wage in developing might be very different from that of developed countries. To extend the current understanding of minimum wage effects in the former is crucial if the minimum wage is to be used as a policy to help poor people in poor countries.
References
ARELLANO, M., and S. BOND (1991): "Some Tests of Specification for Panel Data: Monte Carlo Evidence and an Application to Employment Equations," Review of Economic Studies, 58, 277-297.
Economics, ed. by O. Ashenfelter, and D. Card. Amsterdam; New York and Oxford: Elsevier Science, North-Holland, 2101-2163.
CARD, D. E., and A. B. KRUEGER (1995): Myth and Measurement: The New Economics of the Minimum Wage. Princeton: Princeton University Press.
CARNEIRO, F. G. (2002): "Uma Resenha Empirica Sobre Os Efeitos Do Salario Minimo No Mercado De Trabalho Brasileiro," Unpublished Paper.
CORSEUIL, C. H., and L. SERVO (2002): "Salario Minimo E Bem Estar Social No Brasil: Uma Resenha Da Literatura," Unpublished Paper.
DICKENS, R., S. MACHIN, and A. MANNING (1999): "The Effects of Minimum Wages on Employment: Theory and Evidence from Britain," Journal of Labor Economics, 17, 1-22.
DOLADO, J., and ET AL. (1996): "The Economic Impact of Minimum Wages in Europe," Economic Policy: A European Forum, 23, 317-357.
FAJNZYLBER, P. (2001): "Minimum Wage Effects Throughout the Wage Distribution: Evidence from Brazil's Formal and Informal Sectors," Anais do XXIX Encontro Nacional de Economia.
FREEMAN, R. (1994): "Minimum Wages--Again!" International Journal of Manpower, 15, 8-25. — (1996): "The Minimum Wage as a Redistributive Tool," Economic Journal, 106, 639-649.
LEMOS, S. (2003): “Political Variables as Instruments for the Minimum Wage”, UCL Working Paper, 03-04. — (2004a): “The effect of the Minimum Wage on Prices”, University of Leicester Discussion Paper, 04/7. — (2004b): “Are Wage and Employment Effects Robust to Alternative Minimum Wage Variables?”, University
of Leicester Discussion Paper, 04/4.
— (2004c): “The Effects of the Minimum Wage on Prices in Brazil”, University of Leicester Discussion Paper, 04/6.
— (2004d): “The Effects of the Minimum Wage in the Formal and Informal Sectors in Brazil”, University of Leicester Discussion Paper, 04/8.
— (2004e): “The Effects of the Minimum Wage Across the Private and Public Sectors in Brazil”, Unpublished Paper.
— (2004f): “The Effects of the Minimum Wage on Wages, Employment and Prices in Brazil in Periods of High and Low Inflation”, Unpublished Paper.
— (2004g): “Minimum Wage Effects across Population Groups in Brazil”, Unpublished Paper.
NEUMARK, D., W. CUNNINGHAM, and L. SIGA (2003): "The Distributional Effects of Minimum Wages in Brazil: 1996-2001," Unpublished Paper.
Table 1 WAG E EF F E CT Dep end en t V aria ble co ef se 10 th per cen tile 0.8 0 0.2 0 20 th per cen tile 0.4 0 0.1 7 30 th per cen tile 0.0 1 0.1 4 40 th per cen tile -0. 01 0.1 2 50 th per cen tile -0. 12 0.1 1 90 th per cen tile -0. 06 0.1 2 me an 0.0 7 0.1 0 90 th /10 th p er cen tile r at io -0 .9 1 0.1 8 50 th /10 th p er cen tile r at io -0 .9 2 0.1 5 90 th /50 th p er cen tile r at io 0.0 1 0.1 0 sta nd ar dd evia tio n -0 .20 0. 05 1) T he depende nt v ar iabl e is sel ecte d p erc entil es, ra tio s o f p erc entil es and standar d de vi atio n o f the w ag es d is tr ibu tio n. Th e m in imu m wag e v ari ab le is " fra ct io n at ". 2) T ime ef fe ct s ar e m ode le d w ith inter actio ns o f y ea r an d s eas on al -m on th d ummi es (t he s ea son al -m on th M ay dum my is no t inte rac ted). L ab our supp ly s hi ft ers are i ncl ud ed as con tro ls . 3) T he es tima te s w er e m ul tipl ie d b y 0.3 to o bta in the e ff ect o f a 10% inc rea se in the minim um w ag e. Table 2 EMP L OYMENT EF F E CT sr lr Dep end en t coef se co ef Varia bles (1 ) (2 ) Firs t Diff eren ce T otal Ef fect 0. 059 4 0.0 3 -0 .0 4 Hou rs Ef fects 0. 059 8 0.0 3 -0 .0 4 Jobs E ff ec t -0 .00 04 0.0 0 0.00 Le ve ls T otal Ef fect 0. 038 1 0.0 2 0.02 Hou rs Ef fects 0. 060 5 0.0 2 0.04 Jobs E ff ec t -0 .02 24 0.0 1 -0 .0 1 1) T he depende nt v ar iabl e is av era ge ho urs w ork ed f or t he la bo ur f orce , a vera ge h ou rs w ork ed f or t ho se e m pl oy ed and em pl oy m ent rate . H ours and Jo b e las ticitie s add to T ota l el as ticity . Th e m in imu m wag e v ari ab le is " fra ct io n at ". 2) T ime ef fe ct s ar e m ode le d w ith inter actio ns o f y ear a nd sea so na l-m on th d um m ies (t he s ea son al -m on th M ay dum my is no t inte rac ted). L ab our supp ly s hi ft ers are i ncl ud ed as con tro ls . 3) Co lu m ns 1 and 2 sh ow the sho rt and lo ng r un co ef fi cie nt. 4) T he to p a nd bo tto m panel s p rese nt es tima tes f or the m odel in l ev el s an d in f ir st-di ff er en ce s. 5) T he es tima te s w er e m ul tip li ed b y 0.3 to o bta in the e ff ect o f a 10% inc rea se in the minim um w ag e. T able 3 P R IC E EF F E C T Mo d el s sr lr coef se co ef (1 ) (2 ) Y= fLK (L ,K ) Gen er al E qu ili br iu m 0. 37 0.08 1.1 7 Im pe rf ect C om petit io n 0. 37 0.08 0.9 7 Y= fL (L ) Gen er al E qu ili br iu m 0. 26 0.07 0.76 Im pe rf ect C om petit io n 0. 23 0.07 0.3 7 1) T he dependent v aria bl e is the dif fe re nc e o f l og s o f pric es. T he m inim um w ag e v aria bl e is " frac tio n a t" . 2) T ime ef fe ct s ar e m ode le d w ith int era ctio ns o f y ear a nd sea so na l-m on th d um m ies ( th e s eas on al -m on th M ay dum my is no t inte rac ted). L abo ur supp ly s hi ft ers an d ag greg at e d em an d sh if te rs a re i ncl ud ed a s co nt ro ls . 3) Co lu m ns 1 and 2 sh ow the sho rt a nd lo ng run co ef fi cie nt . 4) T he to p a nd bo tto m panel s p re se nt estim at es fo r tw o dif fe rent pro duc tio n f unctio ns. 5) T he es tima tes w er e m ul tip li ed by 0.3 to o bta in the e ff ect o f a 10% inc rea se in the m inim um w ag e.