MANAGING THE PROCESS OF ENGINEERING CHANGE ORDERS:
THE CASE OF THE CLIMATE CONTROL SYSTEM IN AUTOMOBILE DEVELOPMENT by C. TERVVIESCH* and C. H. LocH" 97/56/TM
* PhD Candidate, at INSEAD, Boulevard de Constance, Fontainebleau 77305 Cedex, France.
** Assistant Professor of Operations Management, at INSEAD, Boulevard de Constance, Fontainebleau 77305 Cedex, France.
A working paper in the INSEAD Working Paper Series is intended as a means whereby a faculty researcher's thoughts and findings may be communicated to interested readers. The paper should be considered preliminary in nature and may require revision.
Managing the Process of Engineering Change Orders: The Case of the Climate Control System in Automobile Development
Christian Terwiesch Christoph H. Loch
Ph.D. Candidate Assistant Professor
INSEAD INSEAD
77305 Fontainebleau 77305 Fontainebleau
France France
Abstract
Engineering change orders (ECOs) are part of almost every development process, consuming a significant part of engineering capacity and contributing heavily to development and tool costs. Many companies use a support process to administer ECOs, which fundamentally determines ECO costs. We show in the case of climate control system development in a car, how a streamlined ECO management process can successfully complement the engineering efforts of avoiding and frontloading ECOs. This administrative process encompasses the emergence of a change (e.g., a problem or a market-driven feature change) to the final implementation of the ECO. We analyze this process, and identify three categories of problems which can substantially delay it: Congestion, Batching, and Organizational Structure. We explain and illustrate these problems in the case and propose methods of overcoming them.
Introduction
Engineering change orders (ECOs) are part of almost every development process. They result from the fact that engineering is an iterative rather than a purely linear process and are traditionally targeted toward correcting mistakes, integrating components, or the fine tuning of a product [18]. ECOs are also an outcome of the growing level of parallelity in today's development processes, where information-absorbing downstream activities are often started prior to the completion of information-supplying upstream activities and thus have to rely initially on preliminary information [14, 16].
The negative impact of ECOs has been reported in a number of studies. ECOs consume one-third to one-half of engineering capacity [19] and represent 20-50% of tool costs [15], which can easily account for over US$ 100M in large development projects. However, the management of ECOs is not well understood despite this importance. In the past, both practitioners and researchers have tended to view ECO-related problems more as a tragedy than as a sign of process management. In particular, the support process administering ECOs has received little attention, although it has been identified as one of the root causes of ECO costs [5].
It is this ECO support process that the present paper focuses on. In the case of climate control system (CCS) development in a car, we show how a streamlined administrative process can successfully complement the engineering efforts of avoiding and frontloading ECOs. This administrative process encompasses the emergence of a change (e.g., a problem or a market-driven feature change) to the final implementation of the ECO. We analyze the process in greater detail, and identify three categories of problems which can substantially delay this process; we then propose methods of overcoming these problems.
Development of Climate Control Systems
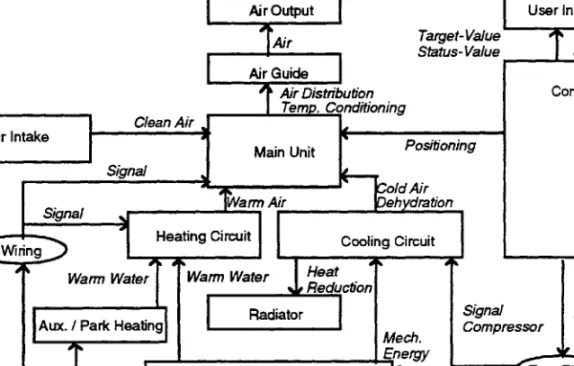
In the present article we discuss the case of climate control system (CCS) development at a large automobile company. The CCS system is one subsystem of the overall vehicle and contains all components related to the climate environment for the passengers, including air ventilation, air purifying, warm-up, and cool-down. We take the CCS system as the basis for this article because it is frequently affected by ECOs and exhibits strong couplings among the activities involved. At the same time, it is a system that is well-suited to illustrate problems and phenomena that are typical for other development processes as well. To quote a manager in our host organization: "Here [in the CCS system] you find all the problems we have in the development of new vehicles: coordination with other components, coordination of components within the system, and information release to tooling." Along with the dashboard, the CCS is the car subsystem having the most interfaces with other activities (see Figure 1 for the CCS architecture).
Couplings in the Development Process
The term "development process" applied to the development of complex products such as automobiles, airplanes, or computers implies a strong simplification. The complexity in the development of such systems is better captured by speaking of processing networks: thousands of tightly coupled activities have to be kept in synch over the course of the development of the vehicle (e.g., [7]).
User Interface Target-Value Status-Value Air Output Air Air Guide I
1
Air Distribution Temp. Conditioning Clean Air Control Air Intake Main Unit Signal old Air ehydration Signal arm Ai Positioningwring Heating Circuit Cooling Circuit dh►
Warm Water WarmWater Heat Reduction
Radiator Signal Signal
Aux. / Park Heating
Mech. Compressor Compressor Energy
Signal I Engine Eng. Elect
Signal Compressor
Figure 1: CCS Architecture
Couplings between activities in this processing network can be classified into two groups, product-product and product-process couplings. A product-product coupling exists between the development of two interacting components which are part of the same overall system. Geometric fit in the three-dimensional space of the vehicle package is the most common interdependence. Another example is the interdependence resulting from resource exchange, e.g. the heat energy supplied by
the engine to the heating circuit, information provided from the control unit to the
main unit, or fluids exchanged between the elements of the cooling circuit. Product-product couplings can occur between subsystems, e.g. CCS system and engine, as well as within subsystems, e.g. control unit and fans in the main unit.
Product-process couplings describe the interdependence between an activity developing a component or product subsystem and the activity developing the corresponding manufacturing process. Examples from CCS development include the coupling between the development of the filter and the preparation of the corresponding stamping tools, or between the design of the control unit software and the preparation of the required ASIC technology.
The Role of Couplings for the ECO Process
The two types of couplings, product-product and product-process, are of fundamental importance in understanding the difficulty of ECO management. In the absence of all couplings, the process of ECOs would be simple: whenever an engineer finds a reason to change the component(s) he/she is working on, the change is implemented immediately. However, the presence of couplings makes it difficult to change one activity without triggering a change in another:
• A change in a product development activity can trigger a change in another product development activity if the corresponding components interface (product-product coupling). For example, a change in the heating unit can activate changes in pumps or valves in the main unit, which in turn can necessitate adapting the control unit. • A change in a product development activity will almost always trigger a change in
its corresponding process development activity (product-process coupling).
The consequences of these couplings are significant and painfully experienced in many development projects (e.g., empirical evidence from the electronics industries is reported in Terwiesch et al. [21, 22]). What initially looks like a small change in one component snowballs to other components, bridged by product-product couplings, requiring major rework. In the same spirit, Soderberg [19] reports that in his study, about 45% of engineering time was spent on changing components that had been "thought to be ready." As a result, the average component was developed at least twice. Once the ECO snowball has created a number of component changes, the product-process couplings spring into action and spread the change requirements to tool development. Clark and Fujimoto [5] as well as Lincke [15] report that die development costs in vehicle development are 20-40% caused by ECOs. Moreover, the snowballing ECOs create overall confusion and instability in the development, leading to time delays and quality problems.
Facing these complex interdependencies and their negative consequences for a development project, most companies have established a formal support process designed to coordinate changes and to combat the previously discussed snowball effect. On the research side, the importance of ECOs has been reported in a number of studies, e.g. [4, 5, 12, 15, 19, 20, 25]. However, most of these studies have restricted themselves to describing the symptoms of ECO problems without providing tools to address the root causes.
In the next section, we present four principles of managing ECOs, three of which are largely engineering-driven and only briefly presented here. The fourth principle, in contrast, is process-related and - as we will illustrate below - provides an opportunity for significant improvement through process redesign.
The Four Principles of Engineering Change Order Management
Engineering Change Orders are not always to the the detriment of the project, as many cost savings or performance improvements are brought into the project in the form of ECOs. Thus, ECOs have a role in improving the product, and efforts to eliminate them entirely are both undesirable and unrealistic (Clark and Fujimoto [5]). However,
one observation is almost universally true: Whatever its positive effect, the negative effect of a change increases, the later the change is implemented. This stems from the couplings discussed above: the later the change, the more work there is to be modified in affected activities, be it interfacing components (product-product coupling) or the manufacturing process (product-process coupling).
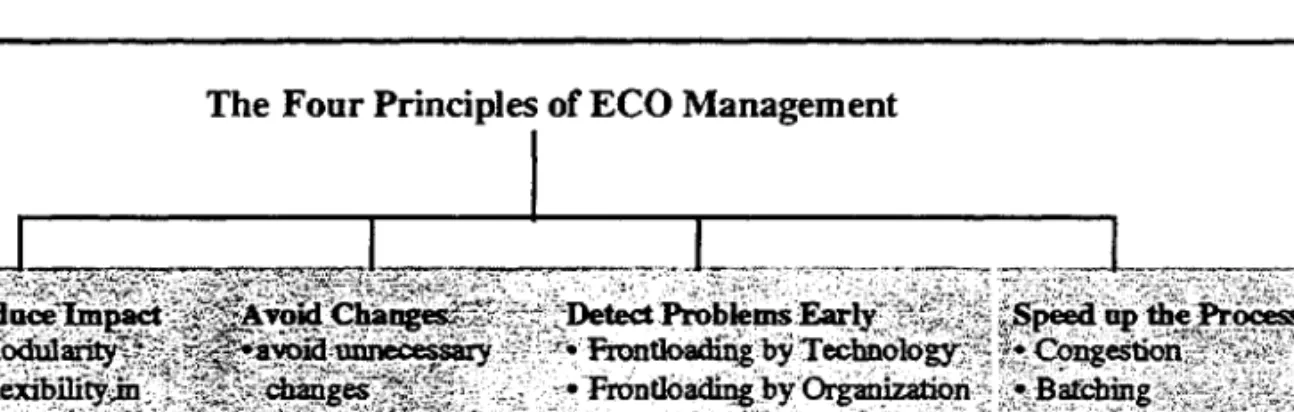
Although a general recommendation such as "freeze early and allow no further changes" is not appropriate, there are a number of strategies a development organization can adopt to reduce the negative consequences of ECOs. We formulate them as "Four Principles of ECO Management", of which the first three are more engineering-driven (and only briefly discussed here), and the last one is process-driven and discussed in detail below.
The Four Principles of ECO Management
Approaches from the Engineering Perspective Process Perspective
Figure 2: The Four Principles of ECO Management
Avoid unnecessary changes
New product development is an iterative process and will thus always experience some late changes, although, in concordance with Clark and Fujimoto [5], we have found that many ECOs are not necessary changes and can be avoided if the engineer responsible spends more time on the first release of the component. Since, on average, every component has to be changed once [19], many engineers feel no reason to provide good information to other parties in their "first shot", as they know they will have to rework the component anyway. In addition, some ECOs look beneficial at first sight, but in the end provide only minor cost savings that do not justify the negative non-financial externalities caused by the change. In CCS development, for example, a change in the rubber compound for a CCS water pipe that saves 50¢ per car at 200,000 units per year may justify a retooling investment of US$ 250,000, but at the same time may cause so many unforeseeable interactions, that it would be better not to implement the change. A project manager shared with us a simple rule of thumb: "If a change pays back in a year, I go for it. If it takes two years to pay back, we discuss it with our financial services for cash-flow details. Everything that needs a longer amortization period, I veto." Thus, at some point in the project, it is beneficial to freeze all fine tuning and, for quality reasons, permit only those changes that are absolutely necessary.
Reduce Impact
The second principle takes the occurrence of the ECO as given, and focuses on minimizing the impact of the change. As we have previously discussed, this impact is a function of the couplings between the activity causing the change and interdependent other activities. Product-product couplings, and thus the ECO snowball effect, can be best addressed by the product architecture. The more modular the overall system, i.e. the more self-contained the different subsystems, the less likely becomes the ECO snowball. One example from CCS development is the control software, which has modular subsystems for its detailed parameters and for the overall system logic. An increased air throughput can be achieved by making adjustments in parameters, which can be changed without creating problems even as late as during after-sales service. The importance of product architecture and modularity and their implications on the development process have been discussed by Ulrich [24] as well as Gulati and Eppinger [10]. Product-process couplings can be addressed through flexibility in the manufacturing process, e.g. in the form of special materials for prototype dies [23] or in delaying certain irreversible downstream decisions until more information is available [5].
Detect ECOs Early
The third principle is based on the observation that ECOs become more expensive and harder to include the later they are implemented, thus making it desirable to detect all need for changes as early as possible in the process. This strategy of moving changes forward in time and thereby reducing their negative impact on other activities is frequently referred to as frontloading [9], which can be achieved by technological and organizational means. For example, in CCS development frontloading by technology can be achieved by using CAx tools to simulate aerodynamics within the passenger compartment to get an early idea about passenger ergonomics. Also windshield defrost simulation can be performed long before any hardware models are available. Frontloading can also be achieved by organizational means and formal Design-for-Manufacture methods, such as early reviews with manufacturing or logistics experts (for an overview, see [1, 8]). This enables the organization to detect, at an early stage, changes which usually remain hidden until the corresponding downstream activity starts working. In the project we studied, it turned out to be extremely helpful to involve after-sales service experts in the design of the air filter system, as this determines the frequency and ease with which the air filters have to be changed in after-sales service.
Speedup the ECO Process
The first three principles all have their roots in the engineering domain. The fourth principle we wish to present, and subsequently explore in more detail, refers to the
complex decision and support process which manages and coordinates the ECOs.
Like many other administrative or production processes, the ECO process often suffers the symptoms of long response times and non transparent information flows. That is, the time it takes between the detection of a need for a change and the time the
ECO is finally in place is disproportionate to the amount of work it takes to perform the intermediate steps. Blackburn [4] reports that the value-added time for ECOs in Airframe Manufacturing is as low as 8.5%, thus for every day of actual processing time there are two weeks of non-value-added time. Most of this is waiting time, thus the ECO is on someone's desk, pending further processing. These results, consistent with our observations, are shocking, especially when the enormous time pressure on development processes in general, and the ECO process in particular, are taken into account.
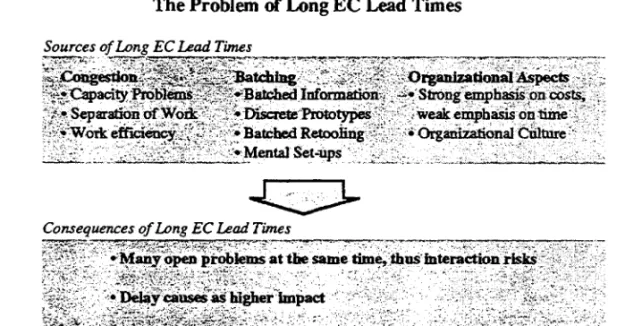
The consequences of long ECO lead times further amplify the problems of snowballing and tool changes which we have discussed above. More specifically, they include the following issues:
• Problems are long-lived. We have seen "open" (unsolved) problems remaining on the agenda for over a year. This reduces the sense of urgency on the part of the engineers involved, and can cause problems during volume-ramp-up.
Having long-lived problems means also having many of them open simultaneously. •These changes have to be coordinated and can cause substantial difficulties of interaction. In the days when engineering was still done on drawing boards, this interaction did not exist because once an engineer had taken the drawings from the archives, other engineers were unable to work on the same components. However, in the age of CAD, coordination among engineers is more difficult as now multiple parties can work with the same data simultaneously.
• A long response time causes late implementation of the final ECO, which is not desirable because of the increasing change costs for tools and interfacing components.
In the next section, we will discuss the possible reasons for such long response times in the process and what can be done to streamline it, in order to reduce the response times.
Sources of ECO Lead Time Problems:
Congestion, Batching, and Organizational Structure
Before we can start analyzing in greater detail why it takes so long from the detection of a problem to the implementation of the ECO, we have to understand the steps that are required in between. Consider a prototype test in CCS development where the development organization finds that the rubber water pipes in the engine compartment start leaking because of high temperatures. Figure 3 describes the steps to be taken before the required ECO successfully solves the problem. First, after the problem is detected in the prototype, it is typically entered in a project or quality management system which allows a precise tracking of the problem. This requires a definition of the scope of the problem and a first assignment of responsibility. In a next step, the problem is discussed in different types of team meetings, including the functional team in charge of the component (CCS development) and one or more cross-functional teams dealing with interfacing components. Once the problem is discussed and clearly identified, it has to be reproduced in a controlled environment to ensure that causes are indeed well understood. Then, alternative design solutions have to be generated and
Purchasing: Ordering of modified parts
Definition of the Scope of the Problem and the Engineers Responsible
Meeting of X-functional Team, e.g. Between Engine Engineers and CCS Engineers to Discuss Causes
Exact Identification of the Problem Cause and
Reproduction of Problem in Controlled Environment Meeting of Cross-functional Team to DiscussAlternative Packaging Solutions
•
rmance
Accounting Decision by Project Man.
discussed with other interfacing modules, suppliers, and manufacturing representatives. This ultimately results in an ECO recommendation to project management. If project management gives the green light for implementation, and the cost accounting group sees no reason to object, the purchasing department asks the supplier to include the change in the coming batches of prototype parts. When new parts with the ECO implemented arrive for prototype construction, an evaluation of the new design solution can be made.
Figure 3: An Illustration of the ECO Process
The real process is even more complicated than is depicted in Figure 3, which describes a case where the first iteration solves the problem, leaving out possible loops. Each of the activities in Figure 3 takes between half an hour (e.g., decision by project management) and a few days (e.g., reproduction in a controlled environment), but even with some loops in the process, the total time required to perform the activities does not exceed 10 days. So, how is it possible that it sometimes takes several months or even a year until a change is implemented? What are the issues explaining waiting times of up to 90%?
In our study, we identified three drivers of excessive waiting times. First, we frequently found that ECOs were not implemented at the earliest point possible, but instead collected over a period of time (e.g. a week or a month) and then processed in a batch. Second, we observed that many organizational units were so overloaded with
work that ECO-related tasks sometimes just piled up on desks, similar to congestion
problems which are familiar in computer networks or job shop manufacturing.
Finally, we encountered a number of cultural and organizational issues which further
contributed to long waiting times. These three sources are consistent with Clark and
Fujimoto's reporting on body die development: "Short setups (corresponding to
small batches, remark from the authors), short queues, reduction of throughput time, and streamlining of process flows all contribute to reducing downstream response time to a given upstream change." Thus, the Clark and Fujimoto study emphasizes the
Sources of Long EC Lea Times
Organizational Aspects
Strongetnphasis cos weak emphasis on time
Olga Culture
Consequences of Long EC Lead Times
- ,
any open problems at the same time, thus interaction erimpact
importance of quick response to ECOs and also provides an excellent description of ECO-management in the die development case. However, Clark and Fujimoto do not further analyze the causes of long lead times and provide little guidance as to potential process improvements, since their study has a different focus from ours. We now explore the sources of long lead times in greater detail, as summarized in Figure 4.
Figure 4: Sources and Consequences of Long ECO Lead Times
Managing Congestion in the ECO Processes
Congestion as a result of high work load is a phenomenon frequently observed in day-to-day life, a familiar example of which is the checkout in a supermarket where customers queue up for their turn. More often than not, the result of such queuing is a ten-minute waiting time for an operation that takes less than a minute. But how can this long waiting time be explained?
Analytical Background
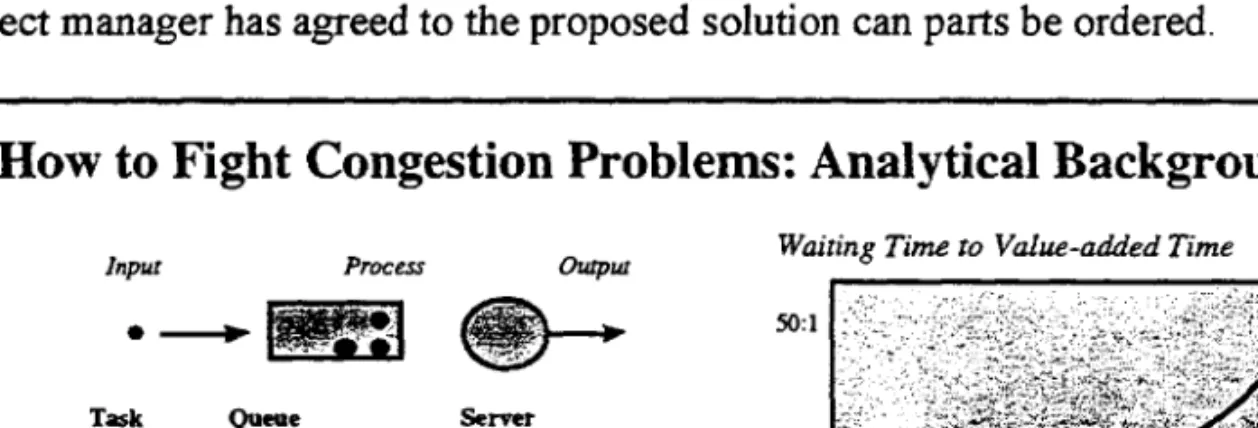
As previously discussed, the total throughput time of a task (e.g. the lead time of an ECO, the time to get through the checkout in a supermarket) is composed of (a) the actual time it takes to process the task (e.g., the time it takes the project manager to make a decision concerning the ECO) and (b) the time the task remains pending (e.g., the time an ECO stays on a purchaser's desk before a part order takes place). Focusing for the moment on a single processing activity, the waiting time is known to increase nonlinearly, and is characterized by three factors:
• the "business" of the server processing the task (technically, the capacity utilization),
• the variability with which new tasks arrive at the server. This can be measured by the so-called "squared coefficient of variation" (SCV), which is defined as the squared ratio of variance and average of the inter-arrival times,
Input Process Output
Task • Pay at
cashier
Queue Server •Line at checkout • Cashier
Utilization
0% 100%
50:1
• ..••■■•■•
• ECO • In-basket on • Engineer engineer's desk
Waiting Time to Value-added Time
10:1 1:1
How to Fight Congestion Problems: Analytical Background
• the variability of the processing time at the server, measured analogously by its SCV.
The relationship between waiting time and actual processing time is a function of these three factors, a relationship known as the Pollaczek-Khintchine (PK) formula':
waiting time 1 utilization
= (arrival variabilioi+ process variability)
task time 2 1– utilization
The mathematically trained reader will quickly notice that the waiting time becomes more and more the dominant expression as utilization increases. For utilization levels close to 100%, the relationship between waiting time and task time can become even worse than 50:1, as depicted in Figure 5. These problems occurring at a single server, such as a cashier, are further amplified if the process consists of several operations, based on a whole system of servers such as the ECO process from Figure 3, shown as a system of servers in Figure 6. In such a queueing or processing network, some
operations can only be started if all previous activities have been completed, which
further contributes to long waiting times: Only after financial analysis is done and the project manager has agreed to the proposed solution can parts be ordered.
Figure 5: The Congestion Phenomenon in the ECO Process
In our study of the CCS development process we found a surprising similarity between the engineering organization and a queueing network as previously discussed. As described in Figure 6, an ECO has to go through a series of operations (corresponding to the boxes in Figure 3). At each operation, the ECO must queue for service because the corresponding organizational units have other tasks to work on as well. As in any development organization, the variability of work arrival and processing times is very high, and, at the same time, the utilization typically ranges from 85% to 95% to cover the high fixed costs of engineering departments. Therefore, it comes as no surprise that ECO lead times are, in some cases, more than 10 times the
1 The formula describes the ratio of waiting and processing in the long run, i.e., if one observes the
development organization over a long period of time. The formula is a good approximation if the utilization is high, and tasks arrive from multiple independent sources. This represents the situation most relevant in practice. For further mathematical details, we refer the interested reader to Wolff [26] or any other book on queueing. Typical applications of the formula include computer networks and job shop manufacturing.
actual processing time. The similarity of congestion problems in engineering organizations and other queueing networks has only recently received academic
interest (prominently Adler et al. [2, 3]). Although the sources of the problem are
now at least partially known, it is not yet well understood how the situation can be improved. Below, we propose four strategies for approaching the ECO congestion problem in development organizations.
Figure 6: The ECO Process as a Network of Queues
Opportunities for Improvement
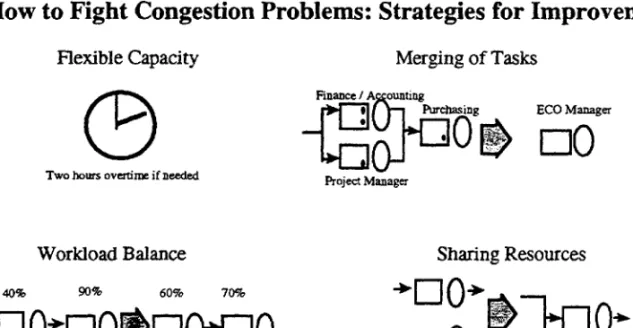
Congestion problems can be easily avoided by just adding extra capacity, although, for obvious financial and political reasons, this approach is out of the question. The objective of the improvement methods presented below is to improve ECO lead times without adding extra capacity to the engineering organization. The methods are: • better matching the timing of when capacity is needed and when it is provided, • merging several tasks into one larger task,
• balancing the workload between the different units in the system, • sharing resources across several tasks (pooling the resources).
We illustrate the potential effect of these improvements on a simplified numerical example, which still roughly corresponds to the above described ECO process that we observed in our host organization. In the example described here, 19 ECOs arrive, on average, per week, at random points in time. Each ECO takes an average of two hours to develop a solution proposal, two hours to be simulated, 45 minutes to be checked for its cost impact, 45 minutes for new parts to be ordered, and ten minutes of the project manager's attention for approval. The project manager (who is extremely busy) discusses ECOs only once a week, during the weekly project team meeting, when approval or rejection decisions are made on the spot.
Two engineers devote their time to the first step; one person performs each of the other steps. All employees work five times eight hours a week. We can calculate the utilizations at each step; for example, at CCS engineering it is:
Utilization = 47.5% = 2 hours/task x 19 tasks / (40 hours x 2 people).
ECOs arrive irregularly and vary in their complexity, so the SCVs of both arrivals and processing are equal to 1 (the standard deviation equals the mean). With the help of
Project Manager Two hours overtime if needed
ECO Manager
0
Finance / A ountingI
PurchasingHow to Fight Congestion Problems: Strategies for Improvement
Flexible Capacity Merging of Tasks
Workload Balance Sharing Resources
40% 90% 60% 70%
q
04-
q
0
q
0H
q
0
C10)?/-*Ei
0)-the above formula, we can now find 0)-the average throughput time at each step (waiting time plus processing time), which add up to a total of 64.2 hours (a summary of the utilization profiles as well as the details of all calculations in this example are shown in the Appendix). In other words, an ECO takes on average over 1.5 weeks (and in some cases much longer) to go through one iteration of the ECO process, although it has on average only 5.5 hours of work invested in it.
Figure 7: Reducing Congestion in the ECO Process
The first improvement strategy addresses the basic source of queueing problems, the mismatch between when capacity is needed and when capacity is provided, by
increasing the flexibility of the server. Remember that in the discussion above, as well
as in the presented formula, the utilization (the relationship between capacity available and capacity required) must be less than 100% on average, as otherwise one would fall behind in the long run. Thus, if it were possible to provide the server capacity at the moment it is required, queueing could be completely avoided. Now consider the simulation engineer, who faces the highest utilization of all with 95%, working up to two hours per week overtime (for example, during lunch or at night), whenever an ECO backlog piles up on his/her desk. On the other hand, he/she may go home earlier if the workload is light. Thus, in the long run, the engineer does not work more than 40 hours a week, but the work is provided just at the time when it is needed. With this flexibility, the effective utilization factor goes down to 90.5%, thus reducing the average throughput time for simulation from 40 hours to 21 hours, a reduction of 48% at this station and 32% overall (again, detailed calculations for the example are shown in the Appendix).
The first improvement strategy is targeted at an individual server, whereas the second
strategy of merging tasks looks at multiple servers collectively. Consider the three
tasks of financial analysis, approval by the module project manager, and that of ordering parts. The ECO in the current situation must queue at each of the three
servers, risking waiting times at each of them. In our example, we introduce a manager whose time is devoted to performing cost analyses and ordering parts, and who also has the authority to approve ECOs on the spot. If this manager approves ECOs flexibly during the week (not only in the weekly meeting), the total average throughput time of the overall process is reduced by 18 hours, or 28%. In the company we studied, we indeed found a number of "ECO managers" who accumulated the work that was previously done by separate organizational entities. We also observed that some module project managers approved ECOs on the spot while walking around through the engineering cubicles.
The third strategy of balancing workload is based on the observation that process lead times are frequently dominated by one single activity, referred to as the "bottleneck" activity, which is the one with the highest utilization, and determines the speed of the whole system. In our CCS development case, the bottleneck is easily identified as the aerodynamics simulation engineer with a utilization of 95%. At our host organization, the corresponding group is permanently short of engineers and is thus incapable of responding quickly to the requested ECO evaluations, because of the high expertise required for the job. To make matters worse, the group spends a significant amount of its time reworking CAD models created by other CCS engineers, in order to bring the models to an accuracy level required for the simulation software. Thus, about one third of this group's precious time is wasted on work that could equally be performed by CCS engineers. If this preparation work is shifted in our example from the simulation engineer to the CCS engineers, capacity utilizations become better balanced. As a result, the total average throughput time is reduced by 33 hours, or 52%.
The last strategy, that of pooling, or sharing workloads, among engineers, is based on reducing specialization in the development organization, requiring the capability of the engineers to assume a broader technical responsibility. Pooling is often efficient from a queueing perspective for three reasons. First, utilizations are balanced within the pooled group. Second, it cannot happen that one worker is starved of work while another has tasks waiting in his/her in-basket. Third, if one individual ECO happens to be very complicated and time consuming, the subsequent ones are not "stuck" behind it, but can (at least slowly) bypass it via the other pooled servers.
Pooling, however, may also have a downside. First, and most obviously, the engineers may have to go through "mental setups" and become less productive if spread across different tasks. Second, pooling may increase the processing variability if different types of jobs, although homogeneous among themselves, but very different across types, are pooled. If, for example, ECOs for the filter box (requiring air flow analyses) and for electrical motors (requiring electrical design) were to be pooled, one engineer would be responsible for total CCS ECOs and face a multitude of very different tasks. This could increase the variability of the workload and thus queueing effects, even if the engineer was perfectly cross-trained.2
2 The tradeoff is too complicated to be meaningfully included in our simplified example, so we provide no estimate of the potential benefit.
Pooling may not be possible for pure research tasks, which require a profound expertise in one specific domain. However, we found it to be typically applicable for engineering tasks such as ECOs, which comprise relatively standard operations. Engineers can share work on similar components, such as air and water ducts for different parts of the CCS, or on the analogous components for different car development projects that progress in parallel.
In summary, each of these four strategies can dramatically reduce ECO lead times without taking the brute force measure of adding capacity. The resulting streamlined process will also be advantageous from a quality perspective, as shorter lead times reduce the number of ECOs that are in process at the same time, thus reducing the risk of rework being incurred by interacting changes. Finally, engineers can obtain immediate feedback on the effectiveness of their changes, which helps them to develop a better understanding of problems and solutions.
Managing Batching Problems
The batching of orders is one of the oldest principles in management research (Harris 1913 [11]). In the presence of some fixed setup costs or setup delay, it is advantageous not to process every order individually, but to process a number of them in one batch. The disadvantage of batching is called a "holding cost." In the case of ECO batching, this holding cost results from delayed implementation: if an ECO is not implemented on occurrence, but rather batched with other changes, the ECO lead time is lengthened and thus the change effort is increased.
Sources of ECO Batching
In our study of CCS development, we identified four reasons for batching ECOs: • batched information release, e.g., because of regular meeting times,
• batching for coordination reasons, e.g., for prototype building, • batching as a result of setup costs for retooling,
• batching as a result of mental setups.
The first type of batching has received the most attention over the last years: instead of continuously exchanging information, engineers of different functions meet only at specified milestones or review points to discuss the current status of the project. In the most extreme cases, the whole product engineering information is packed in one batch and then "thrown over the wall" to process engineering. Descriptions of such behavior can be found in Blackburn [4] or Clark and Fujimoto [5]. In our study, we also found some cases of information batching, but batch sizes were typically very small and created delays of only a few days. For example, ECOs were put on hold until the next weekly scheduled meeting between different organizational units. While this type of batching may still be of importance in some industries, we observe a diminishing importance in the automobile industry. We will discuss this in further detail below.
The second type of batching is sometimes referred to as a "synch-and-stabilize strategy" (see [6] for an example in the software industry and [17] for an example from airplane development). Component changes and tool changes can only be implemented during pre-scheduled prototype builds, as a new prototype vehicle cannot be constructed for every single ECO. Typically, a car development project includes about 70 prototype vehicles which are produced in 5-10 "waves" spread over a one to two-year period. Since most projects include more than 1,000 ECOs, not every one can be implemented immediately. Instead, some ECOs have to be batched with other ECOs and then implemented in the next available prototype wave. As a result, an engineer asking for permission to change a component by submitting an ECO usually has to specify the prototype vehicles in which the change should be implemented, for example, "change material for cooling pipes from wave 6 onwards".
Third, batching may be advantageous because of scale economies in implementing ECOs. Consider, for example, the case of reworking injection molds. If every ECO was implemented individually, every time thereafter, the mold would have to be disassembled and transferred to the tool-makers where it would be re-cut, re-welded or in extreme cases even scrapped. If, however, ECOs are batched, several changes can be included in one retooling setup, thus significantly saving on setup costs.
Finally, we have observed a behavior by individual engineers that can be described as "mental setup costs." Take, for example, an ECO that requires a repositioning of the cooling circuit in the engine compartment of a car. Considering the package density of today's vehicles and the size of the corresponding pipes, this task is one of the most difficult packaging challenges which requires the engineer to "dive deep into the problem." This includes loading all the relevant CAD files (in the past, searching out all relevant drawings), linking the CAD data to get a model suitable for the current problem, and to cognitively visualize the complete three-dimensional packaging geometry. Such a setup can easily take a whole day, followed by several days during which the engineer is likely to devote all his time to the particular problem he is working on.
Opportunities for Improvement
Each of the four batching types may result from a rational decision: batching of ECOs is not an inefficient practice in the presence of the described situations (e.g., Loch and Terwiesch [16]). The larger the ECO batch size, the longer is the average time between problem detection and final ECO implementation. The previously discussed disadvantages of long ECO lead times represent batch "holding costs." However, because of setups, it would not be wise to just ignore all batching reasons and to implement every ECO on occurrence. The only way of improving this tradeoff lies in addressing the sources of batching, i.e. the setups, reducing batch sizes through a setup cost reduction. We now present three strategies with this objective:
• Communication technologies, • rapid prototyping,
• project dedication and easy-to-use CAx.
The first setup reduction strategy in managing ECOs focuses on the fixed time investment required for a physical meeting of organizational units. With the growing power of CAx technologies, in which the automobile industry heavily invests, such setups can be relatively easily reduced. The better the IT platform, the easier it is to forward information without physical meetings. ECOs are implemented, using the current CAD data of the project team, and an administrative warning to all affected parties is sent out by e-mail or via the corporate intranet. In our study, we found this procedure to be relatively advanced within the company. However, significant problems arose in the electronic integration with suppliers and the cooperating external engineering groups. One explanation for these problems given by our interviewees was the high financial investment necessary to obtain CAx hardware and software, to continuously purchase the most recent release of the system, and especially to develop internal expertise for such systems. These investments proved too great for some of the many small- and medium-sized enterprises involved in the process.
The second strategy reduces the importance in the development process of traditional prototypes, which are the source of the second batching type previously discussed. Again based on the recent advances in CAx technology, it is now more and more feasible to replace such physical prototypes with what are frequently referred to as "virtual prototypes" [23]. While such virtual prototypes were previously only suited to discussing design decisions, now many other functions, traditionally taken by physical prototypes, can be performed on the computer. Examples from CCS development include:
• defrost simulation of a windshield,
• analysis of air flow dynamics in the passenger compartment, • computation of air throughput of the air filter.
A second trend which has emerged in recent years is the application of rapid prototyping technologies as another way of substituting traditional prototypes. This trend has been facilitated by new prototype materials, such as paper and photolithography.
The last strategy we wish to mention addresses mental setups. A first step in dealing with this problem has already been taken by allowing the engineer to access all electronic drawings from his/her CAD workstation. Most of the more senior engineers we talked to still remember vividly the time when an engineer had to go to the drawing archives and physically take out the drawings for a vehicle subsystem. Despite the progress of CAD technology, substantial differences persist across companies in how easily these systems can be used and thus how large the setups for getting started are. While some companies have achieved easy-to-use CAD [9], many others still wrestle with complicated CAD systems and a lack of CAD-trained engineers. Engineers who schedule themselves special "CAD-days", as they are forced to reserve a CAD station in advance, are still the rule in most industries. A second opportunity of reducing mental setups lies in the division of work between
engineers. While it is advantageous to have engineers devote their time to components requiring profound functional expertise (e.g., the ASIC technology in the control unit), in other cases more integrative in nature (e.g., packaging of a cooling circuit), it may be better to have an engineer assigned to a vehicle project. Aligning work assignments with the knowledge requirements of the tasks saves the engineer substantial change-over costs between technologies or projects.
Managing the Organizational Aspects: Cultural Differences and Process Knowledge
In addition to the congestion and batching delays described above, we also identified two organizational aspects which contribute to long ECO lead times, namely cultural differences and lack of process knowledge across group boundaries.
First, in the development organization we studied, we found a dominating culture of
cost management, and, at the same time, relatively little emphasis on time
management. This was mirrored in the measurement and incentive mechanisms in place, which were strongly targeted toward staying within the budget. If an engineer created a design solution exceeding the target by a few cents, multiple alarm mechanisms were triggered, escalating ultimately all the way up to senior management. If, however, some crucial information was provided with several weeks' delay, no measurement system was in place to detect the delay problem. Another example of this cost culture is the rather complex ECO approval process, some aspects of which we have discussed above. Multiple levels of signatures were required to spend extra money, but, again, no signature was required if time-critical tasks were not completed on time. As a result of this, the development organization has only recently realized the importance of short ECO lead times. Prior to that, time performance could not be measured, and ECO management did not receive the same attention as it does today.
Second, and partly related to the first point, we found a substantial cultural difference
between the two groups involved in the process. From previous studies, we had
expected to find such a culture gap between product and process engineering, but these two groups were surprisingly close to each other. However, a gap was found between the group of engineers in charge of integrating the process and the engineers responsible for the actual detailed engineering. The first group was relatively small (about 30-40 people) fully dedicated to the vehicle project, and reporting through a flat hierarchy to the overall vehicle project manager. Although almost all of them were electrical or mechanical engineers with a passion for cars, they resembled rather, in many ways, a typical management profile: using cellular phones, dressing in suits, using e-mail and intranets, permanently communicating (including shouting from one corner of the building to another), and sharing an open office space with no walls except for those enclosing a few meeting rooms. Despite their technical expertise, surprisingly few of them were skilled in using CAx technology, which prompted -from the second group - the nickname "A4-engineers" (which refers to the fact that in the "old days," sophisticated engineering drawings were done on large sheets of paper clipped to large drawing boards, whereas administrative procedures were written on
A4-format paper). The second group was part of the functional engineering organization, had the same engineering background, the same passion for technology, and also the same pay level. However, there was a different atmosphere predominant in this part of the company: long corridors of closed doors, virtual silence in the buildings, and people sitting behind large drawing tables now used as room separators. This difference in culture was especially apparent when it came to agreeing on priorities between project organizations and the functional organization, which served several projects simultaneously. Of course the project engineers had a clear view of what was important: their project, and most importantly ECOs! The functional engineers, however, had plenty of other activities to work on, including other vehicle development projects, consultation with after-sales services, pre-development projects, and so on. As a result of the cultural differences, project engineers often had the impression that functional engineers were unwilling to respond to their requests. This led to increased tension between the parties and frequent interventions on the part of senior management for minor problems.
Third, we observed a lacking awareness of the consequences of an ECO. Talking to both sides, engineers requesting changes and engineers being affected by these changes, we observed the case where a CCS water pipe was to be re-positioned to go through the bulkhead fire wall at a point 2 cm away from that marked on the initial plan. Asked for the cost of the change, the ECO-requesting engineer estimated about US$
10,000: "Just some minor adjustment in the stamping tools." The response from the engineer in charge of developing the fire wall, who was affected by the change, fundamentally differed: "Some holes we can change, but not this one. And most importantly, not now. Changing the hole today will cost us several US$ 100,000 because the anchoring of the car on the assembly line is affected."
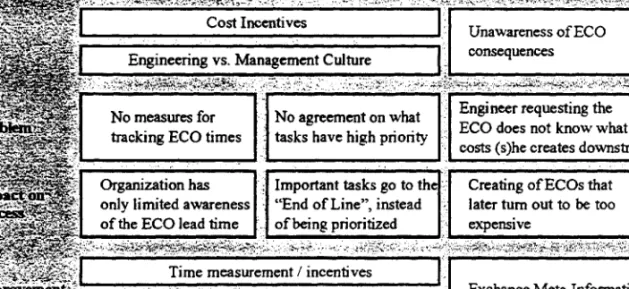
There are no easy answers to these organizational problems, although some recommendations, which are summarized in Figure 8, are listed below.
Opportunities for Improvement
From coordination to integration: Over the past years, most advanced development organizations have made progress in bringing engineers together to exchange information. Cross-functional teams and early manufacturing involvement are now the norm rather than best practice and have led to tremendous improvements in development performance. However, in in the words of one of our interviewees: "There's more to developing vehicles than just communication." Hauptman and lErji [13) emphasize the importance of addressing the interdependencies between activities - and thus the need for information exchange - not only by coordinating the tasks, but especially by integrating the corresponding organizational units. These authors define coordination as an information exchange to keep different, interdependent activities in synch. Coordination is typically achieved by means of meetings, e-mails, intranets or CAx technologies. Integration, however, goes further than this, as it attempts to overcome organizational and cultural divides between different organizational units. Such divides typically result from a specialization of work and can be addressed by
Cost Incentives
Unawareness of ECO consequences
Engineering vs. Management Culture
No measures for tracking ECO times Organization has only limited awareness of the ECO lead time
No agreement on what tasks have high priority Important tasks go to the "End of Line", instead of being prioritized
Engineer requesting the ECO does not know what costs (s)he creates downstream
Creating of ECOs that later turn out to be too expensive
Time measurement / incentives
Exchange Meta-Information
From Coordination to Integration
job rotation and joint working platforms instead of communication teams, and common activities such as visits or conferences.
Figure 8: Approaches to Organizational Structure
Second, although most development organizations have progressed beyond a tradition of craftsmanship, some of its cultural aspects still exist. A strong passion for a perfect product is a great asset to an engineering organization and helps create competitive advantage in the products offered. In the case of ECOs, this passion becomes evident in an enormous flexibility of including late changes to fine tune the product. However, such a product focus is frequently associated with a tendency to overlook process issues, causing delays or quality losses in the launch of the product. There is no reason for criticizing the engineer's ambition to create excellent products, but there is more to being a successful development organization, as is best captured by a comment of the head of development in our host company: "Over the last decades, our company has been renowned for its product excellence. If we want to make profits in the future, we must reach the same excellence in our processes." Creating performance measures which not only capture product performance and cost
aspects, but which provide a guidance towards time measurement is an important first
step in that direction.
Finally, unpleasant downstream surprises with regard to the consequences of ECOs can be avoided if the organizational units exchange what we may call "information," which is independent of individual ECOs in process. Such meta-information could, for example, be provided by the engineer developing the fire wall as: "Hole x is crucial for the current design and can only be changed at high costs, hole
y can be easily moved within a radius of 15 mm, and in region z we can not allow any
holes." Such information could be used by others, CCS engineers, for example, in order to guide their development work. In the given example, the CCS engineer would not waste any time working on a design alternative with a changed hole x, but from the start build his/her change around a repositioned hole y. Other examples of such meta-information are given in [14].
Discussion and Outlook on Future Research
In this article we have outlined a process-based view of ECO management. We have shown that many of the problems related to ECOs have their roots in a complicated and congested administrative process. We then outlined three sources of long ECO lead times and proposed tools for overcoming them. In a highly parallel development process, more engineering tasks must start with low quality information. Thus, the importance of ECO management will grow even further in the coming years [15]. This is also reflected by our host company's recent decision to elevate ECO management to one of their six core development processes.
Future research should respond to this growing importance, and we see three promising avenues to follow. First, the models presented here simplify the complexity of engineering projects in order to illuminate the structure of the problem. Future research will have to provide richer, more detailed models that better describe the multitude of tasks flowing in the processing network called "development organization". Second, the role of CAx technologies in managing ECOs deserves further attention. Such technologies may in the future be capable of automatically detecting problems in the current design (to some degree, this capability already exists, e.g., for fit problems in packaging). Automatic problem detection and ease of including changes in virtual prototypes will bring about a fundamental reconsideration of the ECO process. Finally, organizational integration, as outlined above, does not automatically follow the introduction of new powerful technologies. One manager at our host organization commented: "We have all the tools, but we don't know how to make our people use them all effectively." How the cultural divide between organizational units can be overcome and an overall culture of process management be achieved, need to be further studied.
A resulting more detailed understanding of the ECO process will allow development organizations to reduce the negative impact of multiple late changes and to move toward achieving both product and process excellence.
References
1. Adler, P. S., "Interdepartmental Interdependence and Coordination: The Case of the Design/Manufacturing Interface," Organization Science 6, 1995, 147 - 167
2. Adler, P. S., A. Mandelbaum, V. Nguyen, and E. Schwerer. "From Project to
Process Management: An Empirically Based Framework for Analyzing Product Development Time," Management Science 41, 1995, 458 - 484
3. Adler, P. S., A. Mandelbaum, V. Nguyen, and E. Schwerer. "Getting the Most
Out of Your Product Development Process," Harvard Business Review, March -April 1996, 134 - 152
4. Blackburn, J.D., "Time Based Competition: White Collar Activities," Business
Horizon, July-August 1992
5. Clark, K.B. and T. Fujimoto, Product Development Performance: Strategy,
Organization and Management in the World Auto Industry, Harvard Business
School Press, 1991, Cambridge.
6. Cusumano, M. A., and R. W. Selby, Microsoft Secrets: How the World's Most
Powerful Software Company Creates Technologies, Shapes Markets, and Manages People, New York: The Free Press, 1995
7. Eastman, R. M., "Engineering Information Release Prior to Final Design Freeze,"
IEEE Transactions on Engineering Management EM-27, 1980, 37 - 41
8. Ettlie, J. E., and H. W. Stoll, Managing the Design-Manufacturing Process,
New York: McGraw Hill, 1990
9. Fujimoto, T., "Frontloading and Cooperative Engineering," presentation at the BMW Engineering Center, Munich, December 1996
10. Gulati, R. K., and S. D. Eppinger, "The Coupling of Product Architecture and Organizational Structure Decisions," MIT Working Paper 3906, 1996
11. Harris, F. W., "How many Parts to Make at once?", Factory.. The Magazine of
Management 10(2), 1913, 135-152
12. Hartley, J. R., Concurrent Engineering, Productivity Press, 1992
13. Hauptman, 0., and K. K. Hirji, "The Influence of Process Concurrency on Project Outcomes in Product Development: An Empirical Study With Cross-Functional Teams," IEEE Transactions in Engineering Management 43, 1996,
153 - 164
14. Krishnan, Viswanathan, "Managing the Simultaneous Execution of Coupled Phases in Concurrent Product Development," IEEE Transactions on Engineering Management, Vol. 43, No. 2, May, 1996
15. Lincke, W., Simultaneous Engineering, Hanser, 1995
16. Loch, Christoph H., Christian Terwiesch, "Communication and Uncertainty in Concurrent Engineering," INSEAD Working Paper, 1997, forthcoming in
Management Science
17. Sabbagh, K., Twenty-First Century Jet, New York: Scribner 1996
18. Smith, R. P., and S. D, Eppinger, "Identifying Controlling Features of Engineering Design Iteration," Management Science 43, 1997, 276 - 293
19. Soderberg, L. G., "Facing up to the Engineering Gap," McKinsey Quarterly, Spring 1989
20. Susman, G. I., Integrating Design and Manufacturing for Competitive Advantage,
Oxford: Oxford University Press, 1992
21. Terwiesch, Christian, Time and Information Problems in Overlapping
Development Activities, INSEAD Dissertation, 1997
22. Terwiesch, C., C. H. Loch, and M. Niederkofler, "Managing Uncertainty in Concurrent Engineering", Proceedings of the 3rd EIASM International Product
Development Conference, 1996, 693 - 706
23. Thomke, S. H., "Managing Experimentation in the Design of New Products and Processes," Harvard Business School Working Paper 96-037, 1996
24. Ulrich, K., "The Role of Product Architecture in the Manufacturing Firm,"
Research Policy 24, 1995, 419 - 440
25. Wheelwright, S.C, and K.B. Clark, Revolutionizing Product Development, New
York: The Free Press, 1992.
26. Wolff, Ronald W., Stochastic Modeling and the Theory of Queues, Prentice Hall,
Appendix
To estimate the benefits of the improvements discussed in the Section on queueing, consider the following simplified example. ECO arrival rates and average processing times m at each station are shown in Figure A-1. All SCVs are assumed to be 1, and each engineer works 40 hours per week.
Figure A-1: Numerical example of improvement strategies
CCS and simulation engineers are dedicated to this ECO process. The accounting and purchasing specialists have other responsibilities also, but give priority to this process, so their effective utilizations and throughput times can be calculated without regard to other work. The project manager has many responsibilities and decides on ECOs once a week, during the weekly project meeting. The resulting (effective) utilizations and throughput times (estimated from the PK formula) are shown in Table A-1.3
Station CCS Simulation Finance Project
Manager Purchasing Utilization, in % 47.5 95 36 8 36 TPT (average throughput time), in hours 2.6* 40 1.6 20** 1.6 Total TPT, in hours 64.2***
* This TPT is simulated, since no analytical expression is available for a multi-server station (2 engineers serving the same stream of ECOs).
** The project manager decides on ECOs once per week, so on average, an ECO is pending half a week
*** The sum of all TPTs except the time for the cost analysis, which runs in parallel to and is dominated by the TPT for the project manager's decision.
Table A-1: Utilizations and average throughput times
Flexible capacity. If the simulation engineer is capable of providing two extra hours
of work whenever needed, the effective utilization is reduced to 38/42 = 90.5%. From
the PK formula, we can estimate the resulting TPT as 21 hours, a reduction of 48%
3 In this example, the stations are analyzed as if they were isolated from one another. This is exact when the SCVs are equal to 1, and it provides a reasonable approximation for more general cases.
for this process step and of 28% overall. This reduction shows how big the through-put time (TPT) improvement is from a small reduction in utilization when the engineer has a heavy workload.
Merging Groups. We replace the accounting analyst, purchaser and project manager
with one dedicated "ECO manager" who analyses and approves ECOs on an ongoing basis (not only at the weekly meeting). If we assume that by analyzing the ECO, the manager does not need the extra 10 minutes for making an approval decision, the workload of this manager per ECO is 0.75 + 0.75 = 1.5 hours, for a total utilization of 71.25%. From the PK formula, we get a TPT for this combined part of the process of 3.5 hours, a reduction of 84% for this part of the process and 28% overall.
Offloading the Bottleneck. As explained in the text, 30% of the simulation time for
an ECO consists of file preparation that could equally be performed by the CCS engineers. If these 0.6 hours per ECO on average are shifted to CCS, the utilizations are balanced at 61.6% for CCS engineering and 66.5% for simulation. The resulting TPTs can be estimated at 6 hours for CCS (via simulation) and 4.2 hours for the simulation engineer (from the PK formula). The total of 10.2 hours represents a 77% reduction for this part of the process and 52% overall.