Climate Variability and Change, Smallholder Farmer Decision Making, and Food Security in North-west Ghana
Thesis submitted for the degree of Doctor of Philosophy
School of Agriculture, Policy, and Development University of Reading George Dakurah October 2018
ii Declaration of Original authorship
I duly confirm that this is my own work and the use of all material from other sources has been properly and fully acknowledged.
………. George Dakurah
Dedication
iv Acknowledgements
Thank you
I will first of all thank God, the Father Almighty; the creator of the universe for all His unmerited grace and mercies throughout my studies at the PhD level. Without Him, the ‘journey’ would not have been possible.
I also want to acknowledge all the selfless efforts my supervisors: Dr Henny Osbahr and Dr Alex Arnall made towards the completion of this PhD. I am particularly thankful for the constructive feedback, the short courses and articles that they recommended to make this PhD come to a successful completion. I will also want to thank Professor Roger Stern and Dr David Stern (both formerly of the Reading Statistical Services Centre) for all their support in guiding me to analyse meteorological data for my thesis.
This PhD would not have been possible without the Commonwealth Scholarships Commission (CSC-UK) awarding the researcher a scholarship to study. Thank you CSC for financing my studies. I wish to also thank the University of Reading Financial Hardship Team and the Leche Trust Charity for supporting me with some maintenance grants after my scholarship run out in the 3rd year- God bless you all.
I wish to also thank the Former District Chief Executive of the then Jirapa District; Hon Cletus Dapilah, the Presiding Member, Hon Helen Zaato, and the Assembly members of Baazu, Tizza Boi, the Doggoh and Tie electoral areas and the then Director of the Ministry of Food and Agriculture for all the support during my fieldwork in the then Jirapa District.
I am highly indebted to the chiefs, elders and people of the Doggoh and Tie villages for the warm reception throughout my fieldwork period in your villages. Thank you for all the food and the time to respond to my fieldwork questions. I particularly want to thank Francis Belingtaa of Doggoh, and David Tuozie of Tie for your work as village lead persons. Thank you for taking me around your villages.
I cannot forget about the young and energetic research assistants that helped in the data collection. Thank you Conrad Soyen, Fred Ayambire, Priscilla Toboyee, Michael Lang-uu, Stanley To-ang, George Nayas, Justice Dinaah, Sylvester Languang, Francis, Isaac Bafuuroh and Robert Kuuzuing. I am particularly grateful to Fred who had to pick me around on a motorbike after I had an accident and fractured my arm.
For my Landlord, DSP Johnbosco, I am grateful for your kind gestures towards me via offering me a house to live in Babile and undertake my fieldwork. I wish to also acknowledge all the wonderful people of Babile and Wuling particularly the chief of Wuling for the warm reception and accepting me as one of you.
At the end of it all, my family members have been my strongest backbone throughout the PhD study period. I particularly want to thank my elder brother; Peter Dakurah, Alfred Mwine and Bismarck Guba for all the support.
vi Abstract
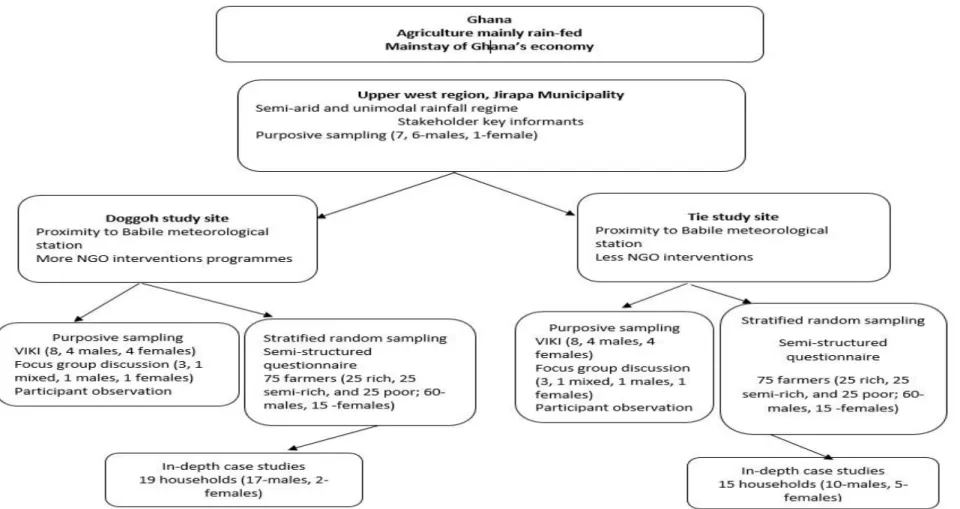
This thesis investigates smallholder farmers’ cropping decisions under climate variability and change using the villages of Doggoh and Tie of North Ghana as a case study. With rainfall projected to decrease and temperatures expected to rise, it is essential to understand the impacts of farmers’ cropping decisions under climate variability and change on the availability and utilisation of culturally preferred foods. To that end, this study had three objectives: (i) to examine farmers’ perception of climate variability and change and see how farmer perceptions match and mismatch analysis of meteorological data; understand how farmer’ perception of CVC are socially differentiated; and understand how cultural values shape farmers’ perception of CVC, (ii) to characterise farmers’ responses to CVC and understand why farmers are adapting or not adapting to CVC via crop selection, and (iii) to understand the social uses of food and the impact of farmers’ adaptation to CVC on the availability and utilisation of culturally preferred foods. The study draws on the Theory of Drought Perception, the Theory of Planned Behaviour, and the Social Identity Theory as theoretical lenses to guide the presentation of results. Situating the fieldwork in North-west Ghana, the data collection for this study lasted for ten months (spanning from January to October 2016). To that end, mixed methods involving key informant interviews, semi-structured questionnaire, focus group discussions, and household case studies were used for the data collection. This involved 150 households for the semi-structured questionnaire (75 for each research village) and 34 household case studies (19 in the village of Doggoh and 15 in the village of Tie).
The results revealed that farmers’ perceptions are not supported by the climatic data. Farmers observed a shift in the onset and cessation of rainfall from March to June and from November to October respectively. Farmers’ identified cultural factors as essential in explaining changes in their local climate. Having perceived changes in
their local climate farmers have adapted by cultivating crops and crop varieties that are better suited to the prevailing changing climate. The only exception is that a few male-headed households continue to cultivate traditional varieties of groundnuts for cultural reasons even though such varieties produce less yield. Farmers reported changing diet patterns of culturally preferred foods as a result of the non-availability and less availability of culturally preferred food crops due to responses to climate variability and change. This study highlights the critical need for policymakers to be sensitive to the cultural foods of local people in the design of adaptation measures.
viii
Table of Contents
Declaration of Original authorship ... ii
Dedication ... iii
Acknowledgements ... iv
Abstract ... vi
List of Figures ... xii
List of Tables ... xv
List of Pictures ... xvii
List of Boxes ... xviii
List of Appendices ... xix
List of Abbreviations ... xxi
GENERAL INTRODUCTION TO THE THESIS ... 1
1.1 General Background to the Study ... 1
1.2 Research Gap, and Justification for the Study ... 2
1.2.1 Research gap ... 2
1.2.2 Why is Ghana considered an appropriate setting for this study? ... 4
1.2.3 Why North-west Ghana is an appropriate setting for the study? ... 5
1.3 Research Aim, Objectives, and Questions ... 7
1.4 Statement of Personal Motivation for the Study ... 8
1.5 Definition of key terms and concepts ... 9
1.6 Outline of the Thesis ... 10
LITERATURE REVIEW AND CONCEPTUAL FRAMEWORK ... 12
2.1 Introduction ... 12
2.2 Evidence of Climate Variability and Change in Sub-Saharan Africa ... 13
2.2.1 The climate science Dimension... 13
2.2.2 Farmer perceptions of climate variability and change ... 17
2.3 Adaptation to Climate Variability and Change ... 24
2.3.1 Typologies of adaptation to climate variability and change ... 25
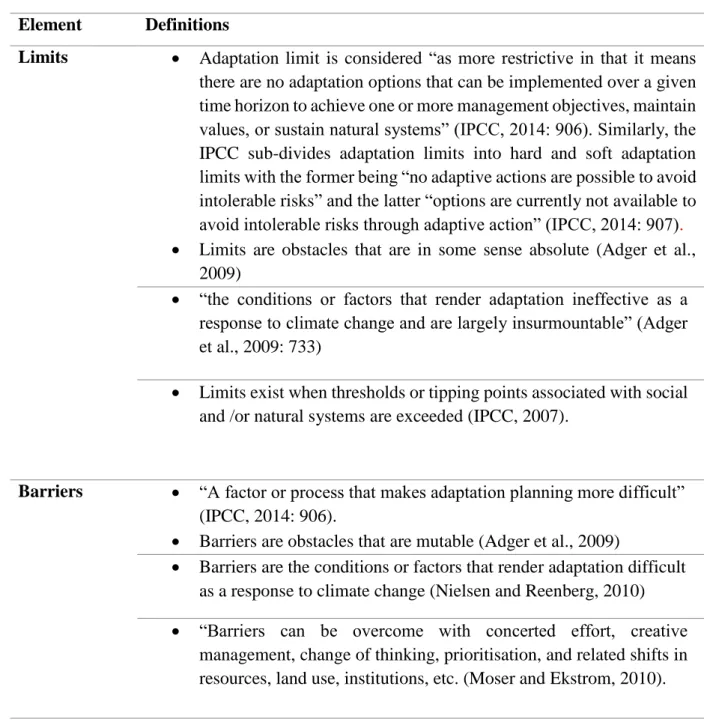
2.3.2 Typologies of the barriers, and limits to climate change adaptation ... 26
2.3.3 Farmer adaptation to climate variability and change via crop selection ... 29
2.4 Climate Variability and Change, and Food Security ... 32
2.4.1 Understanding the different perspectives on food security... 35
2.4.2 Key debates on the development of food preferences ... 38
2.5 Understanding Smallholder Farmer Decisions under Climate Variability and Change ... 43
2.5.1 Theoretical ideas on smallholder production decisions ... 43
2.6 Conceptual Framework ... 52 RESEARCH METHODOLOGY ... 56 3.1 Introduction ... 56 3.2 Research Approach ... 56 3.3 Research Design ... 58 3.3.1 Research Strategy ... 58
3.3.2 Case study: why North-west Ghana? ... 59
3.3.3 Selection of research location ... 60
3.3.4 Choice of research villages ... 68
3.3.5 Selection of respondents ... 70
3.3.6 Research tools ... 74
3.3.7 Pre-testing of research tools ... 79
3.3.8 Training of research assistants ... 79
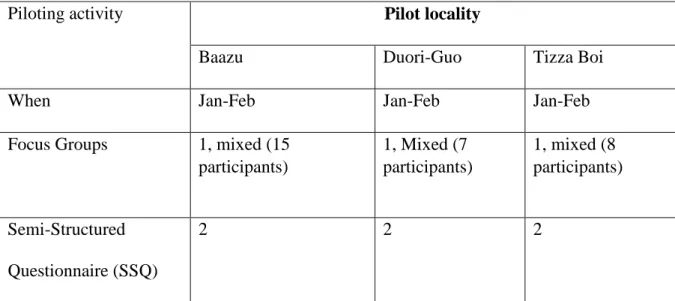
3.3.9 Reconnaissance, scoping and piloting ... 81
3.4 Access to Research Villages ... 85
3.5 Data Collection: Application of Research Tools ... 86
3.5.1 Phase I data collection: Individual village key informant interviews and participatory exercises ... 87
3.5.2 Phase II of data collection: Semi-structured questionnaire, key informant interviews with stakeholders, focus group discussions ... 95
3.5.3 Phase III of data collection: Household case studies, and participant observation ... 98
3.6 Gaining Farmers Trust ... 100
3.7 Data Analysis ... 102
3.7.1 Secondary data analysis ... 102
3.7.2 Quantitative data analysis ... 102
3.7.3 Qualitative data analysis ... 102
3.8 Research Ethics ... 105
3.9 Researcher Positionality ... 105
3.10 Challenges during Fieldwork ... 106
3.11 Conclusion ... 107
FARMER PERCEPTIONS OF CLIMATE VARIABILITY AND CHANGE ... 108
4.1 Introduction ... 108
4.2 The Evidence for Climate Variability and Change in the Scientific Data ... 109
4.2.1 Rainfall ... 110
4.2.2 Processing rainfall data ... 112
4.2.3 Temperature ... 128
4.2.4 Processing temperature data ... 129
x
4.3 Farmer Perceptions of Climatic Events ... 132
4.3.1 Farmer perceptions of rainfall ... 133
4.3.2 Farmer perceptions of temperature, and extreme climate events ... 140
4.3.3 Summary of farmer perceptions of climate ... 141
4.4 Who Perceives what about Climate Variability and Change? ... 142
4.4.1 Spatial differentiation ... 142
4.4.2 Social differentiation ... 143
4.4.3 Summary of spatial, and social differentiation of farmer perceptions of climate variability and change ... 155
4.5 Farmers’ Beliefs about Climate Variability and Change... 157
4.5.1 Cultural worldviews, values, and beliefs shaping perceptions ... 158
4.5.2 Access to climate information from experts... 163
4.5.3 Farmer past experiences, and perceptions of climate variability and change ... 172
4.5.4 Summary of the factors that shape farmers’ perceptions of climate variability and change... 176
4.6 What similarities and differences exist between farmer perceptions of CVC and analysis from meteorological data? ... 178
4.7 Discussion and Conclusion ... 179
4.7.1 Discussion ... 179
4.7.2 Conclusion ... 181
UNDERSTANDING FARMERS’ CROPPING DECISIONS UNDER CLIMATE ... 182
5.1 Introduction ... 182
5.2 Understanding cropping systems in Doggoh and Tie villages... 183
5.2.1 Current Cropping System ... 184
5.2.2 Labour dynamics and gender roles in the agricultural season ... 195
5.2.3 Dry season livelihood activities of households ... 201
5.2.4 Summary ... 212
5.3 Understanding Farmers’ Responses to Climate Variability and Change ... 214
5.3.1 Characterising farmer responses to climate variability and change ... 215
5.3.2 Farmers’ attitude, and responses to climate variability and change... 222
5.3.3 Farmers’ perceived behavioural control, and crop selection decisions ... 239
5.3.4 Social identification, and farmers’ intention to select crops under CVC ... 243
5.3.5 Summary ... 252
5. 4 Discussion and Conclusion ... 254
5.4.1 Discussion ... 254
5.4.2 Conclusion ... 256
UNDERSTANDING THE CULTURAL USES OF FOOD, AND THE IMPACTS OF ... 258
6.2 The Cultural Dimensions of Food: Tuo-zaafi as a Case Study ... 259
6.2.1 Understanding the staple foods of the Doggoh and Tie villages ... 259
6.2.2 The value of tuo-zaafi beyond nutritional and biological benefits ... 268
6.2.3 Summary ... 283
6.3 Household Food Preferences under Climate Variability and Change: Tuo-zaafi as a Case Study ... 284
6.3.1 The changing nature of tuo-zaafi consumption ... 285
6.3.2 The changing nature of preferences for tuo-zaafi ... 288
6.3.3 How are the preferences for tuo-zaafi spatially and socially differentiated? ... 291
6.3.4 Understanding the factors that shape the differential preference for tuo-zaafi ... 298
6.3.5 Summary ... 304
6.4 Discussion and conclusion ... 307
6.4.1 Discussion ... 307
6.4.2 Conclusion ... 309
CONCLUSIONS ... 310
7.1 Introduction ... 310
7.2 Main Findings ... 312
7.2.1 Understanding farmers’ perceptions of climate change and variability ... 312
7.2.2 The pattern and process of farmer crop selection and adaptation to climate variability .. 315
7.2.3 The cultural aspects of food, and the impact of adaptation to climate variability and change on culturally preferred foods ... 318
7.3 Implications of the findings on conceptualising the role of culture within understandings of crop adaptations to CVC ... 322
7.4 Implication for policy and practice ... 324
7.4.1 Objective 1 ... 324
7.4.2 Objective 2 ... 326
7.4.3 Objective 3 ... 329
7.5 Suggestions for future research ... 329
References ... 373
xii
List of Figures
Figure 1. 1 Map of Ghana showing the administrative regions ... 6
Figure 2. 1 Conceptualisation of the perceptions of drought ... 19
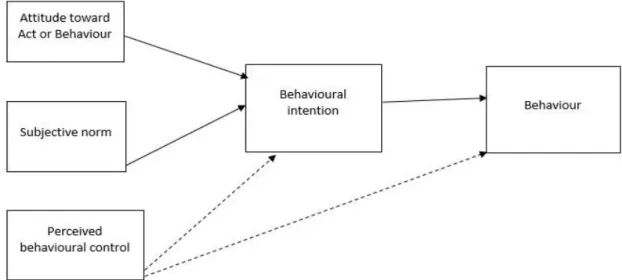
Figure 2. 2The Theory of Reasoned Action and the Theory of Planned Behaviour... 48
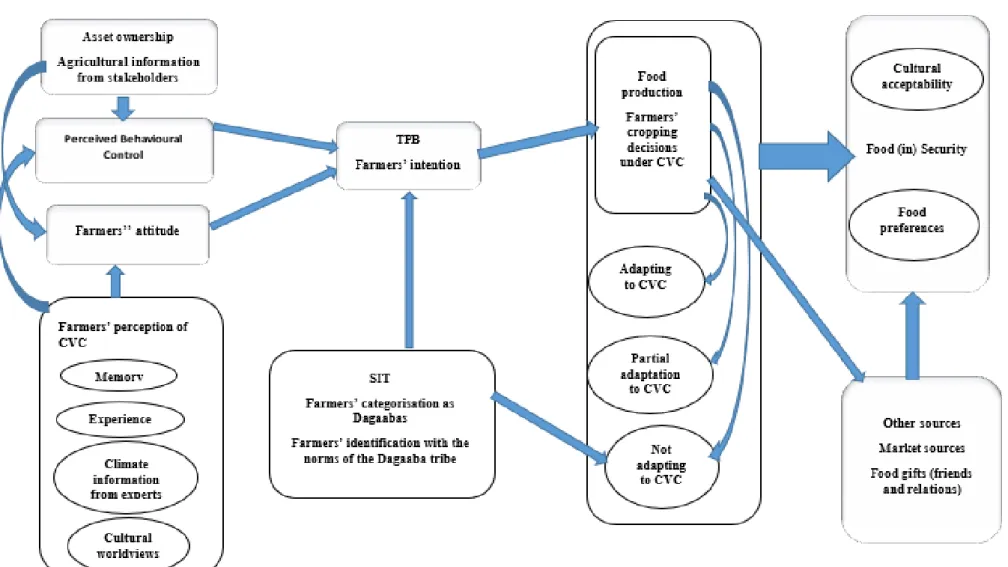
Figure 2. 3 Conceptual Framework... 55
Figure 3. 1 Map of the Upper West region showing the Jirapa Municipality ... 62
Figure 3. 2 Schematic representation of the sampling procedure ... 73
Figure 3. 3 An illustration of coding of qualitative data in Nvivo ... 104
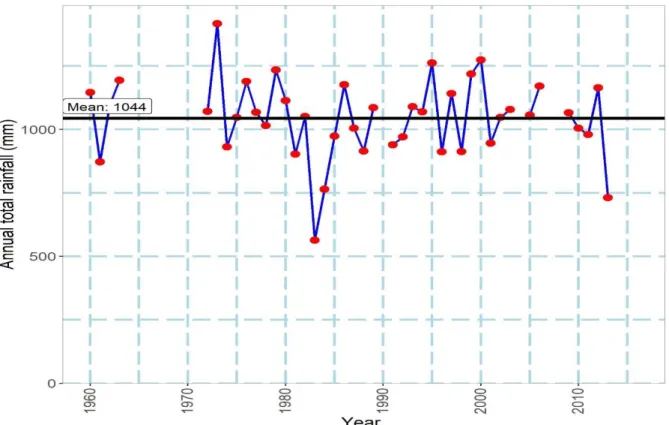
Figure 4. 1 Total annual rainfall distribution for Babile, 1960-2016. ... 113
Figure 4. 2 An illustration of the number of rainy days by year ... 114
Figure 4. 3 Monthly distribution of rainfall for Babile station (1960-2016) ... 115
Figure 4. 4 An illustration of the number of rainy days by month ... 116
Figure 4. 5 First occasion after 01st April that records more than 20mm of rainfall without factoring in dry spell conditions ... 119
Figure 4. 6 First occasion after 01st April that records more than 20mm of rainfall with no dry spell of more than 9 days in the next 30 days ... 120
Figure 4. 7 First occasion after 01st May that records more than 20mm of rainfall without factoring in dry spell conditions ... 122
Figure 4. 8 First occasion after 01st May that records more than 20mm of rainfall with the consideration of dry spell conditions ... 124
Figure 4. 9 The first occasion after the 1st of September when the water balance drops to zero ... 126
Figure 4. 11 Length of the season using effective May definition ... 128 Figure 4. 12 Distribution of monthly minimum mean temperature (1988-2014) ... 130 Figure 4. 13 Distribution of maximum monthly mean temperature (1988-2014) ... 131 Figure 4. 14 Percentage distribution of farmers’ perceptions of the onset and cessation months of rainfall in the past and now in Doggoh village (N=75) ... 135 Figure 4. 15 Percentage distribution of farmers’ perceptions of the onset and cessation months of rainfall in the past and now in Tie village (N=75) ... 137 Figure 4. 16 Percentage distribution of farmers’ perceptions of flood and drought conditions in Doggoh and Tie villages (N= 75 in each village) ... 141 Figure 4. 17 Percentage comparison of farmers’ perceptions of climate variability and change in the past and now by sex in Doggoh village (Males = 60, Females =15) ... 146 Figure 4. 18 Percentage comparison of farmers’ perceptions of climate variability and change in the past and now by age in Doggoh village (25-40 = 17, 41-65 =39, 66-95=19) ... 147 Figure 4. 19 Percentage comparison of farmers’ perceptions of climate variability and change in the past and now by wealth in Doggoh village (Poor = 25, Semi-rich =25, Rich=25) ... 148 Figure 4. 20 Percentage comparison of farmers’ perceptions of climate variability and change in the past and now by education in Doggoh village (Educated = 15, Uneducated= 60) ... 150 Figure 4. 21 Percentage comparison of farmers’ perceptions of climate variability and change in the past and now by sex in Tie village (Males = 52 Females=23) ... 151 Figure 4. 22 Percentage comparison of farmers’ perceptions of climate variability and change in the past and now by age in Tie village (25-40 = 19, 41-65 =35, 66-90=21) ... 152 Figure 4. 23 Percentage comparison of farmers’ perceptions of climate variability and change in the past and now by education in Tie village (Educated = 15, Uneducated = 60) ... 153 Figure 4. 24 Percentage comparison of farmers’ perceptions of climate variability and change in the past and now by wealth in Tie village (Poor = 25, Semi-rich =25, Rich=25) ... 155
xiv
Figure 5. 1 Percentage of households growing the main crops in Doggoh and Tie now (N = 75 in each village) ... 186 Figure 5. 2 Percentage of households that cultivate the top ranked crops in Doggoh and Tie in the past (N= 75 in each village) ... 187 Figure 5. 3 Percentage of households’ unwillingness to displace sorghum in the future in Doggoh and Tie villages (N=75 in each village) ... 249
Figure 6. 1 Percentage of respondents that reported the foods that are largely consumed for breakfast in Doggoh and Tie Villages (N=75 in each village) ... 261 Figure 6. 2 Percentage of respondents that reported the foods that are primarily consumed for lunch in Doggoh and Tie Villages (N=75 in each village) ... 262 Figure 6. 3 Percentage of respondents that reported the foods that are largely consumed for supper in Doggoh and Tie Villages (N=75 in each village) ... 263 Figure 6. 4 Percentage of respondents by top ranked foods in Doggoh and Tie villages (N=75 in each village) ... 266 Figure 6. 5 Percentage of respondents by ‘no tuo-zaafi no food’ (N =75 in each village) ... 274 Figure 6. 6 Percentage distribution of varieties of TZ regularly eaten in the past, and now in Doggoh and Tie villages (N = 75 in each village) ... 286 Figure 6. 7 Percentage of Preferred form of TZ in Doggoh and Tie villages (N= 75 in each village) ... 289 Figure 6. 8 Percentage of respondents’ preference now for the different forms of TZ by sex in Doggoh Village (Males = 60, Females = 15)... 293 Figure 6. 9 Percentage of respondents’ preference now for the different forms of TZ by age in Doggoh Village (25-40=17, 41-65 =39, 66-95 = 19) ... 294 Figure 6. 10 Percentage of respondents’ preference now for the different forms of TZ by sex in Tie Village (Males = 52, Females = 23) ... 295
Figure 6. 11 Percentage of respondents’ preference now for the different forms of TZ by age in
Tie Village (25-40 = 19, 41-65= 35, 66-90 = 21) ... 296
List of Tables Table 1. 1 An illustration of the Research Objectives and Questions... 7
Table 2. 1 Summary of the different definitions of limits and barriers to climate change adaptation ... 27
Table 2. 2 Selected definitions of food preferences ... 38
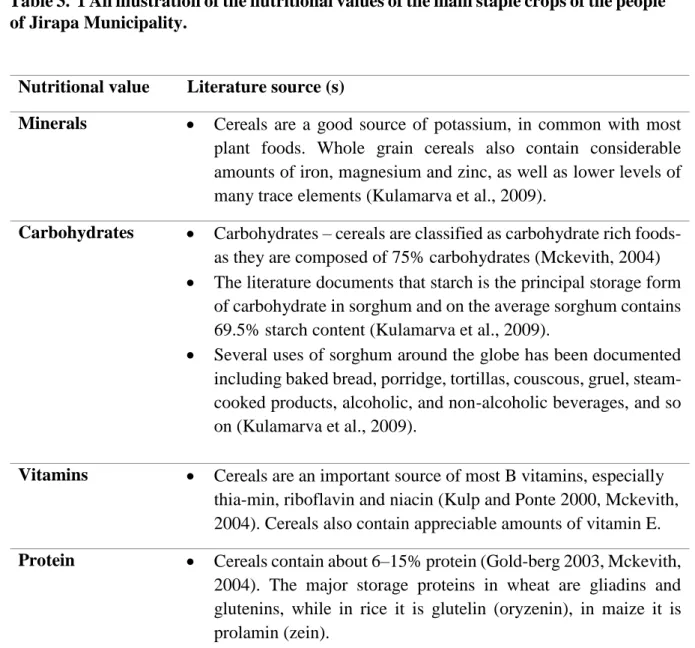
Table 3. 1 An illustration of the nutritional values of the main staple crops of the people of Jirapa Municipality. ... 67
Table 3. 2 Summary of the relationship between the research objectives, questions and research tools ... 78
Table 3. 3 Summary of piloting of research tools ... 82
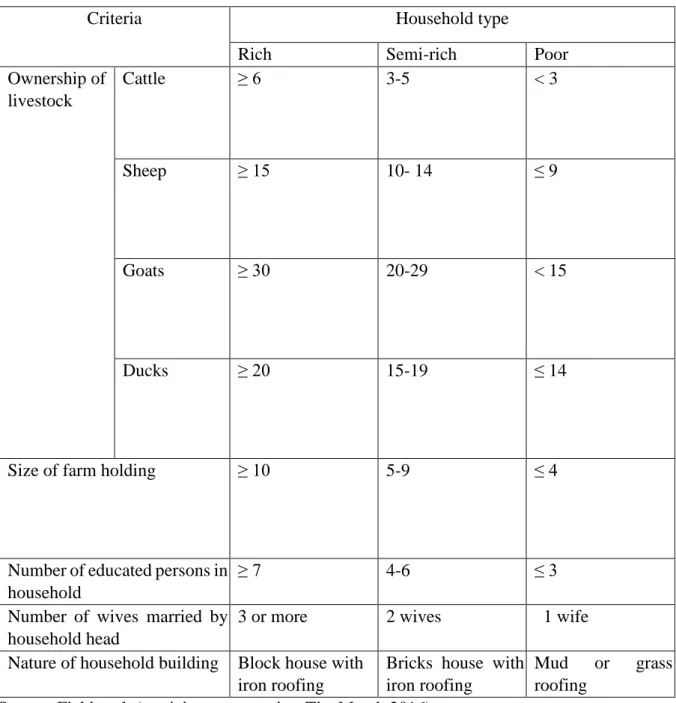
Table 3. 4 Wealth stratification by village leaders in Doggoh... 90
Table 3. 5 Wealth stratification by village leaders in Tie ... 91
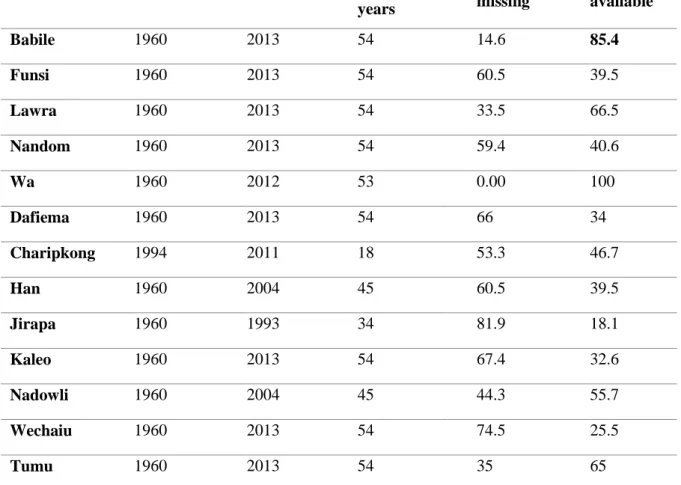
Table 4. 1 Percentage distribution of missing and available data for rainfall stations in the upper west region ... 111
Table 4. 2 Summary of rainfall data for Babile Station ... 112
Table 4. 3 Four definitions of the onset of the rainfall ... 118
Table 4. 4 Details of the date of start of the April definition of the rainy season in Babile 121 Table 4. 5 Details of the date of the May definition of the start of the rainy season in ... 124
Table 4. 6 Farmer illustrations of the onset month of rainfall in the past and now ... 136
Table 4. 7 Farmer illustrations of the onset month of rainfall in the past and now ... 138
Table 4. 8 Farmer illustrations of the cessation month of rainfall in the past and now ... 139
xvi
Table 4. 10 Summary of the social differentiation of farmer’s perceptions of climate variability and change in Doggoh ... 156 Table 4. 11 Summary of the social differentiation of farmer’s perceptions of climate variability and change in Tie ... 157 Table 4. 12 Farmer illustrations of violations of the rules of the land ... 162 Table 4. 13 Farmer illustrations of the limits and barriers to accessing climate information169 Table 4. 14 An illustration of the sources of climate information from different stakeholders ... 171 Table 4. 15 Farmer illustrations of their experiences of rainfall in the past, and now... 175 Table 4. 16 Summary of similarities and differences between farmer perceptions and analysis of climate data ... 178
Table 5. 1 Farmer illustrations of the cultivation of crops in the bush farm fields ... 189 Table 5. 2 Illustrations of farmers’ negative evaluation of cultivating bush, and riverbank farm fields ... 191 Table 5. 3 Crops cycle in an agricultural season... 193 Table 5. 4 Farmer illustrations of changes in the agricultural calendar ... 194 Table 5. 5 Sources of labour for households’ agricultural activities and gender roles in an agricultural season ... 200 Table 5. 6 Illustration of spatial differentiation of gardening activities in Doggoh and Tie .. 203 Table 5. 7 Percentage of farmers who are adapting or not adapting to CVC via the selection of groundnuts by age, sex, wealth and education in Doggoh Village (N = 75 in each category) ... 218 Table 5. 8 Percentage of farmers who are adapting or not adapting to CVC via the selection of groundnuts by age, sex, wealth and education in Tie Village (N = 75 for each category) ... 221 Table 5. 9 Spatial differentiation of the cultivation of the varieties of groundnuts ... 222
Table 5. 10 Farmer illustrations of the advantages of kyaana variety of groundnuts over
dagarasinkaa variety ... 239
Table 5. 11 An illustration of the cultural uses of sorghum ... 251
Table 6. 1 A description of the preparation of the main staples of the people of Doggoh and Tie villages ... 267
Table 6. 2 An illustration of the differences that exist among the various forms of tuo-zaafi272 Table 6. 3 Households’ illustrations of the value of TZ in nourishing social relations ... 277
Table 6. 4 Respondents’ illustrations of the medicinal value of tuo-zaafi ... 279
Table 6. 5 An illustration of the reasons why maize (w) tuo-zaafi is widely consumed by households ... 287
Table 6. 6 Illustration of the reasons why millet and sorghum forms of tuo-zaafi are not widely eaten ... 288
Table 6. 7 Summary of the preference of tuo-zaafi by social groups ... 297
List of Pictures Picture 3. 1 Research Assistants undergoing training on how to do direct matrix ranking using marbles ... 80
Picture 3. 2 An illustration of a focus group discussion during piloting ... 83
Picture 3. 3 Social map produced by village analysts in the village of Doggoh ... 88
Picture 3. 4 Participatory exercise with a village key informant in Doggoh village ... 94
Picture 3. 5 An illustration of the researcher’s involvement in farming ... 101
Picture 3. 6 An illustration of the researcher participating in farming ... 101
Picture 5. 1 Spatial differentiation of gardening activities for the Konzokalaa and Charee dams ... 204
xviii
Picture 5. 2 Illustration of the transportation of vegetable products ... 206
Picture 5. 3 Illustration of the Onion gardening by women in the Konzokalaa Dam ... 207
Picture 5. 4 Illustrations of women’s livelihood activities during the dry season ... 210
Picture 5. 5 Illustrations of men’s livelihood activities during the dry season ... 211
Picture 5. 6 Household members knocking ground to soften it to cultivate dagasinkaa ... 228
Picture 5. 7 An illustration of the threshing and winnowing of millet in the village of Doggoh ... 230
Picture 5. 8 Livestock being regulated during the farming season ... 233
Picture 5. 9 The state of millet as at the last week of September 2016 in Doggoh village .. 235
Picture 5. 10 An illustration of the varieties of sorghum ... 237
Picture 5. 11 The researcher enjoying roasted groundnuts with a household in the village of Doggoh ... 247
Picture 5. 12 Tight pieces of sorghum (kagyin) ... 250
Picture 6. 1 An illustration of a woman preserving tuo-zaafi in ko-rou in Doggoh village 271 Picture 6. 2 An illustration comparing sorghum and maize (w) TZ ... 300
List of Boxes Box 4. 1 Farmer illustrations of reduction in traditional sacrifices ... 160
Box 4. 2 Farmer illustrations of the rains being held by humans ... 163
Box 4. 3 Farmers’ illustrations of differential access to climate information... 167
Box 4. 4 Illustration of farmers’ trust for climate information from different sources ... 168
Box 5. 1 Dialogue between researcher and case study participant on the displacement of
traditional varieties of sorghum ... 224
Box 5. 2 Farmers’ illustration of millet producing poor yield under the changing climate. 226 Box 5. 3 An illustration of the non-availability of improved varieties of millet by a stakeholder ... 226
Box 5. 4 Dialogue between the researcher and participant indicating a multitude of factors that account for the displacement of traditional varieties of beans ... 232
Box 5. 5 Farmer illustrations of the displacement, and reduction of farm size of millet due to CVC ... 234
Box 5. 6 Farmer illustrations of the need to cultivate traditional varieties of crops under CVC ... 245
Box 5. 7 Farmer illustrations of their preference for soup made from dagarasinkaa ... 246
Box 6. 1 A dialogue between the researcher and a village key informant on the ritual uses of TZ ... 278
Box 6. 2 Households’ illustrations of the ease of preparation of tuo-zaafi ... 281
Box 6. 3 Farmers’ illustrations of ‘forced’ preferences for maize (w) TZ in the village of Tie ... 290
List of Appendices Appendix A: An introduction letter from the University of Reading ... 331
Appendix B: Example of an informant sheet for respondents ... 333
Appendix C: Example of village key informant interview guide ... 334
Appendix D: Semi-Structured Questionnaire for households... 336
Appendix E: Example of Stakeholder Level Key informant Interview Guide ... 345
Appendix F: Understanding crop cultivation in Doggoh and Tie using participatory budget: underlying factors that influence farmer choice of crops ... 347
xx
Appendix G : Map of Doggoh (Produced from the social mapping exercise carried out by village analysts) ... 358 Appendix H: Map of Tie (Produced from the social mapping exercise that out by village analysts) ... 359 Appendix I:Demographic characteristics of respondents (Doggoh and Tie villages) Demographic characteristics of the respondents of Doggoh village ... 360 Appendix J:A cross-tabulation of farmers’ perception of climate variability and change by sex, age, level of education and wealth in the Doggoh and Tie villages ... 362 Appendix K: An illustration of the summary of daily rainfall data for 2014 and 2015... 367 Appendix L: An illustration of the summary of daily rainfall data for 1983, 1984 and 2007 ... 369 Appendix M: Glossary of words ... 372
List of Abbreviations AM- Assembly Member
CCAFS- Climate Change, Agriculture and Food Security CFC- Canadian Feed the Children
CMIP- Coupled Model Intercomparison Project CVC – Climate Variability and Change
CVAM_ Comprehensive Vulnerability Analysis and Mapping EPA – Environmental Protection Agency
FAO- Food and Agriculture Organisation GIS- Geographic Information Systems GSS- Ghana Statistical Service GCMs- Global Circulation Models
IPCC- The Inter-Governmental Panel on Climate Change ITCZ- Inter-Tropical Convergence Zone
MCE- Municipal Chief Executive
MoFA- Ministry of Food and Agriculture MPO- Municipal Planning Officer
NGOs- Non-governmental Organisations PBC- Perceived Behavioural Control PM- Presiding member
RESULT- Resilience and Sustainable Livelihoods Transformation Programme RCP- Representative Concentration Pathway
SIT- Social Identity Theory SCT- Social Cognitive Theory SSA- Sub-Saharan Africa
xxii TDP- Theory of Drought Perception
TPB- Theory of Planned Behaviour TRA-n Theory of Reasoned Action
USAID- The United States Agency for International Development USDA- United States Department of Agriculture
WFP- World Food Programme
CHAPTER ONE
GENERAL INTRODUCTION TO THE THESIS 1 GENERAL INTRODUCTION TO THE THESIS
1.1 General Background to the Study
Climate variability and change (CVC) are among the major threats to the world in the 21st century (IPCC, 2014). No sector of the global economy is devoid of the impacts of CVC. Agronomic related studies suggest that, agriculture is the sector most affected, and will be highly affected as compared with other sectors (Ericksen et al., 2011, Lobell et al., 2008, Thornton et al., 2011). Literature suggests 90% of the world’s staple food comes from rain-fed areas, which constitute 1.233 billion ha (82%) of the global cropland of 1.5 billion ha (FAO, 2005). This suggests that areas where agricultural activities rely entirely on rainfall will be the most affected by CVC.
Literature on vulnerability to CVC impacts suggest that different parts of the globe experience CVC impacts differently. Sub-Saharan Africa (SSA) has been documented as the most vulnerable to climatic perturbations (IPCC, 2014).First, a greater proportion of the region’s population is dependent on natural resource-based livelihoods, which are highly sensitive to climate variability (Osbahr et al., 2008, Wlokas, 2008). For example, it is reported that 93% of the cultivated land in SSA is rain-fed (FAO, 2002). Rainfall variability is a particular problem for areas that experience uni-modal rainfall regimes with limited or no irrigation schemes to support farming activities during periods when there is no rainfall. Second, literature reveals that countries in SSA have limited capacity or technology to cope with the impacts (Gregory et al., 2005). Third, high vulnerability of SSA is exacerbated by poverty, social and economic processes, including conflicts (Gregory et al., 2005).
2
In terms of the impacts of CVC on crops, the 2014 IPCC report suggests that cereal based crops are the most vulnerable particularly in SSA due to increasing temperatures, and a reduction in rainfall is projected (IPCC, 2007). This implies that countries, communities, and individuals that rely on cereal-based crops for their food needs will be the ones that would be the most affected.
1.2 Research Gap, and Justification for the Study 1.2.1 Research gap
This study argues that although the nexus between climate variability and change is not a new phenomenon, little is being understood about certain aspects of the discourse. To that end, this research identified three gaps in an attempt to contribute to knowledge on farmers’ cropping decisions under climate variability and change, and the implications on households’ culturally preferred foods.
To begin with, even though the discourse on farmers’ perceptions of CVC has gained wide attention (Codjoe and Owusu, 2011, Osbahr et al., 2011, Thomas et al., 2007, Yaro, 2013) the focus has mainly been to only look at farmers’ perceptions without comparing with climatic data (Asante et al., 2017, Derkyi et al., 2018, Elum et al., 2017, Kolleh and Jones, 2015). Looking at only farmers’ perceptions makes it difficult for policy makers to reflect on the different factors that drive perceptions. Recognising the value of identifying matches and mismatches, the methodology has shifted though limited in Ghana to comparing farmer perceptions with climatic data (Amadou et al., 2015, Osbahr et al., 2011, Thomas et al., 2007, Yaro, 2013), and recently to understanding how farmers’ perception of CVC are socially differentiated (Horsefield, 2016, Singh et al., 2018). Despite the above attempts, there is still a gap in understanding how farmers’ interpretations of changes in their local climate are constructed by cultural beliefs and values as the focus is mainly centred on identifying
what changes are perceived by farmers. The literature suggests a strong connection between farmers’ perceptions of, and adaptation to CVC (Arbuckle et al., 2013, Menapace et al., 2015). Therefore, it is vital to understand how farmers perceive changes in their local climate as that will serve as a springboard to understanding adaptation decisions in chapter 51.
Similarly, on the dimension of the connection between climate variability and change, and crop selection or switching, the literature documents that few empirical studies have been conducted globally (Issahaku and Maharjan, 2014, Kurukulasuriya and Mendelsohn, 2007, Seo and Mendelsohn, 2008, Wineman and Crawford, 2014). Generally, findings from the above studies suggest that farmers will switch their crops, by cultivating crops that are more appropriately suited to the new climate. For example, in exploring the crop substitution behaviour among food crop farmers under climate change in Ghana using quantitative techniques, Issahaku and Maharjan (2014) report that farmers will allocate more land for the cultivation of sorghum, cassava, maize and rice, and less land for the cultivation of yam because findings from their study project that the yields of sorghum, cassava, maize and rice will increase and that of yam will decrease. This study however challenges this line of thinking with the argument being that farmers have multiple motives for selecting crops and adaptation to CVC could potentially lead to trade-offs between other uses of crops. Therefore, farmers may not adapt to CVC for some cultural reasons (Adger et al., 2009).
Additionally, studies on the food utilisation dimension of food security have largely concentrated on the nutritional and biological dimensions, with little attention paid to the cultural aspects of the uses of food (Treffrey et al., 2014). Interestingly, the literature suggests that attempts to understand the development of food preferences have assumed that food is always available and people can choose one food over another.
4 This study however contends that the availability and utilisation of culturally preferred foods especially for people who live in rain-fed areas and in particular the poor are mainly shaped by climatic factors. There has been some recent documentation in the literature about the role of food preference in shaping food accessibility and crop production. For example, Noack and Pouw (2014)report ugali as a “real food” and the absence of it means no food in Kenya. This translates into people forgoing access to, or cultivation of other crops in favour of cultivation of maize and cassava to process ugali. Contrary to farmers not adapting in the context of Noack and Pouw, to preserve their culturally preferred foods, it is also important to acknowledge that the opposite could take place. Specifically, farmer adaptation via crop selection could potentially translate into the compromise of their culturally preferred foods if they grow other crops that are better suited to the prevailing changes which are not their cultural food crops. To address food security holistically, it is important to understand the cultural uses of food as food may be consumed for reasons beyond physiological, and nutritional benefits. Similarly, this study seeks to contribute to our understanding of how adaptation to CVC impacts on the availability and utilisation of culturally preferred foods. 1.2.2 Why is Ghana considered an appropriate setting for this study?
Ghana is an appropriate setting to examine the nexus between climate variability and change (CVC) and food security because the economy is predominantly agrarian. It is documented that agriculture contributes significantly in terms of raw materials for industry, foreign exchange earnings for the country (MoFA, 2011) contributing to over 60% of Ghana’s livelihoods (Al-Hassan and Diaox, 2007). Despite all the tremendous contribution to national growth and development, this sector of the country is largely rain fed making it susceptible to CVC (Adjei-Nsiah, 2012). Out of a total agricultural land area of 13,628,179 hectares, 57.6% is under cultivation with only 0.2% of that being under irrigation (MoFA, 2011).
Climate associated extremes such as droughts and floods pose many challenges to agricultural activities in Ghana particularly in the northern belt which has one farming season due to the uni-modal nature of rainfall that characterises the area. Ghana has ten (10) administrative regions with Northern region, Upper West, and Upper East regions constituting northern Ghana. The rest of the regions constitute southern Ghana, which experience a bi-modal rainfall regime providing the opportunity for two cropping seasons (MoFA, 2011)2.
1.2.3 Why North-west Ghana is an appropriate setting for the study?
The North-west Ghana has been chosen as an appropriate site for research into smallholder farmer decisions under climate variability and change, and the impacts on culturally appropriate foods because of the following. First, climatic factors (as in the area being semi-arid and a unimodal rainfall zone; variable and unpredictable in nature with the situation exacerbated by climate extremes such as drought and floods). Second, a large proportion of the population is engaged in agriculture, as there are limited income generating opportunities for inhabitants to diversify their livelihoods (GSS, 2014). Third, poverty is very high in the area, which translates into low economic power to secure appropriate technologies for farm activities and access to food via market sources (GSS, 2014)3.
2 See Figure 1.1 for the map of Ghana showing the ten administrative regions and the division into northern and southern Ghana
3 See chapter 3 ( section 3.3.2) for a detailed discussion of the justification of North-west Ghana for this research
6 Figure 1. 1 Map of Ghana showing the administrative regions
1.3 Research Aim, Objectives, and Questions
The main aim of the research is to understand the impacts of adaptation to climate variability and change on the availability and utilisation of culturally preferred foods. There are three objectives and the corresponding research questions as tabulated below.
Table 1. 1 An illustration of the Research Objectives and Questions.
Research Objectives Research Questions Objective 1: To
understand farmer perceptions of climate variability and change, and how perception is socially differentiated
1. 2. 3. 4.
What are farmers’ general perception of climate variability and change?
Are there any perception differentials among farmer groups?
What shape farmers’ perceptions of CVC?
What matches and mismatches exist between farmer perceptions, and analyses from meteorological data? Objective 2: To
understand farmers’ adaptation behaviour under climate variability and change via crop selection.
1. 2. 3. 4.
What crops are selected, where, and when in the agricultural cycle?
How have the cropping systems changed now, as compared to that of the past?
Who are adapting, and who are not adapting?
Why do farmers adjust, or not adjust their crops under climate variability and change?
Objective 3: To understand the social aspects of the uses of food, and the impacts of
adaptation to CVC on culturally preferred foods
1. 2. 3. 4.
What is the value of tuo-zaafi4 beyond biological and nutritional uses?
Who eats first, why, and with whom?
How has the pattern of consumption of tuo-zaafi changed now, as compared to that of the past? Are the forms of tuo-zaafi available now what
households prefer to eat? Why, or why not? 5. How the preference for tuo-zaafi is socially
differentiated?
4 The focus of chapter 6 is largely on tuo-zaafi (the main staple food of north-west Ghana – GSS, 2014). The details of tuo-zaafi are discussed in section 6.2.2 (Chapter 6).
8
1.4 Statement of Personal Motivation for the Study
The researcher’s motivation for the Doctor of Philosophy Degree (PhD) with a focus on the nexus between climate variability and change, and food security was driven by the following factors: First, having lived the greater part of his life in rural-north west Ghana, the researcher has been a witness to the impacts of climate variability and change. The impacts manifested include farmers getting less yield and the energetic youth undertaking seasonal migration to the southern part of Ghana during the long dry season. However, the researcher did not have much understanding of the changes associated with the climate, the impacts, and the decisions that farmers are making in responses to the changing climate.
Therefore, at the Master’s level at King’s College London, the researcher’s dissertation was focused on rainfall variability in North-west Ghana. Even though his fieldwork was briefly for a month in rural North-west Ghana, the findings suggested climate variability was a challenge to farmers’ activities. To that end, the researcher was motivated to further understand the cropping decisions that farmers in North-west Ghana will make under climate variability and change. The researcher was particularly interested in whether farmers would persist in cultivating low yielding cultural crops in a quest to procure cultural foods, or farmers will displace cultural food crops if they are not suitable to the prevailing changing climate hence trade-off the availability and utilisation of culturally preferred foods.
1.5 Definition of key terms and concepts
This section clarifies the meaning of key terms and concepts as used in this thesis. These include: climate change, climate variability, adaptation, and food security. The details of each are defined below:
Climate change
“Climate change refers to a change in the state of the climate that can be identified (e.g., using statistical tests) by changes in the mean and/or the variability of its properties and that persists for an extended period, typically decades or longer” (IPCC, 2014:120).
Climate variability
Climate variability “refers to variations in the mean state and other statistics (such as standard deviations, the occurrence of extremes, etc.) of the climate on all spatial and temporal scales beyond that of individual weather events” (IPCC, 2014:121).
Adaptation is defined “as the process of adjustment to actual or expected and it effects in order to lessen or avoid harm or exploit beneficial opportunities” (IPCC, 2014: 76).
Maladaptation “refers to actions, or inaction that may lead to increased risk of adverse climate-related outcomes, increased vulnerability to climate change, or diminished welfare, now or in the future” (IPCC, 2014: 857).
Food security: there are diverse definitions of food security over the years. In the context of this study, the researcher adopts the FAO (2002) definition as a “situation that exists when all people, at all times, have physical, social and economic access to sufficient, safe and nutritious food that meets their dietary needs and food preferences for an active and healthy life.”
10 1.6 Outline of the Thesis
Chapter 1 has introduced the study, highlighted the research gap, and explained why North-west Ghana was the focus of the case study. The research aim, objectives, and associated questions have also been outlined in chapter 1.
Chapter 2 reviews the conceptual debates around perceptions of climate variability and change; adaptation, and limits to adaptation, the cultural dimensions of food, and food preferences. These concepts are used to guide the focus of the study. The chapter also reviews empirical studies, which are related to the major themes of this study. The review was very useful in identifying the gaps of this study.
The research methodology is presented chapter 3 of the thesis. The scope is to detail the research approach, the research design, and the justification of the need to blend qualitative and quantitative research methods in understanding farmer decisions under climate variability and change, and the impacts on culturally preferred foods.
The chapter also justifies the choice of the research villages, the sampling procedure, the research methods and tools used in the data elicitation. The chapter concludes on a discussion on the data analysis process, and the identification of research challenges.
The results of the thesis are presented in chapters 4, 5, and 6 according to the objectives detailed in table 1.1. The associated implications of the findings are discussed as well in each of the three chapters. Specifically, chapter 4 deals with farmer perceptions of climate variability and change (CVC). As justified earlier, it is important to understand this to see how that translates into farmers adapting, or not adapting to CVC in chapter 5. Here, four things are the focus: (i) the general idea of farmer perceptions of CVC, (ii) how perception of CVC is socially differentiated, (ii) the factors that shape farmer perceptions particularly cultural worldviews and values, and (iii) identify the matches and mismatches between farmer perceptions and analyses from climatic data.
For chapter 5, the key issues are to understand: (i) how the cropping system has changed now, as compared to that of the past, (ii) who adapts to CVC, and who does not, and (iii) what factors influence farmers to adapt or not to adapt to CVC.
Then, in chapter 6, the focus is to present results on the cultural aspects of food, and how farmer adaptation to climate variability and change has influenced households’ access to and consumption of culturally preferred foods. It also looks at how other factors contribute to differential preference for food among the social groups.
Chapter 7 is the conclusion chapter, which summarises all the three results chapters bringing together how farmer perceptions of CVC leads to adaptation via crop selection and how that has translated into affecting the culturally preferred food needs of the households of the villages of Doggoh and Tie. The chapter also discusses the theoretical, and policy implications of the findings of the research. Furthermore, the chapter discusses the implications for future research and policy.
12 CHAPTER TWO
LITERATURE REVIEW AND CONCEPTUAL FRAMEWORK 2 Literature Review and Conceptual Framework
2.1 Introduction
The objective of this literature review chapter is to discuss what is known theoretically and empirically about climate variability and change (CVC), smallholder farmer decision making, and food security, with particular reflection on the cultural dimensions of food and food preferences. The review seeks to highlight the research gaps that frame this topic, helping to refine the research objectives and organise the concepts that will shape the research design. The review covers four debates around this central topic. Section 2.2 summarises the evidence for climate variability and change in Sub-Saharan Africa (SSA), recognising both the climate science and local perception. Next, the literature on adaptation to climate variability and change is explored, with typologies of adaptation and typologies of the limits to climate change outlined in section 2.3. Section 2.4 then seeks to examine the relationship between climate variability and change and food security in Sub-Saharan Africa. Here the focus is to discuss how understandings of food security have evolved. Section 2.5 then considers the key debates on smallholder farmer decision making. Based on the ideas that emerge through the literature review, in section 2.6, a conceptual framework for the thesis is developed to organise the ideas and linkages.
2.2 Evidence of Climate Variability and Change in Sub-Saharan Africa 2.2.1 The climate science Dimension
Changes in temperature
Temperature across the African continent is projected to rise far faster than the global increase during the 21st century (Christensen et al., 2007, IPCC, 2007, James and Washington, 2013, Joshi et al., 2011, Sanderson et al., 2011). Temperature projections over West Africa for the end of the 21st century, from both the CMIP3 GCMs (SRES A2 and A1B Scenarios) and CMIP5 GCMs (RCP4.5 and RCP8.5), range between 3oC and 6oC above the late 20th century baseline (Diallo et al., 2012, Fountaine et al.,2011, IPCC 2014, Meehl et al., 2007, Monerie et., 2012).
For Sub-Saharan Africa (SSA), several observations about temperature have been reported. The Inter-Governmental Panel on Climate Change (IPCC) reported that near-surface temperature over West Africa and the Sahel has increased over the last 50 years (IPCC, 20014). Similarly, New et al., (2006) showed that the numbers of cold days and nights have decreased, and the numbers of warm days and nights have increased between 1961 and 2000. Collins (2011) produced statistically significant evidence of warming of between 0.5oc and 0.8oc between 1970 and 2010 over Africa using remotely-sensed data. In the case of Ghana, it has been reported that the country has experienced a 1oc rise in temperature over the last three decades (EPA, 2000). Minia (2004) used climate scenarios to report that mean daily temperatures will increase from between 2.5 and 3.2o C in Ghana.
14 Rainfall
There is uncertainty about rainfall projections for Africa (Rowell, 2012, IPCC, 2014) and projected change over SSA for the mid and late 21st century remains unclear. In regions of high or complex topography, such as the Ethiopian Highlands, downscaled projections indicate likely increases in rainfall and extreme rainfall by the end of the 21st century (IPCC, 2014).
By contrast, annual precipitation in SSA, and especially across West Africa and the Sahel, is reported to be declining (Hulme et al., 2001, Nicholsen, 2001). For example, Nicholsen (2001) reports that in the semi-arid and sub-humid zones of West Africa, rainfall during the last 30 years (1968-1997) has been on average 15-40% lower than during the period 1931-1960. The main reason for this uncertainty in rainfall projections is that most areas of the African continent lack sufficient observational data to draw reliable conclusions about the trends in annual precipitation over the past century (IPCC, 2014).
In the instance of Ghana, the United States Agency for International Development (USAID) reported that although Global Circulation Models (GCMs) agree generally that mean temperature will rise, there is limited agreement on future precipitation amounts and implications for seasonality, and some GCMs project increased precipitation in the northern three regions of Ghana while others project decreases (USDA, 2011).
Minia (2008) reports that for most eco-climatic zones in Ghana, the five-year moving averages shows a downward trend for total annual precipitation between 1961 and 2000. Over this period, mean decreases occurred in the Guinea Savanna zone (-120 mm decrease), Deciduous Forest Zone (-240mm decrease), and the Rain Forest zone (-750mm). Similarly, the Environmental Protection Agency of Ghana has reported a 20% reduction in rainfall since the 1960s (EPA, 2000).
Besides scenarios on rainfall and temperature change, climate models for the region project changes in intra-seasonal climate characteristics, including the duration of rainfall and onset of rainfall. For example, Thornton et al. (2011) reports that countries in Africa are likely to experience a reduction in the length of seasons. According to Christensen et al. (2007), extremely wet seasons, high-intensity rainfall events and associated flooding in West Africa are expected to increase by 20% over the next few decades.
Burke et al., (2006) predict that meteorological droughts, culminating from insufficient rainfall, are expected to increase in duration, frequency, and intensity. In the context of Ghana, Jung and Kunstmann (2007) suggest that between 2030 and 2039 the rainy season might only start in June and even later in northern Ghana.
The above projections of climate variability and change impacts could have negative implications on agriculture and rural livelihoods in northern Ghana through, for example, a reduction in rainfall in a region already experience variable uni-modal rainfall and with limited irrigation infrastructure (MoFA, 2011). Out of a total agricultural land area of 13,628,179 hectares, 57.6% is under cultivation, with only 0.2% of that under irrigation (MoFA, 2011). Similarly, climate extreme events have been observed in Ghana. Codjoe and Owusu (2011) reported that Ghana experienced the most severe drought condition in recent memory during the 1983-84 farming season. In a study on the Comprehensive Vulnerability Analysis and Mapping (CVAM) in northern Ghana, the World Food Programme reported that the 2011 growing season was characterised by mixed agro-meteorological conditions from May to July, with long dry spells hampering crop germination and development, resulting in the wilting of staple crops. Consequently, grain filling of late maturing crops was affected and lead to a deficit in grain production (WFP, 2013).
16 Reduction in water flow also leads to a reduction in soil moisture for crops, increased evaporation, and evapotranspiration that shortens the length of the growing season. This has serious implication for agricultural productivity across northern Ghana.
Coupled with extreme climate conditions, such as drought and floods, this trend could exacerbate the risk of crop failure and lead to national food insecurity. This has dire consequences on those family farms that rely largely on rain-fed agriculture for their food and livelihood. This is real concern because globally, areas where maize, rice, sorghum, soya bean and wheat are grown have seen an increase in the percentage of area affected by drought since the 1960s - from approximately 5-10% to 12-25% (Li and Yan, 2009). Drought and water scarcity are not the only components of extreme weather conditions that pose threats to livelihoods. According to Christensen et al. (2007),extreme wet seasons and high-intensity rainfall events are expected to increase by 20% over the next few decades. Such conditions will be detrimental to farming activities particularly through loss of crops and potential increases in pests and diseases (Christensen et al., 2007).
Climate variability, change, and climate extreme events are known to be influenced by multiple factors. For example, during El-Nino years sea-surface temperatures lead to feedbacks between the land and the atmosphere causing increased rainfall variability (Nicholsen, 2001).Similarly, van der Geest (2004)reports that in SSA, the length of the rainy season decreases from the south to the north, caused by the annual north-south shift of the Inter-Tropical Convergence Zone (ITCZ). This is a transition zone where continental air mass and moist tropical air converge. According to Kemp et al. (1994), drought in West Africa is associated with the failure of the ITCZ to penetrate northward as far as usual. Although cannot be generalised to the whole sub-region because drought itself varies spatially and temporally within Africa.
2.2.2 Farmer perceptions of climate variability and change
Having highlighted the evidence of a changing climate in northern Ghana and the impacts on crops and food security, this section goes on to explore farmers’ perceptions of these changes. In particular, the section reviews the theoretical ideas that explain farmers’ perceptions of climate variability and change, and insights from empirical studies.
This is important because a clear understanding of local perceptions enables the study to identify useful theoretical lenses for the presentation of the results for the first research objective (to understand farmer perceptions of climate variability and change), and identify gaps in the discourse about farmer perceptions of CVC to contribute to existing knowledge about local perceptions of CVC.
Defining perceptions
The study adopts a definition by Taylor et al. (1988) of perception, which has been widely used within Geography and social sciences. In this definition, perception is explained as “a range of judgements, beliefs, and attitudes” (Taylor et al., 1988: 152).
Key ideas explaining farmer perceptions of climate variability and change
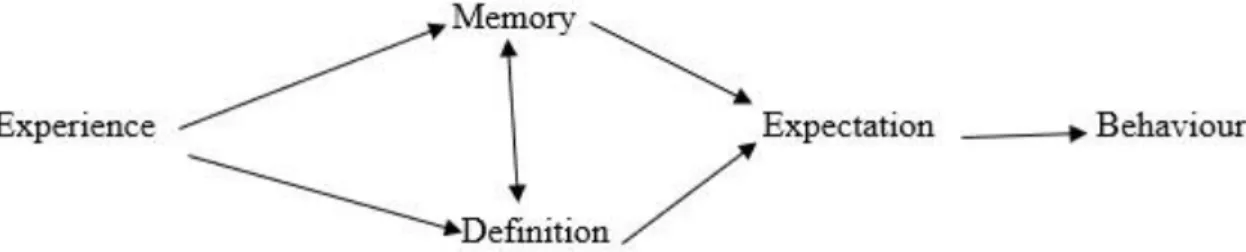
There are a range of ideas that help to organise our understanding of farmers’ perception. In their study of the Ogallala aquifer region in the United States of America, Taylor et al. (1988) conceptualised farmers’ perception of drought as a construct of four factors: experience, memory, definition, and expectation. They considered ‘experience’ as the meteorological events that occurred during the farmers’ careers. To Taylor et al. (1988), drought experience could be experienced indirectly, such as those via oral, written, or pictorial accounts- interestingly, this was outside the scope of their study. On the element of memory, Taylor et al.
(1988) considered that as consisting of those drought events that were part of farmers’ direct experiences and that could be recalled by farmers.
18 They considered definition as a set of criteria, usually moisture shortage, for classifying a period as “drought”. To Taylor et al. (1988), drought could be defined in relation to social or economic impacts of the associated drought. On the last but not the least of the criteria, Taylor et al. (1988) opine that expectation of future drought included how often farmers expected droughts to occur and how severe they expected them to be.
Consolidating these ideas, Taylor et al. (1988) developed a framework that could be used to explain connections between the four elements (figure 2.1). Farmers’ drought experience shapes farmers’ memory, and definition of drought events. Memory and definition of drought are intertwined because what one recalls as drought is shaped by how one defines drought, and definition of droughts is a construct of remembering drought.
Taylor et al. (1988) added ‘future expectations’ to explain that farmers’ expectations about future drought is a function of how drought is defined, and the way in which past experiences are remembered.5
Figure 2. 1 Conceptualisation of the perceptions of drought
The ideas from Taylor et al. (1988) have been applied in many studies to explain perceptions of climate variability and change. For example, Slegers (2008) use the ideas to examine famers’ perceptions of drought in Tanzania and Ethiopia. Osbahr et al. (2011)drew on some elements of the theory of drought perception to understand farmer perceptions in a study in Uganda. However, despite the wide application of these ideas, some dimensions of the framework have come under critique.
For example, different people may experience the same climatic phenomenon of drought but may recall it differently. In their study in Uganda, Osbahr et al. (2011) argued that within a given context there will be farmers that have good memories regarding their farming activities and climate-related events whilst others may not, hence this would potentially translate into considerable variation in the accuracy of understanding climatic events. It has also been documented that memory is subjective in the sense that events that are recalled differ from person to person (Ferrier and Haque, 2003, Singh et al., 2018), there is the tendency of people to exaggerate, or even forget drought events based on how they were affected (Slegers, 2008). Similarly, Hansen et al. (2004) in a study in the Argentine Pampas and in South Florida critiqued the memory component within the framework highlighting that likelihood of the distortion of farmers’ memory of past climate events could be shaped by their wishful thinking, personality characteristics and pre-existing beliefs.
20 Contrary to the idea in Taylor et al. (1988) that personal experience shapes perceptions of climate variability and change, Weber (2010)argues that climate change is not a phenomenon that the lay public can easily and accurately identify. He claims that it is a statistical phenomenon that describes the average weather conditions of a region, and that observations are spaced in time, so memory of past events will be faulty (Weber, 2010). Weber (2010) suggests that because climate change cannot be detected and judged accurately on the grounds of personal experience, the detection of climate change should be left to experts (i.e. climate scientists) and their social amplifiers, such as the media and educators.
Weber does recognise that people will not just accept climate information from any external source but rather from trusted sources(Weber, 2010) although this might ignore the potential of information to also be distorted by political or cultural communication within the media for example.
Thus, moving beyond the idea of people learning about climate change only from experts, Weber (2010)introduces an understanding that the existence of climate change, the causes, and likely consequences are socially constructed. These constructions are functions of the cultural worldviews of societies. What is missing in this conceptualisation is reflection on what criteria are used to identify trusted sources and implications for knowledge as a result. Empirical evidence of farmer perceptions of climate variability and change in Sub-Saharan
Africa
This section narrows the review to empirical studies on farmer perceptions of climate variability and change (CVC) in Sub-Saharan Africa (SSA) to identify similarities and difference in approaches.
Farmers observe the world around them and use change in their environment as indicators of CVC. For example, in the Sahel, Roncoli et al. (2011) documented that farmers identify the shrinking of water bodies, the disappearance of plants and crops, and use changes in
settlement patterns as evidence of reduced rainfall over the last three decades of the twentieth century (Roncoli et al., 2011). Similarly, a study in south western Tanzania showed that farmers use plant phenology for seasonal forecasting (Ladislaus et al., 2010). Ladislaus et al. (2010) highlighted how farmers recognised early and significant flowering of Mihemi (Erythrina abyssinica) and Mikwe (Brachystegia Speciformis) trees from July to November as the signals of good rainfall season (Ladislaus et al., 2010). While Laube et al. (2012) reported the observation of traditional environmental signs (e.g. behaviours of birds and ants, changing wind patterns, new leaves) to indicate the onset of the rainy season have recently become unreliable indicators.
In terms of the role of memory in shaping famers’ perceptions of CVC, there are empirical studies. For example, Codjoe and Owusu (2011) reported that in Ghana the annual rainfall totals have decreased. Respondents in their study felt that rains were better during the 1960s compared to the 2000s.
Regarding the onset of the rains, Codjoe and Owusu (2011) study indicatedthat the rainfall was perceived to start in February but now starts in March, while it was perceived to be hotter than the past. Codjoe and Owusu (2011) also document a trend in the bi-modal precipitation pattern in which two separate rainy seasons are being replaced by a single rainy period, beginning later and ending more quickly.
Osbahr et al. (2011) have similar reports in their study from Southwest Uganda, in which farmers reported that the first season had shifted from a start during February to March and now ended in April rather than May. Meanwhile, they found the second season had shifted from a start in August to September and now ended in November rather than December. This is the case for Ghana where there are several studies only on farmers’ perceptions of climate variability and change (Asante et al., 2017, Codjoe and Owusu, 2011, Derkyi et al., 2018, Kolleh and Jones, 2015). For example, Kolleh and Jones (2015)focused on only farmer
22 perceptions to report that farmers perceived decreasing precipitation and increasing temperature in the Ketu north district of the Volta region in Ghana. Similar results are reported by others in South Africa (Elum et al., 2017), and Ghana (Asante et al., 2017, Derkyi et al., 2018).
There is a limitation from this approach, in that it is then difficult to reflect on the implications of local perception for effective adaptation or potential mal-adaptations because it is not compared with patterns of actual climatic data, nor does it let the researcher reflect on what might be driving perception for some farmers when there are differences.
Thus, it is important to review empirical studies that have explored perceptions of climate variability and change with local meteorological data. Empirically, several studies have used this approach in South Africa (Gandure et al., 2013, Thomas et al., 2007), Uganda (Osbahr et al., 2011), Nigeria (Ayanlade et al., 2017), Zimbabwe (Moyo et al., 2012), and Ghana (Limantol et al., 2016, Yaro, 2013).
For example, in their study focusing on the Vea catchment in Ghana, Limantol et al. (2016) reported that famers observed an increased in temperature for the past 30 years, and that the amount of rainfall, duration, intensity and the number of rainy days has decreased. The analysis with their climate data revealed a rising trend in temperature but no long-term trend changes in annual or monthly rainfall within the Vea catchment area.
Similarly, in a study in four communities in the Upper East region of Ghana, Amadou et al. (2015) reported that farmers reported increased temperatures which matched the analysis of temperature data, but there was also no clear evidence of a statistically significant reduction in the amount of rainfall, but rather high inter-annual variability. Amadou et al. (2015) found an agreement between climatological data and farmers’ observation of a shift in the onset of the rainy season from April to June accompanied by an increased in dry spell. This approach is useful as it gives room for the identification of matches and mismatches, and an opportunity
to then understand the reasons behind this and where appropriately support farmers with better information and a forum for discussing these differences with farmers (Arbuckle et al., 2013, Dohmen et al., 2009, Menapace et al., 2015).
Despite the value of this approach, it is essential to also recognise the importance of recognising different farmer understandings and how these shape adaptation responses. Recently, there is growing empirical interest in trying to understand how farmers’ perceptions of climate variability and change are socially differentiated. For example among farmers in Rajasthan, India (Singh et al., 2018), in Swaziland (Mamba, 2016), and in Zimbabwe (Horsefield, 2016). The study in Swaziland sought to understand how perception is differentiated by different farmer groups using the parameters of age, gender, and level of educational attainment. In the context of age, Mamba (2016) found that older farmers accurately perceived change as compared to younger farmers based on their greater experience. Mamba (2016) also found a strong association between farmers’ level of educational attainment and how they accurately perceive climate variability and change. This is explained by educated people’s competence in the interpretation of information. However, the researcher contends this largely depends on a farmers’ level of educational attainment as lower level of education may not expose farmers to climate systems and climate change related academic discourse.
Similarly, Mamba (2016) found that more women as compared to men correctly perceived climate variability and change and argued that women play critical roles in agricultural activities in patriarchal societies allowing them to be closely connected to the environment around them. Singh et al. (2018) found in India that older farmers had clearer perceptions than younger farmers. However, Singh et al. (2018) found no difference between male and female farmers’ perceptions of water scarcity. Singh et al. (2018) did find that more female
24 farmers than male farmers indicated that they ‘don’t know’ and suggests this could be due to differential access to and use of information between men and women.
2.3 Adaptation to Climate Variability and Change
The concept adaptation has become enshrined in global policies.