University of Arkansas, Fayetteville
ScholarWorks@UARK
Human Nutrition and Hospitality Innovation
Undergraduate Honors Theses Human Nutrition and Hospitality Innovation
12-2018
Allergy Training or Lack Thereof
Madelyn Freeman Mary Kate Klenke
Follow this and additional works at:https://scholarworks.uark.edu/hnhiuht
Part of theFood Studies Commons,Other Nutrition Commons, and theService Learning Commons
This Thesis is brought to you for free and open access by the Human Nutrition and Hospitality Innovation at ScholarWorks@UARK. It has been accepted for inclusion in Human Nutrition and Hospitality Innovation Undergraduate Honors Theses by an authorized administrator of ScholarWorks@UARK. For more information, please contactccmiddle@uark.edu.
Recommended Citation
Freeman, Madelyn and Klenke, Mary Kate, "Allergy Training or Lack Thereof " (2018).Human Nutrition and Hospitality Innovation Undergraduate Honors Theses. 8.
Allergy Training or Lack Thereof Mary Kate Klenke
Madelyn Freeman University of Arkansas
Table of Contents
Abstract……….. 1
Acknowledgments and Dedication …….……….. 2
Chapter 1: Introduction ……...……….. 3
Chapter 2: Literature Review…...……….. 5
Chapter 3: Methods…………..………….……… 13
Chapter 4: Results……….………. 17
Chapter 5: Conclusion….………….……….. 33
References……….. 39
Appendix A: IRB Review……….. 41
Appendix B: Introduction Letter…..……….. 42
Appendix C: Survey…….……….. 43
Appendix D: Quick Service Restaurant Open Ended Answers………. 48
Abstract
Food allergies affect many people in our society today, and the food service industry must keep up with the demand for allergen-free food from their customers. The objective of this research is to gain insight from the employee’s perspective of the importance of food allergies and what training method would help them learn best. Through this research we intend to learn how we can engage employees during training, increase training retention, and stress the importance to change their behaviors and utilize safe practices in regard to allergens. We compared both quick and full-service restaurants’ food-allergy training methods in this study in an attempt to better grasp what it is that helps employees learn. The study revealed that full-service respondents were more likely to identify a food as an allergen, or a reaction as a symptom of an allergy, than the QSR respondents.
Acknowledgement and Recognitions
To all those who struggle to find a safe allergen free meal when eating out.
CHAPTER 1
Introduction
As life progresses, our days get filled with various tasks which we are committed to complete, leaving us with little time to prepare and enjoy nutritious meals. For this reason, the fast food industry has become quite prosperous. While it is convenient to stop at fast food establishments, people with food allergies struggle because they cannot trust the restaurant to provide safe meals. Diet fads and new trendy diets have become so popular that it seems the importance of food allergies is not being taken seriously. Furthermore, not all employees believe customers are being honest when they indicate they have an allergy (Lee & Xu, 2015). The degree of emphasis restaurants place on the significance of food allergies during training is reflected in their employees. Food allergies are very prevalent in our society and need to be taken seriously. Dangerous consequences, including death or hospitalization, could occur because of negligence in the kitchen.
Many regulations and laws put in place require only the manager of an establishment to be trained on food allergens (Food Allergy Research and Education, 2017). Employees are the front line and often the only people customers encounter. These employees need to have the crucial training to be able to properly and safely serve their customers. It is necessary to know how to best train these employees, so they can easily retain the knowledge as well as see the importance of practicing food safety procedures. Current training programs are inadequately preparing entry level employees to serve customers with food allergies. Researchers have acknowledged that this is an issue and have been looking for various solutions. Many studies
have tested the level of knowledge of managers, kitchen staff, and waiters regarding food allergies (Hall, 2013). Different strategies have been examined including new training methods and new laws and regulations (Hall, 2013). Yet the issue persists.
The objective of this research is to gain insight from the employee’s perspective of the importance of food allergies and what training method would help them learn best. Through this research we intend to learn how we can engage employees during training, increase training retention, and stress the importance to change their behaviors and utilize safe practices in regard to allergens.
The purpose of this study was to measure the effectiveness of entry-level employee training on food allergens and to gain insight into the employee’s ideas of different training procedures.
CHAPTER 2
Literature Review
Allergies: What are they?
Food allergies have become more and more prevalent in our world today. While some allergies can be minor, others can lead to serious consequences such as hospitalization and death. The deadliest symptom after eating an allergen is anaphylaxis (Food Allergy Research &
Education, 2017). A food allergy is an “immunological disease that causes the immune system to attack a food protein that is otherwise not harmful to the body” (Lee & Xu, 2015). Over 15 million adults and one in every thirteen children are affected by allergies in the U.S. (Lee & Xu, 2015). The top eight major allergens are dairy, fish, eggs, peanuts, shellfish, soy, and tree nuts (Lee & Xu, 2015).
Allergic reactions are a huge liability for restaurants as they can harm a restaurant’s reputation and brand in a major way resulting in lawsuits, lost sales, lost jobs and even the closing of an establishment. Cross-contamination in the kitchen is one of the biggest causes of allergic reactions in restaurants (Lee & Xu, 2015). Poor training, lack of ingredient knowledge, and mis-communication also contribute to reactions (Lee & Xu, 2015). This has led people struggling with food allergies to avoid eating out. The Celiac Disease Center found that people on gluten-free diets have very low faith in the restaurant industry; believing that only 10% of restaurants have adequate knowledge of allergen diets (Hall, 2013). Previous studies indicated gaps in the training process of restaurant workers where food allergens and their side-effects are concerned.
Problem Statement:
It is speculated that fast food or quick service employees are not all fully equipped with the correct knowledge or training to adequately address customer concerns regarding food allergies. The importance of safe practices must be stressed to each employee upon entering the restaurant industry. The most common causes of allergic reactions are cross-contamination, food preparation mistakes, and poor communication (Ahuja & Sicherer, 2007). Ahuja and Sicherer (2007) found that fifteen out of thirty fatal food allergen reactions began at a restaurant. Over half the employees interviewed had never been trained on food allergies (Ahuja & Sicherer, 2007). Due to the growing trends of special diets, employees underestimate the seriousness of food allergies (as evidenced by servers who reported not believing their customers when they said they had special dietary restrictions) (Lee & Xu, 2015). Servers can also be overconfident in their knowledge and often do not verify with the manager or kitchen staff to see if a dish is allergen free (Hall, 2013). Customers dealing with food allergies place their trust in servers and kitchen staff to serve a safe meal. Servers that are not certain that a plate is safe, sometimes falsely claim it to be (Mandabach, Ellsworth, VanLeeuwen, Blanch & Waters, 2005).
There are misconceptions most employees struggle with: the most common is thinking that removing an allergen, like a peanut, off a dish makes it safe for the customer to consume (Mandabach et al., 2005). This is one of the most common causes of cross-contamination. Additionally, employees are not aware that allergens can be hidden in different dishes, specifically marinades or casseroles (Mandabach et al., 2005).
Current training programs in the fast food industry focus the majority of training time on educating employees on foodborne illnesses (E. coli, salmonella, etc.). While this is incredibly important and needs to be addressed, employees are missing crucial allergen training. If
provided, food allergen training is usually very general; many times, restaurant management will pay an outside source to train employees on allergens which incurs additional costs (Hall, 2013). The current methods used to train employees include in-person or online courses, books,
experience, or self-training, while some receive no training at all (Hall, 2013). Most methods are not engaging or memorable (Iuppa, Weltman, & Gordon, 2004) and traditional training methods are similar to school teaching in that they rely on heavy reading (on screen or in books) which can be difficult for people to grasp, especially if English is not their first language or they have learning disabilities (Hall, 2013). Fast food employees have various reading comprehension levels, as well as different learning types (Hall, 2013). High pressured, fast paced situations lead to mistakes when employees have to rely on memory recall (Hall, 2013).
A study conducted by Dundes and Swann (2008) where they shadowed a new employee at four different fast food restaurants discovered that in one of the restaurants, training consisted of eight thirty-minute videos. All the employees told the trainee how boring they were and told them not to pay attention because they did not need to know the information. At another restaurant, the trainee was given a manual and told to read it but never tested on the materials. She received no form of training. At the last restaurant the researchers saw complete disregard for food safety from the managers (Dundes & Swann, 2008).
The majority of training programs give employees an abundance of information but never test the employees to see if the information given is retained. Employees who know they are not going to be tested or graded on their knowledge will most likely put forth less effort to learn the material.
Another factor contributing to poor training is the high turnover rate in the fast food industry. A study by Lee and Xu (2015) found that turnover rate was above 95% for employees and 39% for management positions. Why train the employee correctly if they are not likely to stay long? This responsibility falls on the managers and owners. Every employee, no matter how long one thinks they will be employed, needs to receive proper training so they are well equipped to serve customers in a safe and timely manner. How do we increase knowledge, emphasize importance, and engage employees to change their behaviors and utilize safe practices? A more targeted training approach needs to be implemented to help employees understand the
implications of their actions. Solutions:
Some restaurant organizations have recognized the dangers of inadequate knowledge of allergies in the food industry and have tried to help rectify the situation. In January 2006 the Food Labeling and Consumer Protection Act was passed by the US Food and Drug
Administration. This act changed the labeling regulations by requiring the eight major allergens to be easily identified on the label (Lee & Xu, 2015). The National Restaurant Association (NRA) recommends the ServSafe Allergen Training program, which was developed with the help of Food Allergy Research & Education (FARE). This program includes lessons online or in a textbook format. To complete the certification applicants must pass a detailed exam. The online course can be completed in one day; it is interactive and includes various videos of scenarios employees might find themselves in on the job.
While this training is good, and is a step in the right direction, there are limitations. One limitation is the expense; the online course costs around twenty dollars. Additionally, no one is required to be ServSafe Allergen Certified. The NRA also recommends some safe allergen
practices, including: color coding, sufficient knowledge of ingredients in meals, substituting allergens in marinades and sauces for non-allergen ingredients, encouraging staff to not guess, and increasing allergy technology. When entering an order into the restaurant system, new allergy technology has buttons with different allergens on them, so when a server is notified of the allergy, he or she presses the button, then the managers and chefs will both get notifications alerting them of the customer’s special needs (Allergy-Friendly Practices 2017).
Some states have begun to change their regulations on restaurants in regard to allergies. Illinois was one of the first states to make a major change. In August 2017, Illinois amended their food handling act. It is now required that all restaurants have one trained food allergen safety and awareness manager on site at all times. The certification must be renewed every three years to stay up to date with the changes in food safety. Managers have thirty days after
employment to get the proper training they need to become certified (Landis, 2017).
Regulations have also been made in Massachusetts by the State Department of Public Health. Menus are required to say, “before placing your order, please inform your server if a person in your party has a food allergy” (Smith, 2010). Another step Massachusetts made was to require one employee from every restaurant to be trained on allergies, and to mandate that a food allergy posted made by FARE be displayed in the kitchen. However, fast food restaurants were exempt from most of these rules (Smith, 2010). The training included watching four videos which discussed real life consequences of food allergy malpractices. Rhode Island followed suit and also required posters, menu warnings, and an allergy trained manager on staff at all times. Some other states began requiring some, but not all of these practices (Food Allergy Research & Education, 2017).
Some researchers have researched various training methods that may help close the knowledge gap for employees in restaurants. Storytelling, games, and interactive activities have been tested as new training techniques. In fact, the US Army has utilized storytelling training techniques. Iuppa et al., (2004) created a training program based on story plots and technology to train new leaders in the Army. They believed this idea would work because stories are fast paced, emotionally engaging, and resemble real life situations (Iuppa et al., 2004). There were several key components that were essential to designing their story. One of the most important included having “powerful and obvious consequences”, whether good or bad (Iuppa et al., 2004). Another was based on setting, as it is necessary for the setting be similar to the one trainees would encounter: making the setting as realistic as possible. Both of these components would be extremely helpful in allergy training, since the consequences can be so detrimental. Stories help trainees picture themselves in the position and provide easier automatic recall when necessary on the job. This is an engaging training method that captures the attention of the trainees (Iuppa et al., 2004).
Chapman, MacLaurin, and Powell (2011) attempted to apply the storytelling method to food safety training. After observing a kitchen staff for some time, they found that a major topic of conversation revolved around celebrities and musicians. Knowing what grabbed the
employee’s attention, they decided to develop training ideas around this topic. To conduct their study, they placed food safety information sheets around the kitchen. The food safety info sheets contained news stories from around the US, with pop culture references, bright pictures, and often humor. Employees struggled to connect with traditional school-like food safety training because often it has no relevance in their lives. Employees also have trouble recognizing the consequences of malpractice. Like the Army training, using stories helped restaurant employees
picture themselves in real-life situations and tugged on emotions of guilt and fear when preparing an allergy-sensitive meal incorrectly (Chapman et al., 2011). By bringing emotions into training, instead of just facts, it was easier to act upon what one is being taught (Hall, 2013).
An interactive allergy training website was created by Stephanie Hall. Her goal was to create a fun and engaging way to stress to trainees the importance of their work. The website “uses task-based training, interactivity, storytelling, gaming, and reward incentives” (Hall, 2013). The beginning of the course starts with an assessment quiz. Based off the answers from the quiz, trainees are able to start at the level necessary for their training. So, if one comes to training with extensive prior knowledge, they are able to begin at a spot appropriate for them (Hall, 2013). At the end of each section of the training module, there are quizzes to ensure employees are
retaining the knowledge. Training tests are often overlooked or too easy in traditional trainings, which enables employees to view training as something they just have to sit through and not pay attention. Requiring employees to pass quizzes at the end of each section forces them to put forth effort during their training. She incorporated stories to help people relate messages to each other which helps with retention of knowledge (Hall, 2013). The website is full of interactive games. There are leaderboards and personal goals to engage the competitive side of employees. One game on the site requires employees to beat the clock and click on all the foods on the screen that contain gluten (Hall, 2013). An example of an interactive activity included on the website shows the effects of gluten on the body of a gluten-sensitive person. The trainees drag and drop food into the mouth of the human and it points out everything that would happen if that person accidently ingested the glutinous food (Hall, 2013). While these new laws, regulations, and innovative training methods are exciting, some employees are still not receiving any training.
CHAPTER 3
Methods
A survey was developed on Microsoft Word for a printout survey. The survey was formulated for the target audience of entry level fast food restaurant employees. A compilation of three sections of questions formed the survey. The first section was based on demographics of the employees, asking age, race, gender, previous employment in industry, and education level. Following demographics was the allergy assessment section. Participants were asked questions based on their beliefs and perceptions of allergies. Specifically, some of the questions involved their history with allergies of themselves, family, or friends, and what they believe are reactions to allergies. The questions analyzed employee’s retention of the knowledge learned in training. Employees were asked some of the exact same questions from their training and also other questions formulated from materials in their course. The final section was for feedback. This section asked employees which training method they believe they could have been better trained, or if they believe, their training was adequate to serve safe meals to every customer.
The survey questions utilized two forms of questions: multiple choice and opinion based. Certain questions employed a 5-point Likert scale with 1 being strongly disagree and 5 being strongly agree. The questions were reviewed by the participating restaurant’s training supervisor and instructor for accuracy.
Paper surveys were used to administer the survey after the quick service restaurant employee’s training orientation in the morning. Only those employees who wished to participate did. Those who joined the study were entered into a drawing to win a gift card to Walmart. The gift card was used as an incentive to encourage participants to join the study and to motivate them to put forth effort during survey. All of the survey answers remained anonymous.
The survey was administered at two different types of restaurants: fast food and fine dining. These two types of restaurants were chosen to assess the differences between the levels of training between the two types of restaurants. At each restaurant the same survey was given after their initial training session. Approval from the Institutional Review Board (IRB) at the University of Arkansas was obtained prior to any collection of data.
After both sets of surveys were completed, the winner of the gift card drawing received their prize and the data was analyzed. SPSS (2018) was utilized in this study to analyze the data received.
The restaurants used in this study were McDonalds, Mermaids- a local fine dining establishment- and Bocca- another local fine dining restaurant with two locations. McDonald’s was chosen because it is a well-established franchise in America, and due to its grandeur, the researchers figured they would have very set, consistent training methods on foods and allergies. Bocca and Mermaids were chosen because both of these restaurants are well-loved full-service restaurants in Fayetteville, and while they may be full service neither of them are close to the size of McDonald’s. It was the researchers’ thought that both the size and the extent of these restaurants’ service may lend to an interesting food allergy training comparison to McDonald’s. Permission to survey both restaurants was easily attained.
Mermaids is owned by Todd and Nikki Golden and they have one location in North West Arkansas. Mermaids did not state on their website that they provided their guests with an allergy free kitchen; however, under their FAQ section they did ask that guests call ahead of time if they have allergies so that their chef could try to accommodate their needs (Mermaids, 2018). Bocca is owned by Keith Burmylo, Angela Vanhook, and Mike & Jill Rohrbach; they have two locations in Northwest Arkansas- one in Rogers and one in Fayetteville. While both locations
offer gluten free options, they did not advertise an allergen free food prep area (Bocca Faq, 2017). The standards Mermaids and Bocca place on the experience of their guests are perceived as much higher than that of McDonalds and so it was the researchers’ goal to see if the training and time put in to educating their staff was more intensive than the training at McDonald’s.
The 63-year-old fast food restaurant, McDonald’s, that participated in the survey is one of the largest, most successful restaurants in the quick service industry. With over 36,000 restaurants worldwide, they have become prominent among the industry (Our History, 2018). This particular restaurant chain holds 10% of the market share worldwide for the fast food market. In the United States alone, they have $8.25 billion of the fast food market (McDonald’s, 2017). Dick and Mac McDonald began expanding their fast food restaurant to a franchise when Ray Kroc joined the brothers in 1954. Their goal was to open 1,000 McDonald’s restaurants in the United States alone. Only a few years later, in 1967 they opened restaurants in Puerto Rico and Canada. Fred Turner, the former McDonald’s chairman, began working as a customer service agent in 1956 and was soon promoted to Vice President of Operations of McDonald’s. He created their business model of quality, service, and cleanliness. This motto has expanded since, but the same principles remain. On their website, McDonald’s has allergen information for each of their menu items. They also have a disclaimer saying they cannot insure any item is completely allergen free and not contaminated by cross contamination.
The researchers had an opportunity to attend one of McDonald’s franchise training sessions. The training session took place at a new training facility built specifically for McDonalds. The entry level training session took place early on a Saturday morning. Upon arriving, trainees were welcoming and directed the new employees to coffee, donuts, and their uniforms. Paperwork was filled out and the lecture began. The new hires seemed very unengaged
and distracted at orientation. The lecture consisted of videos, interactive quizzes that the group took as a whole, and PowerPoint slides. The content of the lecture covered customer service, uniform standards, a couple different food products, and different scenarios an employee could encounter with a guest. There was little mention about food allergies. Peanuts were the only allergen brought into the conversation. All the peanuts at McDonald’s are in single serving packages and are never opened behind the counter. After orientation at the training facility, new employees spent three days training on-site at the restaurant: one day for french-fry training, one for food production, and one for customer service. On these days, the new employees watch videos and then receive one-on-one training with a crew trainer. The on-site training days are supposed to reiterate the material learned at orientation. The McDonald’s trainer believed that repetition helped the new employees to fully grasp the information. She stated the basic food safety training at the orientation was probably remembered and the rest was retaught at the on-site training days. (D. Glenn, personal communication, December 13, 2017).
CHAPTER 4
Results
Response Rate
The researchers collected a total of 44 surveys- 32 from McDonald’s and 12 from the full-service restaurants. All of the employees of the restaurants were given paper surveys to fill out and the researchers collected all 44 of them to record.
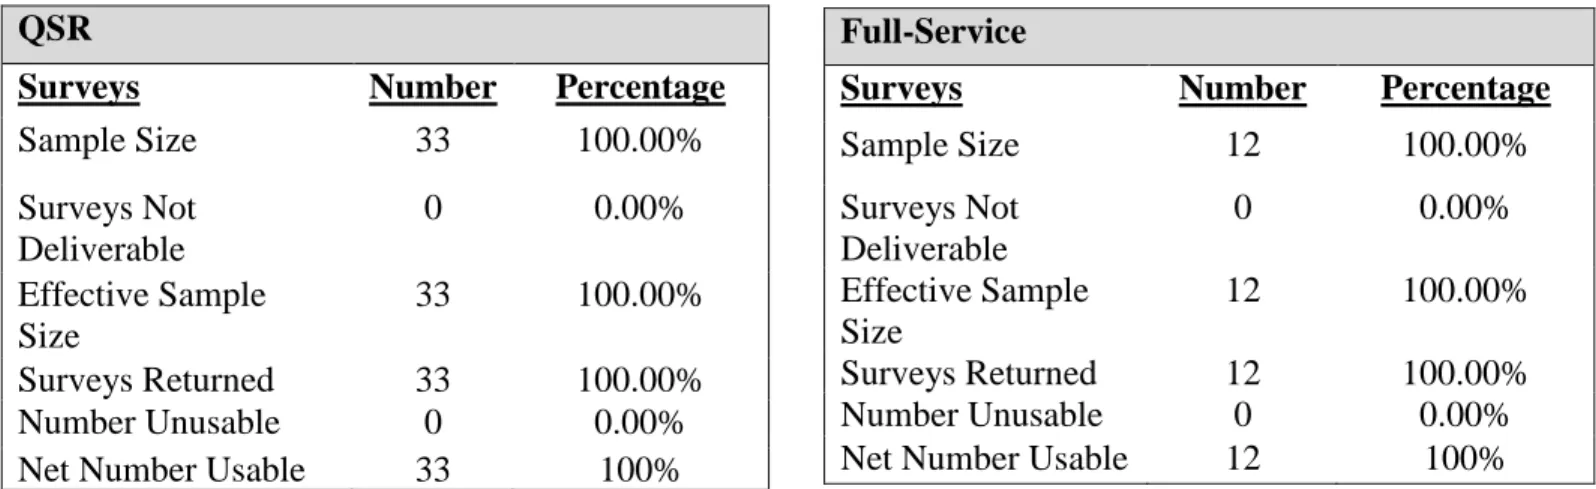
The surveys were distributed in person for both the full-service restaurants and the quick-service restaurant. The McDonald’s training that the researcher attended occurred on Saturday September 15th, 2018 and 33 surveys were distributed. Out of the 33 surveys given to
McDonald’s employees, 33 were completed and returned. When surveying the full-service restaurants, the researcher traveled to the restaurant locations on Tuesday September 25th, 2018 and Wednesday September 26th, 2018. The researcher gave the surveys to the employees on-site. Of the twelve surveys that were given out to the full-service restaurants, twelve were completed and collected. Approximately 100% of all of the 44 surveys distributed were deemed fit for use and therefore donned a 100% survey response rate. The data is divided into the two categories: quick service and full service.
TABLE 4.1
RESPONSE RATE
Respondent Profile
The demographics of the survey pool differed between fast-food (QSR) and full-service restaurants. While the majority (60.60%) of the QSR respondents were female, the full-service respondent profile showed that 58.33% of their survey pool was male. The majority (41.67%) of the full-service respondents were between the ages of 25 and 34 whereas the mode age of the QSR respondents was much lower- 33.30% identifying their age as between 18 and 20. And while the large part of the QSR and full-service survey pool spoke English as their native
language (87.90% and 91.67% respectively) still 12.10% of the QSR respondents stated that they were not able to receive training in their native language compared to the full-service workers who were all able to attend training given in their native language.
Full-Service
Surveys Number Percentage
Sample Size 12 100.00% Surveys Not Deliverable 0 0.00% Effective Sample Size 12 100.00% Surveys Returned 12 100.00% Number Unusable 0 0.00%
Net Number Usable 12 100%
QSR
Surveys Number Percentage
Sample Size 33 100.00% Surveys Not Deliverable 0 0.00% Effective Sample Size 33 100.00% Surveys Returned 33 100.00% Number Unusable 0 0.00%
TABLE 4.2
RESPONDENT PROFILE
What is your Age? Full-Service Number Percentage 16-17 0 0.0% 18-20 0 0.0% 21-24 3 25.0% 25-34 5 41.67% 35-44 3 25.0% 45-54 0 0.00% Total 11 91.67% TABLE 4.3 NATIVE LANGUAGE Full-Service
Is English your Native Language?
Number Percentage
Yes 11 91.67%
No 0 0
TOTAL 11 91.67%
Were you able to receive training in your native language?
Number Percentage
Yes 11 91.67%
No 0 0%
TOTAL 11 91.67%
Are you Male or Female? QSR
Number Percentage
Male 13 39.40%
Female 20 60.60%
TOTAL 33 100.00%
Are you Male or Female? Full-Service
Number Percentage
Male 7 58.33%
Female 4 33.33%
TOTAL 11 91.67%
What is your Age? QSR Number Percentage 16-17 1 3.00% 18-20 11 33.30% 21-24 6 18.20% 25-34 10 30.30% 35-44 1 3.0 45-54 3 9.1 TOTAL 33 97% QSR
Is English your Native Language?
Number Percentage
Yes 29 87.90%
No 4 12.10%
TOTAL 33 100.00%
Were you able to receive training in your native language?
Number Percentage
Yes 7 21.20%
No 4 12.10%
Work Experience
The following section asked about the respondents’ experience in the food industry. 83.33% of the respondents who were currently working in full-service had 4 or more years working in the restaurant industry. The majority of QSR respondents was split between less than a year in the restaurant industry (24.20%) and 4 or more years in the restaurant industry (24.20%). When it came to experience in the hired position, however, 42.40% of QSR
respondents had none whereas 63.64% of full-service respondents had 4 or more years’ worth of experience in their specific position.
TABLE 4.5
WORK EXPERIENCE
Experience in Restaurant Industry
QSR Full-Service
Number Percentage Number Percentage
None 7 21.20% 0 0
Less than 1 year 8 24.20% 0 0
1 year 5 15.20% 0 0
2 years 5 15.20% 1 8.33%
3 years 0 0.00% 1 8.33%
4+ years 8 24.20% 10 83.33%
TOTAL 33 100% 12 100%
Experience in Hired Position
QSR Full-Service
Number Percentage Number Percentage
None 14 42.40% 0 0.0%
Less than 1 year 9 27.30% 0 0.0%
1 year 3 9.10% 0 0.0%
2 years 0 0.0% 3 27.27%
3 years 1 3.00% 1 9.09%
4+ years 6 18.20% 7 63.64%
Personal Experience with Allergies
When it came to the respondents’ experience with allergies, over half of them either had a food allergy or knew a family member or close friend with a food allergy. The researchers determined that whether the respondent was in QSR or full-service wasn’t of significance as the question of personal experience had little to do with training in or experience on the job.
TABLE 4.9
PERSONAL EXPERIENCE WITH ALLERGIES
4.9a
Allergy Training
The researchers then asked the respondents a series of questions regarding their training in the restaurant on allergies. This section of data collected was divided into which service the respondent currently worked in: QSR or full-service. To begin, the respondents were asked if they received training on allergies at all. In the QSR respondents’ responses, 51.50% of them stated that yes, they had received training on food allergies. This left, however, a large 45.50% of QSR employees who had received zero training on food allergies. The full-service respondents’ answers showed a similar trend. Two-thirds of the full-service employees surveyed had received food allergy training, but the other one-third had received no such training.
Do you or a family member have an allergy? Combined Number Percentage Yes 13 28.89% No 31 68.89% TOTAL 44 97.78%
Do you have any close friends with food allergies? Combined Number Percentage Yes 26 59.09% No 18 40.0% TOTAL 44 97.78% 4.9b
TABLE 4.10
ALLERGY TRAINING
Have you been trained on food allergies?
QSR Full-Service
Number Percentage Number Percentage
Yes 17 51.50% 8 66.67%
No 15 45.50% 4 33.33%
TOTAL 32 97.00% 12 100%
Allergen Recognition
The researchers were interested to see if there would be a difference between full-service and QSR respondents in their ability to identify common allergens found in the restaurant industry. To do this they asked the respondents to choose, from a list of 14 foods, which items they thought were allergens. The researchers were interested to see if the respondents could identify the big eight allergens (dairy, tree nuts, shellfish, peanut, wheat, fish, eggs and soy). The other allergens listed were placed there as either faux-allergens (apples and corn syrup) or more advanced/obscure allergens (chocolate, casein, rice, and beans) in order to measure the
respondents’ level of knowledge on allergens. The highest positive (meaning the respondents marked the item as being an allergen) response from QSR respondents was milk, with 84.80% circling it as an allergen. From the full-service respondents 100% of them responded positively to milk, tree nut, shellfish, peanut and soy. The highest negative response from those in QSR was apples, with 81.80% not identifying it as an allergen. In the full-service category, the highest negative response was tied between corn syrup and beans with 58.30% of the respondents not identifying them as allergens. In all categories, full-service respondents had a higher percentage of positive responses than QSR respondents meaning a higher percentage of full-service
TABLE 4.11
WHICH DO YOU BELIEVE ARE ALLERGIES?
Do you believe the following are allergies?
QSR Full-Service
Yes No Yes No
Number Percentage Number Percentage Number Percentage Number Percentage
Milk 28 84.80% 5 15.20% 12 100.0% 0 0.0% Chocolate 20 60.60% 13 39.40% 8 66.7% 4 33.0% Tree nut 24 72.70% 9 27.30% 12 100.0% 0 0.0% Casein 6 18.20% 26 78.80% 7 58.3% 5 41.7% Apples 5 15.20% 27 81.80% 6 50.0% 6 50.0% Shellfish 22 66.70% 10 30.30% 12 100.0% 0 0.0% Peanut 26 78.80% 6 18.20% 12 100.0% 0 0.0% Rice 6 18.2% 26 78.80% 6 50.0% 6 50.0% Wheat 15 45.50% 18 54.50% 11 91.7% 1 8.3% Fish 17 51.50% 15 45.50% 10 83.3% 2 16.7% Corn Syrup 12 36.40% 21 63.60% 5 41.7% 7 58.3% Bean 10 30.30% 22 66.70% 5 41.7% 7 58.3% Eggs 21 63.60% 12 36.40% 11 91.7% 1 8.3% Soy 23 69.70% 10 30.3 12 100.0% 0 0.0%
Beliefs about Customers
Due to the increase in fad diets, the researchers wanted to ask the respondents about their views on whether or not they believed the majority of customers that came in claiming they were allergic to certain foods lie. In the full-service respondents’ answers 50% responded yes, they believed most customers lied about having a food allergy, and the other 50% responded no, they did not believe most customers lie about having an allergy. The majority of QSR respondents (54.50%) also said they believed most customers lied about having food allergies and 42.40% did not answer. Only 3.00% of QSR respondents said they did not believe most customers actually lied about having a food allergy.
TABLE 4.12
BELIEFS ON CUSTOMERS
Do you believe most customers lie about having an allergy?
QSR Full-Service
Number Percentage Number Percentage
Yes 18 54.50% 6 50%
No 1 3.00% 6 50%
No Answer 14 42.40% 0 0.0%
TOTAL 33 100.00% 12 100%
Allergy Safety Knowledge
The next portion of the survey was designed by the researchers to measure the level of allergy safety knowledge the respondents possessed. The researchers asked a series of questions that addressed the proper handling of food allergens and guests with food allergies. Respondents were given three answers to the questions: yes, no, and not sure.
TABLE 4.13
ALLERGY SAFETY KNOWLEDGE
If you remove an allergen from a plate, is the dish now safe for a person with allergies to eat?
QSR Full-Service
Number Percentage Number Percentage
Yes 0 0.00% 3 25.00%
No 18 54.55% 9 75.00%
Not Sure 14 42.42% 0 0.0%
TOTAL 32 96.97% 12 100%
It is ok for someone with allergies to consume a little of what they are allergic to.
QSR Full-Service
Number Percentage Number Percentage
Yes 2 6.10% 0 0
No 22 66.70% 10 83.30%
Not Sure 8 24.20% 2 16.70%
Frying or Cooking in hot temperatures will kill all allergens.
QSR Full-Service
Number Percentage Number Percentage
Yes 3 9.10% 0 0
No 21 63.60% 11 91.70%
Not Sure 8 24.20% 1 8.30%
TOTAL 32 97.00% 12 100%
An individual with an allergy could be hospitalized or die if they eat any amount of what they are allergic to.
QSR Full-Service
Number Percentage Number Percentage
Yes 27 81.81% 11 91.70%
No 0 0.00% 0 0.0%
Not Sure 6 18.18% 1 8.30%
TOTAL 32 97.00% 12 100%
An individual with an allergy must eat the product to have a reaction.
QSR Full-Service
Number Percentage Number Percentage
Yes 1 3.03% 1 8.30%
No 25 75.76% 11 91.70%
Not Sure 7 21.21% 0 0.0%
TOTAL 33 100.00% 12 100%
If someone is having an allergic reaction, they can stop the reaction by drinking large amounts of water.
QSR Full-Service
Number Percentage Number Percentage
Yes 0 0.00% 0 0
No 26 78.80% 12 100%
Not Sure 7 21.20% 0 0
The first question the respondents were asked addressed removing allergens from a plate and then serving it to a guest. The majority of both full-service (75.00%) and QSR (54.55%) respondents said that the dish would not be ok to serve to a guest. Zero of the QSR respondents marked the dish as safe to serve to a person with allergies, but 42.42% said they were unsure. Juxtapose that to the 25.0% of full-service respondents who said that dish would be safe to serve to a customer with allergies, with zero marking their response as not-sure.
Next the survey asked if it was ok for someone with allergies to consume a little of what they are allergic to. (66.70%) of QSR respondents answered no and 24.20% of QSR respondents were unsure if it would be okay for someone with allergies to consume a little of what they are allergic to; two QSR respondents answered yes. And while zero full-service respondents answered yes to it being okay for someone with allergies to consume a little of what they are allergic to, 16.70% were unsure; 83.30% of the full-service respondents marked no.
The third question in this section of the survey asked respondents if frying or cooking a food in hot temperatures would kill all allergens. The majority of both QSR and full-service respondents said no (63.60% and 91.70%) while 24.20% of QSR and 8.30% of full-service workers surveyed were unsure if cooking or frying foods would kill all allergens, and the remaining 9.10% of QSR respondents thought that it would.
When respondents were asked if drinking large amounts of water could stop an allergic reaction no one from either QSR or full-service responded yes. Twenty-six (78.80%) QSR respondents responded no and seven (21.20%) were unsure if drinking large amounts of water would stop an allergic reaction. Among the full-service respondents 100% said that drinking water would not stop the reaction.
The next question asked if an individual could be hospitalized or die if they ate any amount of what they were allergic to. Twenty-seven (81.81%) of the respondents from the QSR survey pool stated that yes, an individual could be hospitalized or worse if they consumed any amount of what they are allergic to and six (18.18%) were unsure. The majority (91.70%) of the full-service respondents also said that someone eating any amount of what they are allergic to could lead to hospitalization and one (8.30%) full-service respondent said that they were unsure.
The last question in this section prompted those being surveyed if they thought that an individual must eat the product they are allergic to in order to have a reaction. Only one respondent from both the QSR and full-service survey pools responded positively (stating that yes, they must eat the product). Twenty-five (75.76%) QSR respondents said no and seven (21.21%) were unsure if the product must be eaten to prompt an allergic reaction. The remaining 91.70% of the full-service respondents stated that no, an individual does not have to eat the product to have an allergic reaction.
Symptoms of Allergies
The next portion of the survey asked respondents to identify symptoms they believed to be signs of an allergic reaction. The options given were swelling, unable to breathe, throat closure, hives or rash, anaphylaxis, vomiting, numbness of mouth, and diarrhea or constipation. With the exception of the symptom of “unable to breathe”, where 75.0% of the QSR respondents answered no, the majority of QSR and full-service respondents marked all of the listed reactions as symptoms of an allergic reaction.
The symptoms with the least amount of positive responses (the least amount of ‘yes’s) from the QSR respondents were having diarrhea or constipation (with 69.7% of respondents believing it was an allergy symptom), numbness of the mouth (with 66.70% believing it to be a
symptom), and- as aforementioned- the inability to breathe (where only 12.10% of QSR respondents believed it to be an allergic reaction). The two notably lower ‘yes’ percentages among the full-service respondents’ believed symptoms were vomiting (with 66.67% believing it was a symptom of an allergy) and having diarrhea or constipation (where, again, only 66.67% believed it was a symptom of an allergic reaction).
TABLE 4.14
SYMPTOMS OF ALLERGIES
Do you believe the following are symptoms of allergies?
QSR Full-Service
Yes No Yes No
Number Percentage Number Percentage Number Percentage Number Percentage
Swelling 32 97.00% 1 3.00% 12 100% 0 0.0% Unable to Breathe 4 12.10% 25 75.00% 12 100% 0 0.0% Throat Closure 31 93.90% 2 6.10% 12 100% 0 0.0% Hives or Rash 31 93.90% 2 6.10% 12 100% 0 0.0% Anaphylaxis 31 93.90% 2 6.10% 11 91.70% 1 8.30% Vomiting 29 87.90% 4 12.10% 8 66.67% 4 33.33% Numbness of Mouth 22 66.70% 11 33.30% 12 100% 0 0.0% Diarrhea or Constipation 23 69.7% 10 30.30% 8 66.67% 4 33.33% Training Analysis
The researchers wanted to have the respondents rate their perceived effectiveness of the allergy training they received. To do so the respondents were given several statements created by the researchers that they were asked to agree, somewhat agree, disagree, or somewhat disagree with. They were also given the option to respond ‘not-applicable’. The first statement the
respondents were asked to respond to was if after training they felt prepared to serve a safe meal to all patrons at their restaurant. 81.80% of the QSR respondents agreed or somewhat agreed with the statement and only two (6.10%) of the respondents somewhat disagreed. When
responding to the same statement, 91.70% of the full-service respondents agreed or somewhat agreed with it and the remaining 8.30% responded with a not applicable. The next statement directly addressed the respondents’ perception of their food allergy training. When given the statement “the training I received adequately educated me on food allergies” 72.70% of QSR respondents agreed or somewhat agreed, 15.20% disagreed or somewhat disagreed, and 12.10% did not answer. In response to the same statement, 91.66% of the full-service respondents agreed or somewhat agreed, zero disagreed or somewhat disagreed, and 8.30% said the statement was not applicable.
TABLE 4.16
TRAINING ANALASIS
After training, I feel prepared to serve a safe meal to all patrons at my restaurant.
QSR Full-Service
Number Percentage Number Percentage
Agree 19 57.60% 9 75.00% Somewhat Agree 8 24.20% 2 16.70% Somewhat Disagree 2 6.10% 0 0% Disagree 0 0.00% 0 0% Not applicable 0 0.00% 1 8.30% Didn’t Answer 0 0.00% 0 0% TOTAL 33 100% 12 100%
The training I received adequately educated me on food allergies.
QSR Full-Service
Number Percentage Number Percentage
Agree 17 51.50% 4 33.33% Somewhat Agree 7 21.20% 7 58.30% Somewhat Disagree 3 9.10% 0 0% Disagree 2 6.10% 0 0% Not applicable 0 0.00% 1 8.30% Didn’t Answer 4 12.10% 0 0% TOTAL 33 100% 12 100%
The statements in the next portion of the training analysis section were given in order to determine the best method of training food-service employees. The researchers formulated four statements containing “I learn best through…” followed by four methods in which respondents could identify with: humorous teaching videos, hands on training, real life stories, and lectures. The most popular method of training preferred by respondents was by the hands-on option. This method had 84.44% of respondents agree or somewhat agree with the statement.
TABLE 4.17
TRAINING ANALYSIS
I learn best with humorous teaching videos. Number Percentage Agree 16 35.56% Somewhat Agree 15 33.33% Somewhat Disagree 6 13.33% Disagree 2 4.44% Not applicable 2 4.44% Didn’t Answer 4 8.89% TOTAL 45 100%
I learn best through hands on training (at restaurant). Number Percentage Agree 33 73.33% Somewhat Agree 5 11.11% Somewhat Disagree 1 2.22% Disagree 1 2.22% Not applicable 0 0.00% Didn’t Answer 5 11.11% TOTAL 45 100%
I learn best through real life stories (learning through others’ experiences).
Number Percentage Agree 20 44.44% Somewhat Agree 14 31.11% Somewhat Disagree 5 11.11% Disagree 2 4.44% Not applicable 0 0.00% Didn’t Answer 4 8.89% TOTAL 45 100%
I learn best through lectures.
Number Percentage Agree 7 15.56% Somewhat Agree 10 22.22% Somewhat Disagree 12 26.67% Disagree 11 24.44% Not applicable 1 2.22% Didn’t Answer 4 8.89% TOTAL 45 100%
The least popular method of training was learning through lectures, with 51.11% of respondents disagreeing to somewhat disagreeing that this method was the way in which they learned best. Learning through humorous videos and through real life stories had similar positive responses, with 68.89% and 75.55% respectively responding with some degree of agreement.
Improvements to Training
The final portion of the survey was designed to help ameliorate the training process the respondents received. The researchers asked respondents to write what improvements they thought should be made to the training in order to help them better understand food allergies. The majority, 63.60%, of QSR respondents wrote “none” under improvements to training and 83.33% of full-service respondents wrote either “none” or “not applicable” (which goes along
with the previous response). Other responses from full-service respondents included helping to prepare and serve food to people with allergies in order to learn proper food allergy safety, and for the restaurant to provide separate menus with all items that included allergens as well as what possible substitutes could be used in lieu of those allergens.
CHAPTER 5
Conclusion Summary of Research
This study looked at allergy training in both full-service and quick-service restaurants. The researchers’ goal was to analyze the effectiveness of the employees’ food allergy training and compare the two food service genres to determine which of the two training methods was most effective between full service and quick service restaurants.
In order to do this, the researchers developed a survey for employees of both full and quick service restaurants that tested their knowledge on food allergies after they had completed their employee training. The survey was distributed to employees of QSR and full-service restaurant employees in person by the researchers and was also collected by the researchers. The results were then entered into a database for the researchers to analyze via SPSS software.
The surveys consisted of several demographic based questions including age, race,
gender, and native language. The survey also delved into the training methods on food safety and food allergies that the restaurants provided their employees (see Appendix C).
Interpretation of Findings
When analyzing the demographic portion of the survey, the researchers hoped to find if there were any significant differences in QSR and full-service restaurant respondents that could have affected the effectiveness of training or an employee’s reception of the training. The gender identity of the respondents of full-service and QSRs was not notably different: 60.60% of the respondents identified as female in QSRs and 58.33% identified as male in the full-service category. However, the majority of the quick-service respondents were younger than that of the
full-service respondents. One-third of the QSR respondents were between the ages of 18 and 20 whereas 41.67% of the full-service respondents were between the ages of 25 and 34. This difference in age could contribute to the employees’ previous experience with food allergies in the restaurant industry; and therefore, their food-allergy knowledge. The researchers also asked the survey participants about their native language, and, if their native language was not English, was an option provided to receive allergy training in their native language. All of the full-service employees’ native language was English (and so they were able to receive training in their native language); however, 12.10% of the QSR respondents did not mark English as their native
language. Out of all 12.10% of the non-native English speakers, none of them were able to receive training in their native language. The researchers speculate this could also be a barrier in communicating proper food handling safety, especially when handling allergens.
The next portion of the survey focused on the respondents’ previous work experience. The full-service respondents (83.33%) had four or more years working in the restaurant industry, while the QSR respondents’ experience was split between less than one year (24.20%) and four or more years (24.20%). More than three times as many full-service respondents had worked in the restaurant industry for four or more years than had the QSR respondents. This added
experience contributes to the base internal knowledge a restaurant employee could have access to while preparing and serving foods. It also could influence how receptive they are to food training methods, and in particular, how well they process and store training on allergies. The clearest difference in experience between QSR and full-service respondents was when they were asked about their experience in their hired position. As shown in table 4.5 on page eighteen, almost the same percentage (63.63%) of full-service workers had four or more years working in their hired position whereas QSR respondents had from no experience to just up to one year’s worth of
experience in their hired position. The full-service respondents had a much higher percentage of responses correlating with more years of experience.
When asked about receiving training specifically on food allergies, the majority of QSR (51.50%) and full-service (66.67%) respondents replied yes. In both genres, however, a large portion of respondents had not been trained on food allergies (45.50% of QSR and 33.33% of full-service). The researchers found this somewhat surprising, yet informative. If almost half of an employee base had not received allergy training the researchers speculated it would be more likely their knowledge of allergies would be less than those that had been trained on food allergies. And so, since two thirds of the full-service employees surveyed responded they had received allergy training (compared to QSR respondents’ 51.50%), it was the researchers’ prediction that the full-service respondents would perform higher on the portion of the survey that tested their knowledge of allergens.
The researchers then asked the respondents to identify from a list of fourteen foods, which among them they believed to be allergens. In this list of fourteen foods, the researchers included the big eight allergens (milk, tree nuts, shellfish, peanut, wheat, fish, eggs, and soy), two faux-allergens (apples and corn syrup), and four more obscure allergens (chocolate, casein, rice, and beans). In doing this the researchers hoped to measure the respondents’ level of knowledge on allergens. Over 80% of full-service respondents positively identified all of the eight major allergens (identifying them with a 100% positive full-service respondent rate with the exception of wheat and eggs which were positively identified by a lesser 91.7% of the full-service respondents, and fish, which was only identified by 83.3%). The majority of QSR respondents (51.50%) only identified seven of the eight major allergens (wheat being the exception with only 45.50% positively identifying it as an allergen. For all eight of the major
allergens the QSR respondents had at least 15% fewer positive identifications than the full-service respondents. The full-full-service respondents also positively identified the four more obscure allergens (chocolate, casein, rice, and beans) at a higher rate than the QSR respondents. For all of the fourteen foods given, full-service respondents were more likely to identify the item as an allergen, even in the cases of the decoy allergen (apples and corn syrup). Whether the full-service respondents’ greater tendency to positively identify a food as an allergen was because of more effective food allergy training, more experience, or another factor unbeknownst to the researchers; however, there was an evident difference in the responses of QSR respondents and full-service respondents that the researchers thought was worth examining.
The next portion of the survey asked respondents to react to certain statements concerning allergy safety by selecting either yes, no, or not sure. The majority of both full-service and QSR respondents’ reactions to all of the four statements were correct and consistent with precautions regarding allergy safety. For each statement, the QSR majority was slightly lower than that of the full-service respondents’, but the majority still answered correctly (see table 4.13). Overall, the full-service respondents were more confident in their responses with a lower percentage responding “Not Sure” to all of the statements and a larger percentage majority responding with the appropriate “Yes” or “No” than the QSR respondents.
In the final section of the survey the respondents were asked their level of allergy knowledge. The researchers provided a list of symptoms of allergies and asked the respondents to identify which they believed to be legitimate symptoms a customer could exhibit when experiencing an allergic reaction. One-hundred percent of full-service respondents positively identified five of the eight reactions given as symptoms of a food allergy. The majority of the full-service respondents positively identified all eight possible symptoms, however, the QSR
respondents had a higher percentage for three of the eight reactions (see table 4.14). The researchers were unsure as to why the full-service respondents failed to positively identify the three reactions (anaphylaxis, vomiting, and diarrhea or constipation) at a higher percentage than the QSR respondents, as that had generally been the trend throughout the survey.
The last portion of the survey focused on how successful/educative the respondents perceived their training. The researchers asked the respondents to react to the following statements:
1. After training, I feel prepared to serve a safe meal to all patrons at my restaurant. 2. The training I received adequately educated me on food allergies.
Almost eighty-two percent of the QSR respondents agreed or somewhat agreed with the first statement, and when responding to the same statement, 91.70% of the full-service respondents agreed or somewhat agreed. When responding to the second statement, 72.7% of QSR and 91.66% of the full-service respondents agreed or somewhat agreed. In both of these statements, more full-service respondents felt well prepared and educated on food allergies and how to deal with them than the QSR respondents.
Significance of the Study
The purpose of this study was to measure how effective the allergy training methods of employees in both quick-service and full-service restaurants was. The researchers’ goal was also to receive feedback from the employees surveyed on their perceived preparedness and
experience when handling customers with allergies and allergens themselves. With an estimated fifteen million Americans afflicted with a food allergy, training on how to deal with customers having an allergic reaction and how to prevent the reaction from occurring in the first place is of the utmost importance in the food-service industry (Facts and Statistics, 2018). By not only
testing employees’ knowledge of food allergies, but also asking for their input as to how to ameliorate their food-allergy training, this study sought to identify the weaknesses in employee allergy training in hopes of correcting them for the most effective and efficient employee training experience.
The researchers found that most of the respondents learn best through hands-on training (84.44%) and learn the worst through lectures (37.78%). The study also revealed that full-service respondents were more likely to identify a food as an allergen, or a reaction as a symptom of an allergy, than the QSR respondents. Whether this was because of the full-service respondents’ greater experience in the food service, or more effective food-allergy training methods was inconclusive.
Recommendations for Further Research
In this study, the researchers’ main focus was the general effectiveness of food allergy training in quick-service and full-service restaurants. Although the researchers did compare the two sets of survey results to one another, further research with larger sample sizes would be needed in order to come to a definite conclusion as to if the training methods between the two types of food service differ significantly; and if the two training methods do differ, if one method is more effective in training employees on food allergies than the other.
The researchers also see potential for further research into how certain training methods, in a broader sense, help employees’ retention of knowledge. This information would be
extremely useful for developing the most effective and efficient orientations and training periods for new employees.
.
REFERENCES:
Ahuja, R., and Sicherer, S. H. (2007). Food allergy management from the perspective of
restaurant and food establishment personnel. Annals of Allergy, Asthma & Immunology, 98(4), 344–348, from https://doi.org/10.1016/S1081-1206(10)60880-0
Chapman, B., MacLaurin, T., & Powell, D. (2011). Food safety info sheets: Design and
refinement of a narrative-based training intervention. British Food Journal, 113(2), 160-186, from https://doi.org/10.1108/00070701111105286
Dundes, L., and Swann, T. (2008). Food safety in fast food restaurants. Journal of Human Resources in Hospitality & Tourism, 7(2), 153–161, from
https://doi.org/10.1080/15332840802156881
Facts and Statistics. (n.d.). Retrieved October 21, 2018, from
https://www.foodallergy.org/life-with-food-allergies/food-allergy-101/facts-and-statistics FAQ. (2017, December 20). Retrieved September 25, 2018, from
https://boccanwa.com/faq/
Food Allergy Research & Education. (2017). Food allergies and restaurants. Retrieved
November 30, 2017, from https://www.foodallergy.org/education-awareness/advocacy-resources/advocacy-priorities/food-allergies-and-restaurants
Glenn, D. (2017, December 13). Personal Interview.
Hall, S. M. (2013, December). Limiting risk through design: The effects of user experience and user interface design on food allergen safety training (Thesis). Retrieved from
https://digital.library.txstate.edu/handle/10877/6278
IBM Corp. Released 2016. IBM SPSS Statistics for Windows, Version 24.0. Armonk, NY: IBM Corp.
Iuppa, N., Weltman, G. and Gordon, A. (2004) Bringing Hollywood storytelling techniques to branching storylines for training applications, proceedings of the third international conference for narrative and interactive learning environments. August 10-13, 2004. Edinburgh, Scotland.
Landis, T. (2017, September 1). New law requires food-allergy training for restaurants. Retrieved November 30, 2017, from http://www.sj-r.com/news/20170901/new-law-requires-food-allergy-training-for-restaurants
Lee, Y. M., and Xu, H. (Michelle). (2015). Food allergy knowledge, attitudes, and preparedness among restaurant managerial staff. Journal of Foodservice Business Research, 18(5), 454–469. https://doi.org/10.1080/15378020.2015.1093452
Mandabach, K. H., Ellsworth, A., VanLeeuwen, D. M., Blanch, G., and Waters, H. L. (2005). Restaurant managers’ knowledge of food allergies: A comparison of differences by chain
or independent affiliation, type of service and size. Journal of Culinary Science & Technology, 4(2/3), 63–77.
McDonald’s, (2018). How McDonald’s became the leader in the fast food industry. Retrieved March 13, 2018, from https://profitworks.ca/blog/541-how-mcdonalds-became-the-leader-fast-food-industry-marketing-strategy
McDonald’s, (2018). Our history. Retrieved March 13, 2018, from https://www.mcdonalds.com/us/en-us/about-us/our-history.html Mermaids Restaurant. (2018). Retrieved September 23, 2018, from http://www.mermaids.ws/
Smith, S. (2010, February 11). State urges food allergy safety in restaurants: [Proposal seeks postings, training 1]. Boston Globe; Boston, Mass., p. B.1.
APPENDIX A IRB Review
APPENDIX B Introduction Letter
The intent of this study is to analyze the training and knowledge of restaurant employees on food allergies and their perceptions of said food allergies. Your feedback is extremely important to the success of this study. All participation is completely voluntary and anonymous. This survey will take anywhere from 5-10 minutes of your time and may be paused at any moment and resumed at a later time. No one under the age of 18 should take this survey.
The successful outcome of this study relies heavily on your cooperation and full completion of this questionnaire. As previously mentioned all participants in the survey will remain completely anonymous. All information collected will be kept confidential to the extent allowed by law and the University policies. Therefor we ask that the information you provide be completely truthful and accurate. There are no right or wrong answers, we are interested in your actual opinions and perceptions and urge you to respond with the utmost honesty.
This study is being taken on by the Honor’s Program of the School of Human Environmental Sciences in the concentration of Human Nutrition and Hospitality Innovation at the University of Arkansas. Your response is entirely voluntary, anonymous, and will remain confidential to the extent allowed by the law and University policy.
The option will be given to you to be entered into a drawing to win a $50 Walmart gift card at the end of the survey by providing your email address. This drawing will not jeopardize the anonymity of your responses in any way.
We will be glad to answer any questions you may have regarding this project. Please contact Mary Klenke at mkklenke@uark.edu, Madelyn Freeman at mjfreema@uark.edu, or Dr. Kelly Wat at kway@uark.edu with any inquiries about this study.
Questions regarding your rights as a research participant should be directed to the University of Arkansas Institutional Review Board of the Protection of Human Subjects, University of Arkansas by calling the following number: 479-575-2208.
We look forward to receiving your responses and appreciate your willingness to participate. Thank you for your time and contribution.
APPENDIX C Survey Demographic Information:
Thank you for your interest in completing this survey. In order to understand current training adequacy, the researchers must establish a demographic profile of the employees. Your answers will remain confidential and will be destroyed after completion of the study. Please answer the following questions by choosing only ONE answer for each question.
1. What is your age? a) 18-20 years old b) 21-24 years old c) 25-34 years old d) 35-44 years old e) 45-54 years old f) 55 years or older
2. What is your gender? a) Male
b) Female
c) Prefer not to answer
3. What is your ethnicity? a) White/ Caucasian b) Hispanic or Latino
c) Black or African American
d) Native American or American Indian e) Asian/ Pacific Islander
f) Other
4. Is English your native language? a) Yes
b) No
5. If answered no to the previous question, were you able to receive training in your native language?
a) Yes b) No
6. What is the highest level of education you have completed? a) Still in K-12 school system
b) Some high school, no diploma c) High School Graduate (or GED) d) Some college, no degree
e) Associate Degree f) Bachelor’s Degree g) Master’s Degree
h) Professional or Doctorate Degree
a) None
b) Less than 1 year c) 1 year
d) 2 years e) 3 years f) 4 + years
8. How many years of experience do you have in the current position you are training for? a) None
b) Less than 1 year c) 1 year
d) 2 years e) 3 years f) 4 + years
9. What salary do you expect to make in this position? a) $8.50/ hr
b) $8.51-10.99/ hr c) $11-12/ hr d) $12.01-14.99/ hr e) $15+/ hr
10. What type of restaurant are you training for? a) Fast Food
b) Full Service c) Other
11. How long do you expect to work here? a) A couple months
b) Less than a year c) 1 year
d) 2 years e) 3+ years
12. Is this your first job in the food service industry? a) Yes
b) No Allergy Assessment:
This set of questions is about your understanding and knowledge of food allergies. If there is a question you do not wish to answer, you can skip it and move on to the next question.
13. Do you or any close family members have food allergies? a) Yes
b) No
14. Do you have any close friends with food allergies? a) Yes
b) No
b) No
16. Select from this list of food items, ALL that you believe contain allergens: a) Milk b) Chocolate c) Tree nuts d) Casein e) Apples f) Shell Fish g) Peanuts h) Rice i) Wheat j) Fish k) Corn Syrup l) Beans m) Eggs n) Soy
17. I believe that most people who come to my restaurant lie about having allergies. a) Yes
b) No c) Not Sure
18. If you remove an allergen from a plate, the dish is now safe for a person with allergies to eat (ex. Removing bun from hamburger and serving it to gluten free patron).
a) Yes b) No c) Not Sure
19. Frying or cooking in hot temperatures will kill all allergens. a) Yes
b) No c) Not Sure
20. It is okay for someone with allergies to consume a little amount of what they are allergic to.
a) Yes b) No c) Not Sure
21. If someone is having an allergic reaction, they can stop the reaction by drinking large amounts of water.
a) Yes b) No c) Not Sure
22. An individual with an allergy could be hospitalized or die if they eat any amount of what they are allergic to.
a) Yes b) No c) Not Sure
23. An individual with an allergy must eat the product to have a reaction. a) Yes