Premium Estimation Inaccuracy and the
Actuarial Performance of the US Crop Insurance Program
Octavio A. Ramirez 1 and
Carlos A. Carpio2
1Contact Author: Professor and Head of the Department of Agricultural and Applied Economics, University of Georgia, 301 Conner Hall, Athens, GA 30602, e-mail: [email protected], phone: (706) 542-2481, fax: (706) 542-0739.
2 Assistant Professor, Department of Applied Economics and Statistics, Clemson University.
Selected Paper prepared for presentation at the Agricultural & Applied Economics
Association’s 2011 AAEA & NAREA Joint Annual Meeting, Pittsburgh, Pennsylvania, July 24-26, 2011.
Copyright 2011 by [authors]. All rights reserved. Readers may make verbatim copies of this document for non-commercial purposes by any means, provided that this copyright notice appears on all such copies.
Premium Estimation Inaccuracy and the
Actuarial Performance of the US Crop Insurance Program
Abstract
This article explores the impact of the likely levels of inaccuracy associated with two main types of premium estimation methods, under different sample sizes, on the actuarial performance of the US crop insurance program. The analyses are conducted under several plausible assumptions about the insurer versus the producers’ estimates for their actuarially fair premiums. Significant differences are found due to estimation method and sample size, with the currently used procedures resulting in the worse actuarial performance. Several conclusions and recommendations are provided that could markedly reduce the amount of public subsidies needed to keep this program solvent.
Key Words: Agricultural Subsidies, Crop Insurance Premium Estimation, Loss-Cost Procedures, Risk Management Agency.
Crop insurance is the most popular risk management tool used by U.S. agricultural producers. In 2009, the U.S. crop insurance program covered close to 265 million acres, assuming nearly $80 billion in liabilities. The Risk Management Agency (RMA) (please refer to the glossary at the end of the paper for a definition of all acronyms), a division within the US Department of Agriculture, administers this program. The traditional and most popular product offered by the RMA, which is the focus of this paper, is a farm level, multiple-peril, crop yield insurance policy (MPCI). This policy protects against low yield and crop quality losses due to adverse weather and unavoidable damage from insects and disease (Barnett, 2000). High participation has been achieved through large subsidies, with farmers as a whole now paying less than 50% of the total amount of premiums required to keep the program solvent (USDA/RMA 2010a). The need for substantial subsidies to achieve high levels of participation has in part been attributed to “adverse selection,” which is said to occur when the producers have more information about the risk of loss than the insurer and are thus better able to determine the fairness of the premium rates (Harwood et al. 1999).
The perceived inability of the RMA to precisely estimate the actuarially fair premium that should be charged to a particular producer is a matter of concern. Because of its obvious linkage with crop insurance program performance, substantial research efforts have been conducted to improve rating procedures at the farm level (Glauber 2004; Carriquiry, Babcock, and Hart 2008; Anderson, Harri and Coble 2009; Rejesus et al 2010). Given the large disparities in program indemnities versus premiums observed across crops and regions (Glauber 2004; Babcock 2008) it appears that rating inaccuracy might be creating a problem at more aggregate levels as well. In addition to their impact on the actuarial performance of the crop insurance program, incorrect rates can affect the producers’ economic welfare and the incentives and returns to the private insurance companies that sell Federal crop insurance at those rates.
A critical issue affecting premium estimation accuracy is the choice of the method used to model/approximate the underlying yield distribution. The three general procedures that have been proposed for this purpose are non-parametric, semi-parametric and parametric in nature (Ramirez, McDonald and Carpio 2010). The nonparametric approaches, such as those used by the RMA, are free of a functional form assumption and thus generally more flexible. However, they can be
inefficient relative to parametric procedures under certain conditions. Specifically, according to Ker and Coble (2003), “it is possible, perhaps likely, for very small samples such as those corresponding to farm-level yield data, that an incorrect parametric form –say Normal– is more efficient than the standard nonparametric kernel estimator.”
The parametric procedures assume that the data-generating process can be adequately represented by a particular parametric probability distribution function. Therefore, the key to their accuracy is that said distribution is flexible enough to closely approximate the stochastic behavior of the underlying random variable of interest (Ramirez and McDonald 2006). The main advantage of this method is that, if the assumed distribution can adequately represent the data-generating process, it performs relatively well even in small sample applications. Semi-parametric methods show significant potential because they encapsulate the advantages of the parametric and non-parametric approaches while mitigating their disadvantages (Ker and Coble 2003; Norwood, Roberts, and Lusk 2004).
Ramirez, Carpio, and Rejesus (2010) recently assessed the accuracy of select rating methods under different field conditions encompassing sample size, the number of farms from which data is available, and the level of yield correlation across farms. The rating methods evaluated by these authors include non-parametric historical loss-cost procedures that rely on indemnity data (similar to those currently used by the RMA) and flexible parametric methods which use simulations from estimated yield distribution models to compute the premiums. While it is recognized that there are
other worthy procedures that could be considered, this article builds on their work to explore the impact of the likely levels of inaccuracy associated with these two particular premium estimation methods under different sample sizes, on the actuarial performance of the U.S. crop insurance program. The analyses are conducted under several plausible assumptions about the producers’ (versus the RMA) estimates for their true premiums, which is a critical issue that has not been addressed in previous literature either. Several conclusions and recommendations are provided that could substantially reduce the amount of public subsidies needed to keep this program solvent. Theoretical Framework
A farmer participating in the Federal MPCI program selects one of several possible yield guarantees ( and some price guarantee level . The expected value of indemnity for coverage at the
100% of the mean (M) level of coverage is given by , where is the expectations operator and the probability density function of yields. Knowledge of is important for both the farmer and the insurer as they make their decisions to buy or sell a yield insurance product. For example, as shown in Coble et al. (1996) a risk neutral producer will only purchase yield insurance if is higher than the premium charged.
From the insurer’s perspective, is the actuarially fair premium, i.e. the one it needs to charge to avoid an expected loss. Since is unknown, it has to be estimated by both producers and insurers and, therefore, is subject to sampling variability. Additionally, given that the type, quality and quantity of information available these two parties are markedly different, the amounts of variability in their estimated are also likely to differ. For the remaining of the paper, since the analysis is conducted from the insurer’s perspective, the actuarially fair premiums ( ) are also referred to as the true premiums (TP).
Producer Behavior Scenarios
The impact of farm-level premium estimation accuracy on crop insurance program performance is evaluated under the following scenarios:
S1: The farmers are risk-neutral and know what TP is. Then, as explained in the theory section, individuals will not participate if the premium charged to them exceeds the TP. S2: The farmers are risk-adverse and know what the actuarially fair premium is. Then, theoretically, individuals will be willing to pay a risk-protection premium (RPP) for being insured. As a result, they will participate as long as the premium charged to them does not exceed TP+RPP. An admittedly high RPP of 25% is assumed.
S3: The farmers are risk-neutral but do not know what the actuarially fair premium is with certainty. For this scenario, the farmers’ estimates of their true premiums are assumed to be unbiased and drawn from a normal distribution with mean TP and coefficients of variation (CV) of 0.5 (S3a) and 0.75 (S3b). Again, theoretically, individuals will not participate if the premium charged exceeds their estimate of TP.
S4: The farmers are risk-neutral, do not know what the actuarially fair premium is, and their premium estimates are influenced by the insurer’s. Specifically, it is assumed that the farmers’ estimate equals TP+0.5xSEP, where SEP is the insurer’s estimate standardized to have a zero mean.
S5: The farmers are risk averse (as in S2), do not know what the true premium is, and their estimates for it exhibit random error (as in S3) and are influenced by the insurers’ (as in S4). Methods and Procedures
The question of how accurately can crop insurance premiums be estimated via the RMA procedures and other statistical methods was recently tackled by Ramirez, Carpio, and Rejesus (2010) through simulation analyses. Specifically, they identify five probability density function (pdf) shapes that
are generally representative of farm-level corn yield distributions across the State of Illinois. These include a normal (N) and four non-normal densities characterized by: 1) low skewness (-0.833) and high positive kurtosis (396.654) (SUA), 2) low skewness (-0.09) and high negative kurtosis (-1.21)
(SBA), 3) moderately negative skewness (-2.10) and moderately positive kurtosis (10.01) (SUB), and
4) negative skewness (-2.77) and positive kurtosis (14.25) (SBB). They then consider those pdfs to
be the true densities and use them to simulate yield datasets for their analyses.
With this construct, the actuarially fair premiums (TP) can be computed with near-certainty on the basis of very large samples simulated from the “true” densities (Ramirez, Carpio, and Rejesus 2010, p 7-8). In addition, premium estimates can be obtained on the basis of small samples simulated from those same densities, and compared with the corresponding true premiums
(Ramirez, Carpio, and Rejesus 2010, p 9-13). Through such comparisons, these authors assess the accuracy of various rating procedures under different conditions including sample size (SS) and the level of yield correlation across farms (CC). Three of their approaches will be considered in this research: 1) the two most accurate parametric methods identified by them (M1 and M2), and 2) their historical loss-cost procedure which mimics what is currently used by the RMA (M3)
Specifically, the methods of Ramirez, Carpio, and Rejesus (2010) are used to generate a large number (2,500) of premium estimate values conditional on the underlying yield distribution (D = N, SUA,SBA,SUB orSBB), the estimation method utilized (M = M1, M2 or M3), the number of
yield observations per farm (SS = 10, 25 or 50), and the level of correlation across farm yields (CC = 0 or 0.5). Note that those values are actually draws from the underlying distribution of estimated premiums associated with a particular D-M-SS-CC combination. As in Ramirez, Carpio, and Rejesus (2010) (equations 11 and 12), the 2,500 premium estimates obtained for each of such combinations are then used to compute two key statistics of the distribution: its Mean Absolute Deviation (MAD) and its average deviation or BIAS relative to the underlying true premium.
Given the true premiums, for each of the previously described producer behavior scenarios, these 2,500 draws can also be used to compute the percentage of producers that would participate in the program (PPR) and the program’s Loss-Ratio (LR, defined as the ratio of the indemnities to be paid to the premiums to be collected) associated with various Premium Subsidy Rates (PSR, defined as one minus the percentage of the estimated premium (EP) that is actually charged to the
producers). PSR is therefore the percentage of EP that is subsidized (i.e., paid) by the government. Under S1 (farmers are risk-neutral and know their actuarially fair premiums) if, for example, the distribution of premium estimates is symmetric and centered at the true premium (TP) and the PSR=0 (i.e., the producers are charged 100% of the estimated premium), only 50% of the farmers will face rates that are lower than what they know to be actuarially fair and thus participate in the program. As a result, the actuarially fair premium corresponding to all participating farmers will be more than or equal to what they are being charged, which means that the program will generate a net loss and have to be subsidized. In addition, the insurer would need to reduce (i.e., only charge a fraction of) its estimated premiums if it wants more than 50% participation, creating even larger total program losses. The producer participation rates and loss-ratios associated with various PSRs can be computed on the basis of the true premiums and the 2,500 draws from the probability distribution of the premium estimates associated with any particular D-M-SS-CC combination.
Specifically, under this simplest scenario (S1), for each observation, the true premium (TP) is compared with the subsidized premium (SP), where SP is computed by multiplying the actual premium estimate (EP) times the fraction of it to be charged to the producer, which is one minus the Premium Subsidy Rate (PSR). If TP>SP, the farmer participates in the program. Otherwise, he/she does not. The Producer Participation Rate (PPR) is then calculated by dividing the number of participating producers by the total (2,500), and the program Loss-Ratio (LR) is computed by dividing the sum of the true actuarially fair premiums (TP) by the sum of the subsidized premiums
(SP) corresponding to the participating producers only. This process is repeated for PSR ranging from 0 to 99% in increments of 1%. A similar procedure is followed for the four remaining scenarios (S2, S3, S4 and S5), except that, instead of TP, SP is compared with:
a) 1.25xTP for S2,
b) TP+CVxTPxZ (where CV = 0.5 and 0.75 and Z is a standard normal draw) for S3, c) TP+0.5xSEP (where SEP is the insurer’s standardized premium estimate) for S4, and d) 1.15xTP+0.5xTPxZ+0.25xSEP for S5.
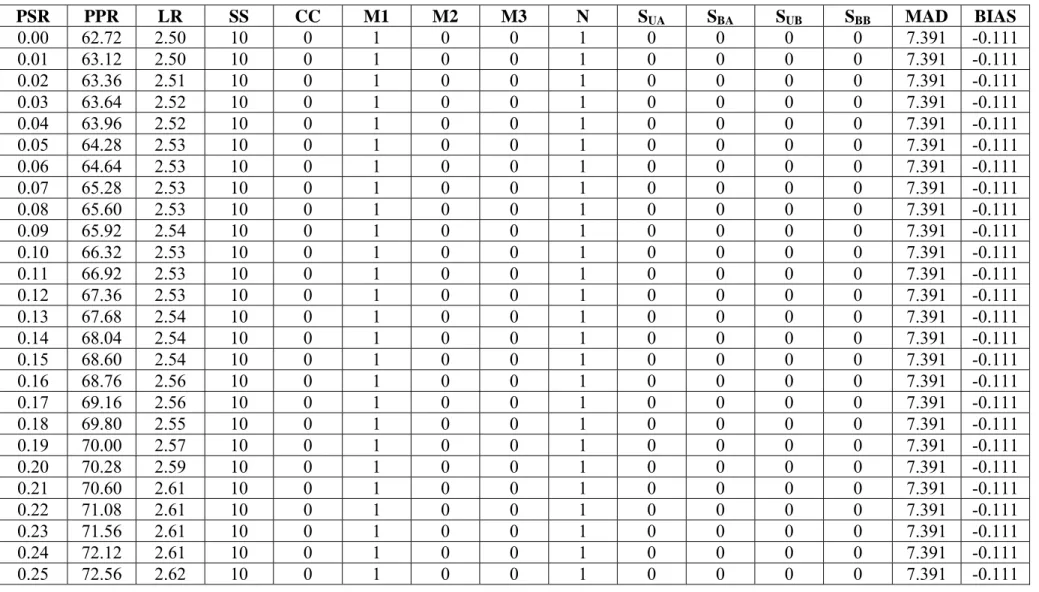
For each scenario, the final output of this data-generating process can be captured in a 9,000x15 matrix. This matrix is composed of 90 (100x15) sub-matrices containing the Producer Participation Rates and Loss-Ratios associated with each D-M-SS-CC-MAD-BIAS combination, for Premium Subsidy Rates ranging from 0 to 99%. The first 25 rows of the sub-matrix
corresponding to M=M1, D=N, SS=10, and CC=0, which resulting distribution of premium
estimates exhibits a MAD and BIAS of 7.391 and -0.111, is shown in Table 1. Note that the method and distribution type are coded as dummy variables. Also, as in Ramirez, Carpio, and Rejesus (2010), the MAD and BIAS are scaled in relation to a TP of 10.
Models Specification
Conceptually, note that in the first stage of the previously described data-generating process the characteristics of the distribution of estimated premiums (being summarized in the MAD and BIAS statistics) are jointly determined by the method used (M), the yield distribution assumed (D), the cross-farm yield correlation (CC), and the sample size (SS). In the second stage, those
characteristics (MAD and BIAS) determine the Producer Participation Rate and the Loss-Ratio associated with any particular Premium Subsidy Rate. Econometric models are built to tease out the systematic components of these relationships. The first two models capture the relationships
between MAD and BIAS and M, D, SS, and CC, as follows: 7
(1) 2 3 2 3 4 5
2 3 2 3 4 5 2
3 2 3 4 5 2 2 2 3
2 4 2 5 3 2 3 3 3 4 3 5
where Y is MAD or BIAS, M2, M3, D2, D3, D4, and D5 are dummy variables for methods 2 and 3 and the four non-normal distributions (SUA,SBA,SUB andSBB), and i represents the observation. That
is, the models include intercept shifters for method and distribution, linear and quadratic terms for CC and SS, and interactions between CC and method, CC and distribution, SS and method, SS and distribution, method and distribution, and CC and SS.
In regard to Producer Participation Rate (PPR), the Loss-Ratio (LR), and the Premium Subsidy Rate (PSR), an objective of this research is to be able to predict the LR that the government would have to incur in order to achieve a particular PPR given the characteristics (i.e., MAD and BIAS) of the probability distribution of the premium estimates. This means that a model for LR as a function of PPR, MAD, and BIAS is needed. After exploring several specifications, the following was selecte on t e basis of ts higher adjusted Rd h i 2 and most significant parameter estim esat : (2)
/
The problem with the above equation is that, as previously discussed, LR and PPR are jointly determined by PSR, MAD, and BIAS. Therefore, the following reduced-form model for PPR has to be est ated and the predictions from it (im ) used as an instrument for estimatin (2g ): (3)
/
Results and Discussion
The models above are estimated for each of the five previously discussed scenarios (S1, S2, S3a, S3b, S4 and S5). Given the high level of non-linearity in the relations between the variables of interest, in order to improve functional form fit, the data used for estimation is restricted to PPRs between 20 and 95%, which reduces the number of observations from 9,000 to 4,656 (S1), 3,945 (S2), 5,806 (S3a), 5,865 (S3b), 4,216 (S4), and 6078 (S5). Inferences beyond these PPR boundaries are not of empirical interest and will not be attempted.
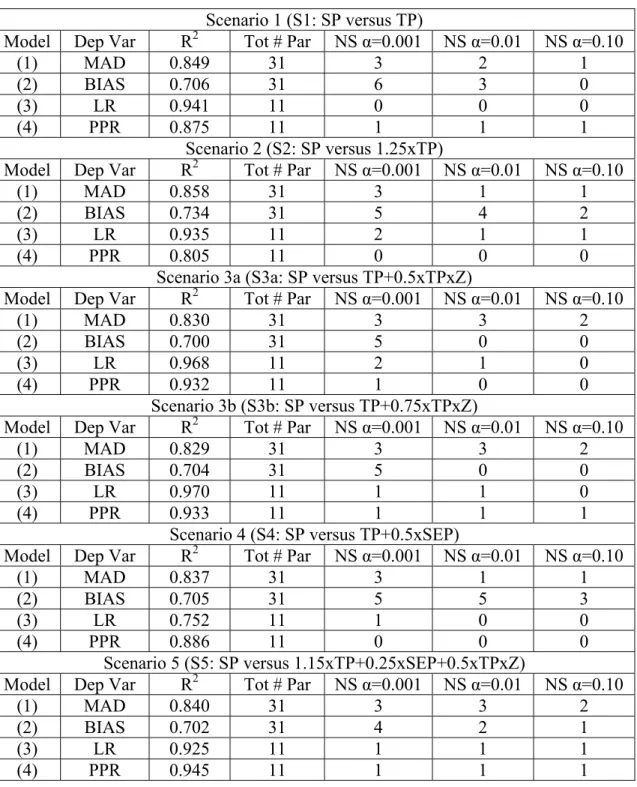
Summary statistics for these models are presented in Table 2. First, note that there is consistency in the magnitudes of the R2’s for each of the models across all scenarios, ranging from 0.830 to 0.858 for the MAD, 0.700 to 0.734 for the BIAS, and 0.805 to 0.945 for the PPR model. In the case of the Loss-Ratio models, which are the most critical for this research, the R2’s are 0.941 (S1), 0.935 (S2), 0.968 (S3a), 0.970 (S3b), 0.752 (S4), and 0.925 (S5). The relatively low value for the S4 model is attributed to increased noise generated when adding 0.5xSEP to TP. In general, however, these R2 levels are impressive given that the models were estimated on the basis of at least 3,945 observations each (i.e., there is no possibility of over-fitting the sample). In addition, most parameters are statistically significant across all models and scenarios, even at an α level of 0.001. It is evident that the independent variables, as well as their interactions, are important in explaining the observed dependent variable values. In short, the summary statistics presented in Table 2 provide confidence on the predictions and inferences to be made from the models.
Given that the models are non-linear and include interaction terms, the best way to explore the responses of the endogenous variables of interest (LR and PPR) is through scenario analyses. Specifically, the estimated models are used to produce the statistics presented in Table 3. To create Table 3, MAD and BIAS are first predicted for each D-M-SS-CC combination of interest and averaged across the five distributions. The resulting MAD and BIAS predictions are then used to
forecast the LR (equation 2) and solve for the PSR (equation 3) associated with a PPR of 75% in this case. It is also important to point out that in this scenario analysis, it is assumed that the status quo is the RMA-like method (M3) used with farm-level yield samples of size ten (SS=10) which exhibit a moderate 0.5 level of contemporaneous correlation with each other (CC=0.5). In fact, since the results are relatively similar for different CC levels and a moderate cross-farm yield correlation of 0.5 is the most likely field condition (Ramirez, Misra, and Field, 2003), only the statistics for CC=0.5 are presented and discussed.
For the first scenario (S1), where it is assumed that the producers are risk neutral and know the true premium with certainty, Table 3 reveals several noteworthy trends. First, for the range of sample sizes evaluated (SS=10 to SS=30) the M2 premium estimates exhibit a substantially lower MAD and BIAS (i.e., are more precise) than M1 and M3. The reduced MAD and BIAS result in markedly lower program Loss Ratios. At SS=10, for example, the LR associated with the assumed 75% PPR is 2.098 when M2 is used to estimate the premiums, versus 2.406 for M1 and 2.395 under the RMA-like historical loss-cost procedure (M3). It is interesting to note that although these figures are computed on the basis of estimated yield distributions representative of Illinois corn farms, the M3 LR of 2.395 is remarkably similar to the actual 1999-2009 nationwide average LR of 2.32 for the RMA’s MPCI plan (Table 5).
The statistics in Table 3 can be extrapolated to obtain nationwide values and provide a general sense of the potential impact of using different methods and sample sizes for premium estimation on the performance of the US crop insurance program. At the 2009 MPCI indemnity levels of $1.265 billion, for example, the predicted status quo (M3, SS=10, CC=0.5) LR of 2.395 implies that producers pay $527 million in premiums and the government has to subsidize the remaining $738 million. Alternatively, at the 2.098 LR associated with M2, $603 million in premiums would be collected and $662 million in government subsidies required. In other words
government outlays could be reduced by approximately $76 million (10.3%) if M2 was used to estimate farm-level premiums instead of M3.
A simpler way to assess the potential public cost differences is to compute the percentage of the total indemnities (i.e., of the program’s variable costs) paid by the government (PPG in Table 3). In the previous comparison, the PPG associated with M3 is 0.583 versus 0.523 for M2, for a projected 1.265x(0.583-0.523) = 1.265x0.06 = 0.076 billion = $76 million reduction on the
required government outlays. Larger (>0.075) PPG differences between M3 and M2 are observed at SS=20 and 30, which could amount to more than 1.265x0.075 = $95 million in public savings.
The last column in Table 3 that deserves some attention is the Premium Subsidy Rate (PSR). As previously explained, PSR is the proportional discount that would have to be applied to the estimated premium in order to achieve the desired PPR, given SS, CC, and the premium estimation method utilized. As an example, when CC=0.5, SS=10 and M3 is used for premium estimation, PSR=0.411. This means that the estimated premium rates would have to be discounted/subsidized by 41.1% to achieve a PPR of 75%. At this subsidy rate, PPG=0.583, i.e., the government would end up paying for 58.3% of the total indemnity-related program costs.
A second important conclusion from Table 3 is that there are substantial premium estimation and program cost efficiency gains that could be achieved by increasing SS. This is a key result given the RMA’s current practice of limiting the maximum number of yield observations that are considered to establish the rates to 10 (USDA/RMA 2004). At the presumed status quo (M3, SS=10, CC=0.5), the estimated Loss-Ratio is 2.395 and the government has to underwrite 58.3% of the total indemnities paid, which extrapolates to a nationwide MPCI plan cost of 0.583x1.265 billion = $737 million. As insurers collect longer, more reliable farm-level yield time-series, it is critical that they recognize the importance of exploiting this information. At SS=30, for example, M3 exhibits an LR of 1.930 and a PPG of 0.482, which would presumably reduce government cost
to $610 million (i.e., by $127 million). If, in addition, the premiums were estimated using M2 rather than M3, the LR and PPG could further decline to 1.684 and 0.406, for potential public cost savings of nearly $223 million or approximately 30% relative to the status quo.
However, the previously discussed figures rely on the assumption of a risk neutral farmer who knows the true premium with certainty (S1). These assumptions are relaxed next. The second scenario (S2) involves a risk-adverse farmer who knows the actuarially fair premium. Specifically, it assumed that he/she is willing to pay an admittedly high 25% risk-protection premium for being insured. Such a producer will purchase insurance as long as the premium charged does not exceed 1.25xTP. As expected, program performance is much enhanced under this scenario, particularly for M2. At SS=30, for example, the M2 PPG declines to 0.217, versus 0.352 for M3.
Although the actual risk-protection premium that a typical farmer is willing to pay for crop insurance is unknown, the previous result suggests that its magnitude could be a very important determinant of program performance. The actual magnitude of the RPP is obviously influenced by the fact that the federal government often provides disaster/hardship relief payments to farmers when an area’s crops are negatively affected by adverse weather or pest events. Therefore, substantial increases in the producers’ risk-protection premiums and reductions in the amounts of federal subsidies needed to keep this program solvent could be observed if the government credibly announced the elimination of all other forms of hardship relief payments and farmers had to rely on just crop insurance to cope with unusually high yield losses.
The third scenario (S3) involves a risk neutral farmer whose estimate of the true premium is unbiased but subject to random error. The lower assumed CV of 0.5 (S3a) implies a MAD of approximately 4. This level of error was purposely selected to coincide with the MADs that are observed when the most accurate estimation method (M2) is used under SS=30 and CC=0.5 (Table 3). In addition note that at such SS the BIAS in M2 premium estimation is negligible. In other
words, the assumption underlying S3a is that the farmers’ estimates (FE) are as good as those obtained by optimal methods when a relatively large sample size is available. This assumption is justified by the fact that, in setting FE, the farmer considers his/her entire historical yield experience as well as that of other farmers with similar production systems and conditions, and he/she is better able than the insurer to ascertain what other farm operations are comparable to his/hers.
Note that in S3a, the LR, PSR, and PPG statistics follow the same patterns as in S1 and S2, i.e. they decline with SS and are lower under M2. However, it is also observed that those statistics are noticeably higher at SS=10 and do not decline as quickly with increased sample size. This worsening trend continues at the higher CV of 0.75 assumed in S3b, which implies an MAD of about 6. At this level of producer uncertainty about what his/her actuarially fair premium is, the loss ratios remain at about 2.6 even when the insurer uses 30 yield observations to compute its premium estimates (M3), which means that the government has to subsidize about 60% of the total
indemnity-related program costs (Table 3).
In other words, uncertainty in the producers’ knowledge of the true premium substantially increases cost regardless of SS and reduces the benefits that could be reaped from the insurer using additional observations to estimate the premiums. This result negates the argument advanced in previous literature that poor program performance and the need for significant subsidies is in part due to the fact that the farmers have more information than the insurer about what the true premium is. Farmers having less information (i.e., S3 versus S1) in fact seems to make things much worse.
An unrealistic scenario is explored to follow up on the previous result. In this scenario the insurer knows the true premium with certainty but the producer estimates it with error through the random process specified in S3. Since the insurer knows TP; M, SS and CC have no effect on the predicted LR, PSR, and PSG. At the lower CV of 0.5 (which implies a producer’s MAD of about 4), the LR is estimated at 1.52 and the government covers 34% of the indemnity-related program costs
through a premium subsidy rate of 34%. At the higher CV of 0.75 (producer’s MAD of about 6), the LR, PSR and PPG increase to 2.1, 52% and 52% respectively. In short, producer error in premium estimation seems to have as much negative impact on program performance as insurer error.
The fourth scenario (S4) also involves a risk-neutral farmer who does not know what the actuarially fair premium is. However, it is also assumed that his/her premium estimate is influenced by the insurer’s. Specifically, the producer’s estimate (FE) equals TP+0.5xSEP, where SEP is the insurer’s premium estimate scaled to have a mean of zero. This means that if the insurer’s estimate is X units above/below its average the farmer’s estimate will deviate from TP by half that amount. Adding 0.5xSEP to TP has the effect of increasing the overall correlation between EP and FE from 0.25 to 0.70. Basically, as S1 and S2, S4 assumes that the farmer has better knowledge about TP than the RMA but, at the same time, he/she incorporates some of the information considered by the insurer (represented by SEP) on his/her premium estimate.
The first part of this assumption has been previously justified. The second part is only reasonable if FE is strongly influenced by the observations from the farmer’s historical yield experience that are being used by the RMA to compute EP. Obviously, even if the insurer and the farmer consider the same yield data span to estimate the premium, their estimates are unlikely to be equal as their estimation “methods” are different. In addition, as previously argued, the producer is better able to ascertain which other farm operations are comparable to his/hers and will consider the yield experience of those other farmers to arrive to a subjective estimate of his/her TP.
Nevertheless note that program performance is markedly improved under this scenario, particularity when SS=10. At the presumed status quo (M3, SS=10, CC=0.5), for example, the Loss-Ratio is 1.80 (versus 2.395 under S1) and the government only has to underwrite 44.4% of the total indemnities paid (versus 58.3%), for an extrapolated nationwide cost of $562 (versus $738) million. However, the improvement in program performance relative to S1 is much less at the larger
sample sizes. This is likely due to the fact that the “base” correlation between EP and TP (and thus FE) increases with SS, which reduces the impact of the additional EP-FE correlation induced when making FE=TP+0.5xSEP. Regardless, anything that can be done to close the gap between FE and EP, such as educating farmers about the merits of the RMA’s premium estimation methods to increase their confidence on EP, could markedly improve program performance.
The fifth scenario combines the features of the first four at arguably realistic levels. Specifically, the producer is assumed to participate in the program as long as the subsidized premium charged (SP) does not exceed his/her risk-adjusted premium estimate FE = (1.15xTP) +(0.5xTPxZ)+(0.25xSEP), which has an expected value of 1.15xTP, exhibits random error, and incorporates some of the information considered by the insurer in setting EP. Note that under this composite scenario and a target PPR of 75% (Table 3), the LR (1.93) and PPG (0.482) associated with the presumed status quo (M3, SS=10, CC=0.5) are on the low range of the reported 1999-2009 annual averages for the APH-MPCI plan (Table 5).
Marked differences in predicted program performance when using M2 versus M3 are also observed in this case, especially at SS=30, which suggest potential public cost savings of up to $60 million/year. Increasing the number of observations used to estimate the premiums from 10 to 30 substantially reduces projected government expenditures as well. Alternatively, at a target PPR of 90% (Table 4), the LR (2.579) and PPG (0.612) are on the high range of what has been historically observed. Also note than having such a high target level of produced participation reduces the magnitude of the potential improvements in program performance due to premium estimation method and sample size, to about half of what it is observed at PPR=75%.
A sixth scenario is composed after considering the previously discussed results which suggest that a high correlation between the producer and insurer premium estimates might be key to reducing program costs. Specifically it is assumed that, instead of using historical yield records to
estimate the premiums, the RMA attempts to charge to the producers a premium amount that is as close as possible to what they (the farmers) consider to be actuarially fair. In a first sub-scenario (S6a) the producer estimates its own premium with random error (FE=TP+0.5xTPxZ, as in S3a) and the RMA assesses the farmer’s estimate with random error as well (EP=FE+0.5xFExZ). In this case, both the producer’s and the insurer’s estimates are unbiased but exhibit a MAD (PMAD and IMAD) of about four with respect to the true premium and to each other. Also note the implicit assumption that the producer is risk neutral, i.e. he/she does not assign a risk-protection premium to FE. Alternatively, this assumption would afford the RMA the luxury of underestimating FE by as much as the RPP.
As expected, since EP is not based on the yield samples, the MAD, BIAS, LR, PSR and PPG statistics are the same regardless of SS, CC and method. In the case of S6a, these statistics suggest that 75% participation could be achieved with a PSR of about 26% and a LR of
approximately 1.7. This means that the government would only have to pay for 40% of the
indemnity-related program costs (Table 6), which is a substantial improvement over the status quo. An optimistic scenario (S6b) is that the insurer can more precisely estimate FE (FE=TP+0.5xTPxZ and EP=FE+0.25xFExZ, which imply MADs of about four for the producer and two for the
insurer). This yields extremely favorable PSR (0.15), LR (1.29), and PPG (0.22) statistics. In comparison to the presumed APH-MPCI plan status quo (PPG=0.585 and program cost of $1.265 billion), a PPG of 0.22 would save taxpayers (0.583-0.22)x$1,265 million = $460 million per year. If, in addition, the producers were willing to pay a 15% RPP, the PPG would further decline to 0.12 generating savings of nearly $600 million. Interestingly, additional sub-scenarios provided in Table 6 suggest that a higher MAD in the producer estimate for his/her true premium (holding the
insurer’s MAD constant) slightly improves program performance, and increasing the target PPR from 75% to 90% does not hinder performance nearly as much as in the previous scenario (S5).
In short, it appears that program performance could be substantially improved if the RMA could device a mechanism to elicit accurate estimates of what the producers believe their actuarially fair premiums are. The details on how this could be accomplished are left to future research. To finalize, it is noted that the rating aspects of the yield-risk component of the alternative Crop Revenue Coverage (CRC) plan, which augments the protection afforded to producers for price in addition to yield risk, are very similar to the APH. Therefore, the previously discussed qualitative conclusions and quantitative extrapolations should, to some extent, apply to it as well. Given the growing popularity of the CRC (Table 7), an enhancement in this program’s performance could save taxpayers as much as in the case of the APH-MPCI plan.
Concluding Remarks
The following remarks and conclusions are offered with the understanding that substantial extrapolations are being made from results obtained for a particular crop and state for which long and reliable farm-level yield time series are available. Such high-quality data is essential to reliably estimate the distributional shapes that are used as a basis for the analyses. Unfortunately, the authors do not have access to data of similar quality for other crops and states. However, as the necessary information is or becomes available, the methods and procedures introduced in this article could be replicated to obtain more reliable conclusions at the aggregate level.
With this caveat, a first main conclusion of this research is that the current need to discount producer premiums in order to achieve substantial rates of producer participation, and the associated loss ratios and government subsidy levels, could be fully explained by the level of error in the RMA’s premium estimates at the farm level. In other words, in contrast to what has been suggested in the literature and public debate, the high program costs might not be due to poor program
management, political influence to benefit particular constituencies or otherwise deliberate subsidies to some crops and regions. Also in contradiction to conventional belief, it is shown that
the observed loss ratios and overall subsidy levels could occur without the programs being
systematically subsidizing the less efficient farmers. Yet, random subsidies might be an unintended and unavoidable consequence of offering crop insurance as a safety-net for agricultural producers.
The literature generally attributes the high loss ratios and indemnity-related program costs to a phenomenon called “adverse selection,” which is arguably caused by the fact that the farmers have more information than the insurer about what their actuarially fair premiums are. The results presented in this article suggest that this is not the case. In fact it is shown that, under the current rate-setting protocols, producer error in premium estimation could have as much of a negative impact on program performance as insurer error and that random uncertainty in the producers’ premium estimates on top of the insurer’s error actually makes things worse.
A third important conclusion form this research is that if the current protocol where the insurer attempts to estimate the actuarially fair premium based on observed yield data continues to be used, it is essential for the RMA to have more precise premium estimates for each of the
producers that are or could be insured. The results suggest that the status quo could be substantially improved by using more elaborate methods as well as larger sample sizes for premium estimation, which is particularly key given the RMA’s current practice of limiting the maximum number of yield observations considered to establish the rates to 10. As longer, more reliable yield time series are available from participating producers and the RMA upgrades its premium estimation
procedures, MPCI and perhaps CRC plan loss-ratios could potentially be reduced over time to the 1.5-1.7 level, with the government having to subsidize only 35-40% of the program’s variable costs.
Policymakers and taxpayers should realize that improvements beyond these levels could be difficult to achieve under the current strategy of estimating premiums based on yield samples. In addition, such LR/PPG levels might only be attainable at a moderate (75%) target producer participation rate. Under the current policy environment, larger loss-ratios might have to be
permanently accepted if the goal is that a higher percentage of the producers voluntarily participate in the program. On the other hand, the results also suggest that the producers’ willingness to pay a higher risk-protection premium for crop insurance could drastically reduce the public program costs. Substantial increases in the farmers’ risk-protection premiums and resulting improvements in program performance could be observed if the government credibly announced the elimination of all other forms of disaster/hardship relief payments and farmers had to rely on just crop insurance to cope with unusually high yield losses. In addition, it is concluded that anything that can be done to close the gap between the producers’ and the RMA premium estimates, such as educating farmers about the merits of the RMA methods, could markedly improve program performance as well.
A last but potentially promising conclusion of this research is that program performance could be substantially improved by completely changing the current RMA rate-setting strategy. That is, instead of attempting to estimate the true premiums based on observed yield data, the insurer could focus on eliciting the farmers’ willingness to pay for crop insurance, i.e. what they believe to be their risk-adjusted actuarially fair premiums for a particular plan choice. The analyses suggest that if these could be measured with reasonable accuracy, it might be possible to achieve very high levels of producer participation with loss ratios under 1.5.
References
Anderson, J.D., A. Harri, and K.H. Coble 2009. “Techniques for Multivariate Simulations from Mixed Marginal Distributions with Application to Whole-Farm Revenue Simulation.” Journal of Agricultural and Resource Economics 34(1):53-67.
Babcock, B.A. 2008. “Corn Belt Contributions to the Crop Insurance Industry.” Iowa Ag Review 14(2):1-3, 11.
Barnett, B.J. 2000. "The US Federal Crop Insurance Program." Canadian Journal of Agricultural Economics 48(4): 539-551.
Coble, K.H., T.O. Knight, R.D. Pope, and J.R. Williams. 1996. Modeling Farm-Level Crop Insurance Demand with Panel Data. American Journal of Agricultural Economics 78:439-447.
Carriquiry, M.A., B.A. Babcock, and C.E. Hart. 2008. “Using a Farmer’s Beta for Improved
Estimation of Expected Yields.” Journal of Agricultural and Resource Economics 33:52-68. Glauber, J. W.2004.“Crop Insurance Reconsidered.”American Journal of Agricultural Economics
86(5):1179–1195.
Glauber, J. W. and K. J. Collins. 2002. “Crop Insurance, Disaster Assistance, and the Role of the Federal Government in Providing Catastrophic Risk Protection.” Agricultural Finance Review 24(2):81-101.
Harwood, J., R. Heifner, K. Coble, J. Perry, and A. Somwaru. 1999. “Managing Risk in Farming: Concepts, Research, and Analysis.” Agr. Econ. Rep. No. 774, USDA/Economic Research Service, Washington, DC.
Ker, A.P. 2001. "Private insurance company involvement in the US crop insurance program." Canadian Journal of Agricultural Economics 49(4):557-566.
Ker, A.P. and K. Coble (2003). “Modeling Conditional Yield Densities.” American Journal of Agricultural Economics 85(2):291-304.
Norwood, B., M.C. Roberts, and J.L. Lusk (2004). “Ranking Crop Yield Models Using Out-of-Sample Likelihood Functions.” American Journal of Agricultural Economics 86(4):1032-43. Ramirez, O.A. 1997. “Estimation and Use of a Multivariate Parametric Model for Simulating
Heteroskedastic, Correlated, Non-Normal Random Variables: The Case of Corn-Belt Corn, Soybeans and Wheat Yields.” American Journal of Agricultural Economics 79(1):191-205. Ramirez, O.A. and T. McDonald. 2006. “Ranking Crop Yield Models: A Comment.” American
Journal of Agricultural Economics 88(4): 1105-1110. 20
21
Ramirez, O.A., T McDonald and C.A. Carpio. 2010. “A Flexible Parametric Family for the Modeling and Simulation of Yield Distributions.” Journal of Agricultural and Applied Economics 42(2):1-17.
Ramirez, O.A., C.A. Carpio, and R.M Rejesus. 2010. “Can Crop Insurance Premiums be Reliably Estimated?” Agricultural and Resource Economics Review (forthcoming).
Ramirez, O.A., S.K. Misra, and J.E. Field. 2003. “Crop Yield Distributions Revisited.” American Journal of Agricultural Economics 85(1):108-120.
Rejesus, R.M., B.K. Goodwin, K.H Coble, and T.O. Knight. 2010. “Evaluation of the Reference Yield Calculation Method in Crop Insurance.” Agricultural Finance Review 70(3):427-445. U.S. Department of Agriculture. Risk Management Agency (USDA/RMA). 2010a. “Current
Year-to-Date National Summary of Business Reports: Single-page Crop Business Report: 2007-2010.” Available at http://www.rma.usda.gov/data/sob.html (accessed February, 2010). U.S. Department of Agriculture. Risk Management Agency (USDA/RMA). 2010b. “National
Summary by State/Crop.” Available at http://www.rma.usda.gov/data/sob.html (accessed February, 2010).
U.S. Department of Agriculture. Risk Management Agency, Product Development Division. 2004. 2005 Crop Insurance Handbook (CIH). Washington DC, June. Available at
http://www.rma.usda.gov/FTP/Publications/directives/18000/pdf/05_18010.pdf (accessed
Table 1: First 25 rows of results sub-matrix corresponding to Method=1, Yield Distribution=Normal, SS=10, and CC=0. PSR PPR LR SS CC M1 M2 M3 N SUA SBA SUB SBB MAD BIAS 0.00 62.72 2.50 10 0 1 0 0 1 0 0 0 0 7.391 -0.111 0.01 63.12 2.50 10 0 1 0 0 1 0 0 0 0 7.391 -0.111 0.02 63.36 2.51 10 0 1 0 0 1 0 0 0 0 7.391 -0.111 0.03 63.64 2.52 10 0 1 0 0 1 0 0 0 0 7.391 -0.111 0.04 63.96 2.52 10 0 1 0 0 1 0 0 0 0 7.391 -0.111 0.05 64.28 2.53 10 0 1 0 0 1 0 0 0 0 7.391 -0.111 0.06 64.64 2.53 10 0 1 0 0 1 0 0 0 0 7.391 -0.111 0.07 65.28 2.53 10 0 1 0 0 1 0 0 0 0 7.391 -0.111 0.08 65.60 2.53 10 0 1 0 0 1 0 0 0 0 7.391 -0.111 0.09 65.92 2.54 10 0 1 0 0 1 0 0 0 0 7.391 -0.111 0.10 66.32 2.53 10 0 1 0 0 1 0 0 0 0 7.391 -0.111 0.11 66.92 2.53 10 0 1 0 0 1 0 0 0 0 7.391 -0.111 0.12 67.36 2.53 10 0 1 0 0 1 0 0 0 0 7.391 -0.111 0.13 67.68 2.54 10 0 1 0 0 1 0 0 0 0 7.391 -0.111 0.14 68.04 2.54 10 0 1 0 0 1 0 0 0 0 7.391 -0.111 0.15 68.60 2.54 10 0 1 0 0 1 0 0 0 0 7.391 -0.111 0.16 68.76 2.56 10 0 1 0 0 1 0 0 0 0 7.391 -0.111 0.17 69.16 2.56 10 0 1 0 0 1 0 0 0 0 7.391 -0.111 0.18 69.80 2.55 10 0 1 0 0 1 0 0 0 0 7.391 -0.111 0.19 70.00 2.57 10 0 1 0 0 1 0 0 0 0 7.391 -0.111 0.20 70.28 2.59 10 0 1 0 0 1 0 0 0 0 7.391 -0.111 0.21 70.60 2.61 10 0 1 0 0 1 0 0 0 0 7.391 -0.111 0.22 71.08 2.61 10 0 1 0 0 1 0 0 0 0 7.391 -0.111 0.23 71.56 2.61 10 0 1 0 0 1 0 0 0 0 7.391 -0.111 0.24 72.12 2.61 10 0 1 0 0 1 0 0 0 0 7.391 -0.111 0.25 72.56 2.62 10 0 1 0 0 1 0 0 0 0 7.391 -0.111
Note: PSR=Premium subsidy rate; PPR= Producer participation rate; LR=Loss-ratio; SS=Sample size; Mi=Method i (i=1,2,3); SUA,SBA,SUB
andSBB are the previously discussed non-normal distributions.
Table 2: Summary statistics for estimated models.
Scenario 1 (S1: SP versus TP)
Model Dep Var R2 Tot # Par NS α=0.001 NS α=0.01 NS α=0.10
(1) MAD 0.849 31 3 2 1
(2) BIAS 0.706 31 6 3 0
(3) LR 0.941 11 0 0 0
(4) PPR 0.875 11 1 1 1
Scenario 2 (S2: SP versus 1.25xTP)
Model Dep Var R2 Tot # Par NS α=0.001 NS α=0.01 NS α=0.10
(1) MAD 0.858 31 3 1 1
(2) BIAS 0.734 31 5 4 2
(3) LR 0.935 11 2 1 1
(4) PPR 0.805 11 0 0 0
Scenario 3a (S3a: SP versus TP+0.5xTPxZ)
Model Dep Var R2 Tot # Par NS α=0.001 NS α=0.01 NS α=0.10
(1) MAD 0.830 31 3 3 2
(2) BIAS 0.700 31 5 0 0
(3) LR 0.968 11 2 1 0
(4) PPR 0.932 11 1 0 0
Scenario 3b (S3b: SP versus TP+0.75xTPxZ)
Model Dep Var R2 Tot # Par NS α=0.001 NS α=0.01 NS α=0.10
(1) MAD 0.829 31 3 3 2
(2) BIAS 0.704 31 5 0 0
(3) LR 0.970 11 1 1 0
(4) PPR 0.933 11 1 1 1
Scenario 4 (S4: SP versus TP+0.5xSEP)
Model Dep Var R2 Tot # Par NS α=0.001 NS α=0.01 NS α=0.10
(1) MAD 0.837 31 3 1 1
(2) BIAS 0.705 31 5 5 3
(3) LR 0.752 11 1 0 0
(4) PPR 0.886 11 0 0 0
Scenario 5 (S5: SP versus 1.15xTP+0.25xSEP+0.5xTPxZ)
Model Dep Var R2 Tot # Par NS α=0.001 NS α=0.01 NS α=0.10
(1) MAD 0.840 31 3 3 2
(2) BIAS 0.702 31 4 2 1
(3) LR 0.925 11 1 1 1
(4) PPR 0.945 11 1 1 1
Notes: The scenarios are as explained in the “producer behavior scenarios” section, Dep Var, Tot # Par, and NS stand for the dependent variable, the total number of parameters in the model, and the number of non-significant parameters at the given α.
Table 3: Loss-Ratios (LR), Percentage Subsidy Rates (PSR), and Percentage Paid by Government (PPG), associated with CC=0.5 and various SS-M combinations and their corresponding MAD and BIAS statistics, for select scenarios (S1, S2, S3, S4, and S5) and a target producer participation rate (PPR) of 75%.
Scenario 1
(SP vs. TP) (SP vs. 1.25xTP) Scenario 2
M SS MAD BIAS LR PSR PPG M SS MAD BIAS LR PSR PPG
1 10 8.451 2.919 2.406 0.388 0.584 1 10 8.530 3.000 1.959 0.307 0.489 20 6.315 1.714 2.102 0.379 0.524 20 6.388 1.800 1.705 0.256 0.414 30 4.690 0.837 1.830 0.330 0.454 30 4.791 0.973 1.459 0.175 0.315 2 10 20 5.708 0.218 2.098 0.2834.554 -0.114 1.840 0.252 0.5230.456 2 1020 5.946 0.335 1.743 0.1574.666 -0.104 1.464 0.088 0.4260.317 30 3.910 -0.119 1.684 0.241 0.406 30 3.930 -0.170 1.278 0.051 0.217 3 10 8.757 3.478 2.395 0.411 0.583 3 10 8.894 3.604 1.943 0.334 0.485 20 6.766 2.199 2.148 0.404 0.534 20 6.818 2.231 1.743 0.286 0.426 30 5.286 1.248 1.930 0.361 0.482 30 5.287 1.230 1.542 0.205 0.352 Scenario 3a (SP vs. TP+0.5xTPxZ) Scenario 3b (SP vs. TP+0.75xTPxZ)
M SS MAD BIAS LR PSR PPG M SS MAD BIAS LR PSR PPG
1 10 8.812 3.405 2.621 0.512 0.618 1 10 8.906 3.505 2.924 0.610 0.658 20 6.539 1.978 2.394 0.513 0.582 20 6.591 2.035 2.748 0.607 0.636 30 4.790 0.916 2.183 0.480 0.542 30 4.812 0.942 2.570 0.575 0.611 2 10 5.759 0.261 2.378 0.417 0.579 2 10 5.796 0.297 2.717 0.515 0.632 20 4.556 -0.159 2.179 0.406 0.541 20 4.564 -0.153 2.555 0.506 0.609 30 3.876 -0.215 2.052 0.406 0.513 30 3.867 -0.226 2.446 0.504 0.591 3 10 20 8.797 3.586 2.600 0.5266.771 2.226 2.411 0.523 0.6150.585 3 1020 8.845 3.638 2.909 0.6226.787 2.243 2.761 0.615 0.6560.638 30 5.269 1.231 2.244 0.494 0.554 30 5.265 1.226 2.621 0.587 0.618 Scenario 4 (SP vs. TP+0.5xSEP) Scenario 5 (SP vs. 1.15xTP+0.25xSEP+0.5xTPxZ)
M SS MAD BIAS LR PSR PPG M SS MAD BIAS LR PSR PPG
1 10 20 8.890 3.222 1.832 0.4716.627 1.980 1.782 0.422 0.4540.439 1 1020 8.771 3.311 1.947 0.4766.496 1.908 1.857 0.437 0.4860.461 30 4.843 1.006 1.687 0.354 0.407 30 4.750 0.869 1.734 0.379 0.423 2 10 5.747 0.342 1.782 0.296 0.439 2 10 5.809 0.263 1.874 0.328 0.466 20 4.616 0.070 1.659 0.268 0.397 20 4.587 -0.156 1.736 0.301 0.424 30 3.963 0.067 1.584 0.260 0.368 30 3.893 -0.211 1.641 0.295 0.391 3 10 8.841 3.594 1.800 0.501 0.444 3 10 8.880 3.658 1.930 0.497 0.482 20 6.887 2.364 1.779 0.449 0.438 20 6.827 2.281 1.865 0.458 0.464 30 5.411 1.403 1.724 0.386 0.420 30 5.301 1.267 1.777 0.406 0.437 24
Table 4: Loss-Ratios (LR), Percentage Subsidy Rates (PSR), and Percentage Paid by Government (PPG), associated with CC=0.5 and various SS-M combinations and their
corresponding MAD and BIAS statistics, for scenario 5 (S5) for a target producer participation rate (PPR) of 90%. Scenario 5 (SP vs. 1.15xTP+0.25xSEP+0.5xTPxZ) M SS MAD BIAS LR PSR PPG 1 10 7.341 2.512 2.552 0.657 0.608 20 5.466 1.373 2.477 0.606 0.596 30 4.121 0.600 2.385 0.553 0.581 2 10 20 3.971 0.062 2.347 0.510 0.574 3.148 -0.091 2.268 0.493 0.559 30 2.855 0.121 2.267 0.509 0.559 3 10 6.535 3.234 2.535 0.736 0.606 20 4.881 2.120 2.483 0.676 0.597 30 3.756 1.371 2.423 0.622 0.587
Table 5: Annual average performance statistics for the RMA’s Actual Production History (APH) Multiple-Peril Crop Insurance (MPCI) Plan (http://www.rma.usda.gov/data/sob.html).
Year
Total
Premium ($) Subsidy ($) Indemnity ($) Loss Ratio PPG
2009 1,862,682,637 1,212,677,088 1,264,707,917 1.95 0.486 2008 1,543,855,694 1,022,253,759 1,045,382,478 2.00 0.501 2007 1,216,378,501 802,037,277 923,747,958 2.23 0.551 2006 1,055,168,464 690,594,295 936,820,774 2.57 0.611 2005 1,170,165,869 758,066,651 703,092,080 1.71 0.414 2004 1,043,130,487 683,824,258 723,783,926 2.01 0.504 2003 1,111,490,683 719,426,854 1,016,194,064 2.59 0.614 2002 1,223,260,523 778,368,061 1,540,638,240 3.46 0.711 2001 1,295,725,647 820,051,619 1,362,388,279 2.86 0.651 2000 1,325,535,970 631,965,635 1,439,172,881 2.08 0.518 1999 1,358,427,757 682,271,366 1,359,474,910 2.01 0.503 Ave 1,291,438,385 758,885,978 1,119,582,137 2.32 0.551
Note: PPG=Percentage Paid by Government.
Table 6: Loss-Ratios (LR), Percentage Subsidy Rates (PSR), and Percentage Paid by
Government (PPG), associated with various Risk Protection Premiums (RPP) and Producer and Insurer MAD statistics (PMAD and IMAD) under the sixth scenario (S6).
Sub-Sc PPR RPP PMAD IMAD LR PSR PPG
6a 75% 0.00 4 4 1.67 0.26 0.40 6b 75% 0.00 4 2 1.29 0.15 0.22 6c 75% 0.00 4 6 2.16 0.35 0.53 6d 75% 0.00 2 4 1.70 0.25 0.41 6e 75% 0.00 4 4 1.67 0.26 0.40 6f 75% 0.00 6 4 1.54 0.30 0.35 6g 75% 0.00 4 4 1.67 0.26 0.40 6h 75% 0.15 4 4 1.47 0.26 0.32 6i 90% 0.00 4 2 1.38 0.26 0.27 6j 90% 0.00 4 4 1.82 0.41 0.45 6k 90% 0.00 4 6 2.30 0.52 0.56 6l 90% 0.15 4 4 1.58 0.40 0.37
Notes: Sub-Sc stands for Sub-Scenario, PPR is the desired Percentage Participation Rate, PMAD is the MAD of the producer’s estimate of his/her actuarially fair premium, and IMAD is the MAD of the insurer’s estimate relative to the producer’s estimate.
Table 7: Annual average performance statistics for the RMA’s Crop Revenue Coverage (CRC) Plan (http://www.rma.usda.gov/data/sob.html).
Year
Total
Premium ($) Subsidy ($) Indemnity ($) Loss Ratio PPG
2009 4,367,572,316 2,645,518,256 2,190,463,687 1.27 0.214 2008 2,219,011,108 1,257,088,180 1,972,654,193 2.05 0.512 2007 1,874,783,620 1,049,065,786 1,165,147,323 1.41 0.291 2006 1,417,938,583 798,189,879 1,267,734,894 2.05 0.511 2005 1,002,323,347 564,234,738 482,229,181 1.10 0.092 2004 1,326,218,311 752,374,551 946,584,025 1.65 0.394 2003 1,023,468,000 586,583,591 1,089,071,338 2.49 0.599 2002 854,004,399 475,059,665 1,507,694,149 3.98 0.749 2001 1,228,983,610 677,450,847 1,159,592,000 2.10 0.524 2000 908,387,353 366,906,473 805,199,750 1.49 0.328 1999 727,761,996 354,636,053 798,400,704 2.14 0.533 Ave 1,540,950,240 866,100,729 1,216,797,386 1.98 0.431
Note: PPG=Percentage Paid by Government.
27 Glossary of Acronyms
APH: Actual Production History MPCI: Multi peril crop insurance BIAS: Average difference between the
estimated and true premiums
PMAD: MAD of the producer’s estimate of his/her actuarially fair premium
CC: Correlation coefficient PPG: Percentage of total indemnity-related program cost paid by the government CRC: Crop Revenue Coverage PPR: Producer participation rate CV: Coefficient of variation PSR: Percentage subsidy rate
D: Distribution RMA: Risk Management Agency
EP: Estimated premium RPP: Risk-protection premium FE: Farmer's estimate of true premium S: Scenario
IMAD: MAD of the insurer’s estimate relative to what the producer believes to be his/her actuarially fair premium
SEP: Scaled insurer's premium estimate
LR: Loss-ratio SP: Subsidized premium
M: Method SS: Sample size