Potravinarstvo, vol. 10, 2016, no. 1, p. 656-662 doi:10.5219/679
Received: 3 November 2016. Accepted: 16 December 2016. Available online: 19 December 2016 at www.potravinarstvo.com © 2016 Potravinarstvo. License: CC BY 3.0 ISSN 1337-0960 (online)
THE ECONOMIC IMPACT OF REDUCED VALUE ADDED TAX RATES FOR
GROCERIES
Slavomíra Martinková, Anna Bánociová
ABSTRACT
The value added tax represents one of the most important sources of state budget revenues of EU Member States. The basic value added tax rate is in the EU currently between 15% in Luxembourg to 27% applied in Hungary. The revenues from this tax represent an average of 17.5% of all tax revenues of EU countries and create an average GDP of 7.0% (year 2016, EU 28). As revenues from value added tax represent a stable income of state budget, the legislative changes in the system of value added tax, mainly its reductions as well as its imposition on groceries, can significantly influence further macroeconomic development. In the last year, the government of the Slovak Republic implemented changes in universal indirect taxing in such way that in addition to the standard value added tax rate of 20%, the Act No. 268/2015 on Value added tax adopted in 2016 a decreased value added tax rate of 10% on selected groceries, in order to support domestic producers and reduce the tax burden of low-income and middle-income groups. According to the European Commission (2007), the reduced rate of value added tax in selected cases has its justification and importance in the country’s economy. The aim of this paper is to analyse the economic impact of the applied reduced value added tax on food in the Slovak Republic in the context of household expenditures and revenues of the state budget.
Keywords: reduced VAT rate on groceries; VAT rates; tax revenues; expenditure of household
INTRODUCTION
A modern system of value added tax (VAT) creation within the European Union should be in line with the goal of increasing the economic activity and ensuring the functioning of the internal market. The uniform VAT system is a part of Council Directive 2006/112/ES on common system of VAT, with the view to a neutral competition and harmonization of VAT legislation, including tax rates harmonization. The Member States committed with the adoption of this Directive to apply the standard VAT rate, fixed at a percentage of a taxable amount, which would be equal for both provided goods and services and not lower than 15%. At the same time they committed to apply a maximum of two reduced rates on selected categories listed in the annex to that Directive, and these rates must be at the percentage of at least 5%, with the exception of lower rates only if these lower rates existed before 1993. The VAT system is currently used by almost all of the most advanced economies of the world, which were joined also by Slovakia when the Act No. 222/1992 on Value Added Tax was adopted (European Commission, 2016; Bánociová, 2009; Šoltés and Jakubíková, 2008; Mihóková et al., 2016). This Act has been amended several times and the last amendment, effective since the 1st of January 2016, added a reduced VAT rate on selected foods at 10%, while these foods account for about 5% of the consumer basket.
Foods have a special position in household’s consumption basket, which has been confirmed by several analysis, as they represent significantlly higher share of the total household costs compared to the share of other goods
and services (Syrovátka, 2011) and they represent significantlly higher share of the total household costs compared to the share of gainful employment (Kozelová et al., 2011) and to the share of environmental education
(Kozelová et al., 2013; Kozelová et al., 2010). The World Bank (2016) states that the purchase of goods, beverages and tobacco represent more than 20% of total households‘ costs in the countries with high level of incomes, 30% of total households‘ costs in the countries with the middle-incomes and low-income countries account for 50% of total households‘ costs. Within the EU, most of the economies are considered to be economies with high level of incomes, which supports the assumption that the share of households‘ costs on the total purchases of goods represents estimated 20%. Despite this, the relatively high level of income distribution disparities in the countries, encourages the economic authorities to introduce reduced VAT rates in particular on food, in order to decrease tax burden of low-income and middle-income groups of households. The structure of household’s expenditures distribution results from the functional demand system (Deaton, 1986), the effects of indirect taxes on the public economies (Myles, 1996) and from consumer decisions influenced by economic factors
(Koutsoyiannis, 1979), healt factors (Čapla et al., 2008; Zajác et al., 2012; Šoltés and Gavurová, 2015) and social factors (Nicholson, 1992; Šoltés and Gavurová, 2016).
The aim of this paper is to analyse the economic impact of reduced VAT on foods in the Slovak Republic (SR). Categorically we can state that implementation of reduced
VAT on selected types of groceries creates a space for broader economic consequences associated with the changes in household’s consumption, as well as the changes in efficiency of occurred costs, income distribution in the country and with the change in pricing process (Oosterhius, et al., 2008).
The paper is divided into three parts. The first part presents the theoretical implications of reduced VAT rate on food. The second part is devoted to the methodology and the possible options of VAT examination at international level. The third part is focused on the analyses and assessment of consequences of reduced VAT on food in conditions of Slovakia.
Economic significance of implementing reduced
VAT on selected food
Knowledge of the impacts of tax changes contributes to the understanding of distribution effects of tax systems.
Aasness et al., (2002) analyse the mentioned effects of indirect taxes, out of which the major tax reform is the impact of the reduced VAT on all goods and specifically on food.
Tax reduction or transfer increase lead to a partial increase of household’s living standard because it allows an increase of private consumption. On the other side, within the distribution effects of indirect taxes, Holman (2002) points out the growth of goods‘ prices and restrictions in private consumption. The rice in prices does not suppress incentives for tax evasion.
From the macroeconomic point of view, the consumption taxation is the most often analysed by examining the estimated impact of hypothetical VAT unification on households (Crawfood et al., 2010), by examining the distributional impact of previous VAT changes on households (Klazar et al., 2007; Dušek and Janský, 2012), respectively by microsimulation of VAT reforms effects (Åvitsland and Aasness, 2004). The results confirm that the impact of reduced VAT on food affects the growth of equality levels between economic entities. The distribution effects of tax changes and the impact of reduced VAT on food are the most commonly measured by aggregate indicators of living standards to the consumption of households (Aasness, Benedictow and Hussein, 2002). Dráb and Mihóková (2013) expect that the economic growth will fluctuate in the same direction as the aggregate consumption, as consumption is one of the components of GDP. Determining the impact of VAT rate changes on country’s economy represents a very complex issue and Andrejovská and Martinková(2016). Consider also GDP being the most important classifier of changes. Subsequent development of changes in VAT rate on food significantly influences also the trends in agricultural market (Harčariková, 2015).
The standard research of VAT usually analyses a horizontal supply curve, where the tax burden is passed on the consumer (Stiglitz, 2000). The reduced VAT rate leads to different theoretical assumptions. Introduction to optimal indirect taxation at a reduced VAT was studied by
Ramsey (1927) and later applied by Boiteux (1956). Also
Ahmad and Stern (1984) analysed the optimal indirect taxation. The conclusions of the authors show that VAT decrease leads to lower prices of goods and to increased
demanded quantity in such manner that tax revenues are partially returned to their hypothetical previous level. The precondition to such situation is a sufficiently high demand elasticity.
Decrease in VAT rate in the context of pricing process changes was studied by Crum et al., (1942). Reduced indirect universal tax categorically does not preclude maintaining a price of selected commodities at the same level and that is for two reasons. First, market conditions may be adjusted in a way that the total price paid by consumer is not affected by any tax change. Reduced VAT rate represents a profit for seller. Secondly, the conditions controlling the market price of commodity function in such way that a positive VAT rate change actually reduces the value of commodity in its full amount. Reduced tax rate represents a decrease of seller’s revenues (Mura, Buleca, Hajduová and Andrejkovič, 2015). Carbonnier‘s paradox (2005) reflects the changes in VAT rates into the prices of goods by analysing the competitive environment. The increase of VAT rate is transferred to customer in a higher extent than it is in case of the adequate VAT rate decrease. Similar conclusions were reached by
Benkovskis and Fadajeva (2013).
Within the economic significance of implementing the reduced VAT rate on food, it is desirable to further investigate the impact of reduced VAT on food in the context of food prices, short-term household spending, income equality of individual population groups and in the context of country’s economic growth.
MATERIAL AND METHODOLOGY
Possibilities of international comparison of value added tax allow to track the selected indicator based on the analysis of economic activity of individual taxes or based on tax entities in the economic environment of a given state. Database of Organisation for Economic Co-operation and Development (2016), European Commission (2016) and Eurostat database (Eurostat, 2016) follow the VAT rates through standard and reduced VAT rates, as revenues of the state budget in its absolute amount, expressed in national currency, respectively in its relative amount in relation to total tax revenues or as % of GDP.
In order to fulfil the aim of this paper, the analytical part is divided into three parts. The first part presents a qualitative analysis, which compares standard and reduced VAT rates on food in selected EU countries, in order to capture the specifics of tax systems in 2016. The second and third part represent a quantitate analysis. The second part follows the development of household’s expenditures on non-durable and semi-durable goods, as previous studies (EU Commission, 2007) argues that lower VAT rates should improve the overall fairness. This implies the creation of more equal income distribution and promotion of good consumption with the intention to map the position of individual EU countries in the context of reduced tax on selected food. The third part uses non-hierarchical clustering methods with the aim to identify the unique categories of tax characteristics of selected clusters in order to capture the economic position of Slovakia in a particular cluster.
Selected variables are categorized for individual countries in two groups:
• tax variables, such as VAT rate in its standard and reduced form in the context of its application to food, the share of VAT revenues as % of GDP whereas the changes and adjustments of VAT rates impact the revenues of state budget,
• macroeconomic variables, such as household consumption expressed as a share of household expenditures on non-durable, semi-durable goods and services as percentage of GDP, the equality of living standard determined by indicator 1 – Gini coefficient, which is a key measure of inequality stated in the economic literature (Aaberge, 2001). The data are obtained from the OECD database (OECD, 2016), Eurostat database (Eurostat, 2016) and from the report of European Commission. The analyses were processed through software R.
Analysis of implementation of reduced VAT rates
on food in selected EU countries
The analytical part of the paper is divided into three parts and those are the qualitative analysis of reduced VAT rates on food, the quantitative analysis of impact of reduced VAT rates on food in the context of household expenditures on consumption of non-durable goods and the third part presents the position of SR in international comparison of reduced VAT rate on food.
Qualitative analysis of reduced VAT rate on food
The first part of the analysis studies the currently implemented reduced VAT rates on food in individual EU Member States and their comparison with the standard VAT rates. Figure 1 below illustrates the aforementioned VAT rates as published by the European Commission
(2016) to January 2016, expressed as a percentage.
When analysing the reduced VAT rates on selected food, we study several differences in EU28 countries. Currently, the lowest VAT rate on food is applied in the United Kingdom (UK) at 0%. On the other side, the highest rate is currently used in Hungary (HU) at 22%. The categories of reduced VAT rate on food by subject of taxation is shown below in Table 1.
In most countries, the most commonly applied reduced VAT rate is the rate for particular individual group of foods, divided into categories of basic groceries, selected foods (bread, butter, milk and other) and food for infants. Most countries use at least one reduced VAT rate. Out of the five clusters, the cluster with the highest number of countries with the reduced VAT rate is the cluster with selected foods, further divided in several categories. CZ applies the reduced VAT rate on food classified as essential baby food (10%) and on food in general VAT rate of 15%. HU uses the reduced VAT rate mainly on wild pigs, cattle and sheep (4%) and other food is taxed by VAT rate of 18%. Similarly in IE, where the reduced rate is applied on livestock used for food preparation (4.8%) and further 9% and 13.5% VAT. HR introduced 5% on selected foods (bread, milk and baby food) and on food in general VAT of 13%. IT also applies two rates on food of 4% and 10%, the same like in PL 5% and 8%, in PT 6% and 13%, on FR 5.5% and 10% and in ES 4% and 10%. The reduced rate on all basic groceries is used in CY and EL. All groceries are taxed by the reduced rate in LU, NL and SI. BE includes in selected foods also „takeaway“ food. In contrary, some countries restrict the usage of reduced VAT rates only on narrow scale of food, e.g. in LV i tis only baby food. DK is the only EU country which applies only one rate, without the existence of reduced rates.
Figure 1 Standard VAT Rates And Reduced VAT Rates on Food by the EU Member States (European Commission, 2016).
Table 1 Basic categories of foods based on the implementation of reduced VAT rates on food in the EU Member States.
Without reduced VAT rate BG, DK, EE, LT
Selected foods BE, CZ, DE, ES, FR, HR, HU, IE, IT, LV , PL, PT, RO, SE, SK
Foods supporting agro-food producers FI,
Food LU, NL, SI
Basic groceries AT, CY, EL, MT, UK
Slovakia has joined other European countries by introducing the reduced VAT rate of 10% and this rate is applied only on selected category of food. The average reduced rate represents 9.14%, which is slightly less than rate in SR.
The impact of reduced VAT rate in the context of short-term household expenditures and equalities of income distribution in country
The second part of the analysis tracks the impact of reduced VAT rate in the context of short-term household expenditures spent on non-durable or semi-durable goods and services, for the period of second quarters of 2015 and 2016. The previous studies (EU Commission, 2007) argue that lower VAT rates should improve the overall fairness, which implies the creation of a more equal income distribution and should increase the consumption of goods. The first argument generates more equal income distribution on consumption, especially of cheaper goods. Expenditure on such goods shall include expenditures of household’s day to day needs. Decrease in VAT on food affects households in changing their consumption in a positive way.
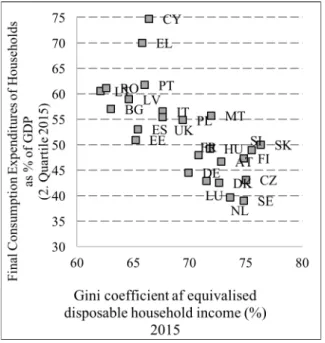
The second argument is based on the observation that the reduced VAT rates on selected goods could promote consumption of other goods in case of excess consumption value. In the context of effectiveness of reduced VAT rate, its impact is influenced by the level of income distribution. The standard of living in the country is monitored by the indicator 1 – Gini coefficient. The more the value is closer to 1, the income distribution is more equal (Aaberge, 2001).Data on the Gini coefficient are published annually by Eurostat (Eurostat, 2016) and they are tracked in this paper for two latest available periods 2014 and 2015. The assumption is a shift of income distribution impact on household expenditures by one period backwards. The results of comparison of two indicators are shown on graphs below (Figure 2 and Figure 3).
OECD indicates the average amount of total expenditures
at 60% of GDP, while the expenditures on non-durable consumption represent on average 52.47% (2015) and 52.42% (2016) in EU28. The average value of living standard reached 69.48%. Thus the countries represent the economies with a greater income equality in a long term. The increase of the Gini coefficient values occurred in countries with different socio-political profiles, but certain characteristic differences remained unchanged. The highest equality is reported in SI, FI, SE, DK and NL. In countries with a low share of household expenditures and lower VAT rate on food, a reduced VAT rate has only a limited impact on income distribution and the associated compliance costs are relatively low, e.g. SE, LU, NL. In countries with a high share of household expenditures on non-durable consumption, the reduced rate should have a greater impact on income distribution, e.g. CY, EL, RO. In the case of Slovakia, the development of household expenditures on non-durable consumption did not change significantly as it slightly decreased by 0.6% to 50.0%. The data show that the household expenditures on non-durable consumption represent stable and easily estimable expenses, which did not change significantly during two monitored periods. VAT decrease had no significant impact on changes in household consumption of non-durable and semi-non-durable goods. The coefficient of equality of disposable incomes increased in SR to 76.3%, which represents an increase of 2.4%. Compared internationally, Slovakia is among the countries with the lowest income differences. Thus it ranks to the group of countries such as SI, SE, CZ.
Position of SR in international comparison with EU countries in the context of reduced VAT rate on food
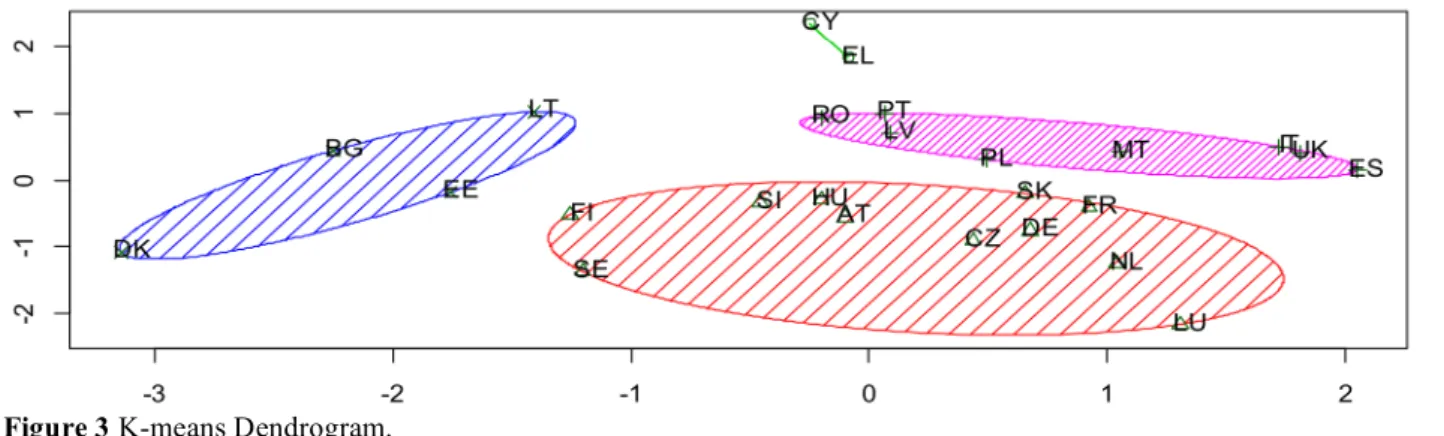
The third part of the analysis is based on non-hierarchical clustering procedures, k-means method of non-hierarchical clustering and on the assumption of optimal number of 4 clusters. The non-hierarchical clustering input variables include data on the level of tax rate on food in the country in 2016, data on final short-term household expenditures in
Figure 1 Interdependence between final short-term expenditures of households and living standards in country in 2015.
Figure 2 Interdependence between final short-term expenditures of households and living standards in country in 2016.
the second quarter of 2016, the expected revenues from VAT in 2016 determined as the average of previous 8 years. The result is shown as clusters of two, four, eight and eleven countries (Error! Reference source not found.). Input variables are shown below in Error! Reference source not found..
The first cluster is characterized by significantly lower average VAT rate on food (5%) than the other clusters and includes also countries with zero or low VAT rate. The average amount of VAT revenues represents 6.90% of GDP and household expenditures on non-durable consumption are at 57.13% of GDP. The second cluster contains the highest number of countries and the VAT rate ranges from 3% (LU) to 14% (FR). What matters is the amount of VAT revenues, which is at 7.50% of GDP and represents an average value of countries in this cluster. The household expenditures in this cluster are reported at below average level (EU average is 52.06% of GDP). The third cluster represents the countries with the above average level of VAT revenues and also the above average value of household expenditures on non-durable consumption. The last cluster is characterized primarily by the countries that do not apply the reduced VAT rate on food. The amount of VAT revenues represents on average 8.7% of GDP and the household expenditures on non-durable consumption are at 53.22% of GDP. Within the 28EU Member States were identified differences in reduced VAT rates, as well as in tax revenues and household expenditures. These differences are in the macroeconomic indicators of countries, but also in the economic policies of individual governments. Remeta (2015) notes thatchanges in VAT will affect in SR mainly the wealthier households and that to support the tax progressivity should be used fiscal Instruments, since VAT decrease is reflected in consumer prices only partially. Transfer of selected food in the group of commodities with the reduced VAT rate has no significant negative impact
on state budget, as it is mainly the compensation of VAT rate change from 19% to 20%.
CONCLUSION
The improving macroeconomic situation encourages the countries to implement an expansive fiscal policy, which uses the reduced VAT rate on selected food as one of its instruments. In order to analyse the economic impact of introducing reduced VAT in SR, the paper concludes that the reduced VAT on food has been implemented by majority of EU countries benefiting from the reduced Vat rate on selected food. The country created opportunities for wider economic consequences associated with the change in household consumption. By implementing the reduced VAT rate on selected food, Slovakia has been ranked among the countries with the lowest income differences and the average household expenditures on non-durable goods, while the introduction of reduced VAT rate has no significant impact on the development of tax revenues.
The interim results in the area of VAT revenues indicate that the introduction of reduced VAT on food can be considered as a positive measure of the government.
REFERENCES
Aasness, J., Benedictow, A., Hussein, M. F. 2002. Distributional efficiency of direct and indirect taxes.
Economic Research Programme on Taxation Report, no. 69, p. 50.
Act No. 222/1992 Coll. on value added tax. The National Council of the Slovak Republic.
Ahmad E., Stern, N. 1984. The Theory of Reform and Indian Indirect Taxes. Journal of Public Economics, vol. 25, no. 3, p. 259-298. https://doi.org/10.1016/0047-2727(84)90057-4
Andrejovská, A., Martinková, S. 2016. The Impact of Value Added Taxes Rates on the Economy of the
Figure 3 K-means Dendrogram.
Table 2 Cluster classification of the EU member states through K-means method, 2016.
Cluster Countries Reduced
VAT rates
Revenues VAT (as % of GDP)
Expenditure of Household (as % of GDP)
1. cluster ES, IT, LV, MT, PL, PT, RO, UK 5.00 % 6.90 % 57.13 %
2. cluster AT, CZ, DE, FI, FR, HU, LU, NL, SE, SI, SK
8.36 % 7.50 % 44.25 %
3. cluster CY, EL 9.00 % 7.76 % 72.35 %
4. cluster BG, DK, EE, LT 21.50 % 8.71 % 53.22 %
European Union Countries using Data Mining Approach.
Journal of Applied Economic Sciences, vol. 6, no. 44, p. 1084-1096.
Åvitsland, T., Aasness, J. 2004. Combining CGE and microsimulation models: Effects on equality of VAT reforms. Discussion Papers No. 392, October 2004. Statistics Norway, Research Department. 42 p.
Bánociová, A. 2009. Analýza vývoja dane z pridanej hodnoty v Slovenskej republike (Analysis of the development of value added tax in the Slovak Republic).
E&M Ekonomie a management, no. 4, p. 104-115.
Benkovskis, K., Fadejeva, L. 2013. The Effect of VAT Rate on Price Setting Behaviour in Latvia, Evidence from CPI Micro Data, Working Paper, no. 01. Riga : Latvijas Banka, 48 p.
Boiteux, M. 1956. Sur la gestion des Monopoles Publics astreints a l’equilibre budgetaire (The management of public monopolies subject to budgetary equilibrium).
Econometrica, vol. 24, no. 1, p. 22-40.
https://doi.org/10.2307/1905256
Čapla, J., Zajác, P., Golian, J. 2008. Nový návrh nariadenia Európskeho parlamentu a rady o poskytovaní informácií o potravinách spotrebiteľom. Potravinarstvo,
vol. 2, no. 2, p. 5-8.
http://www.potravinarstvo.com/dokumenty/potravinarstvo _no2_2008.pdf
Carbonnier, C. 2005. Is tax shifting asymmetric? Evidence from French VAT reforms, 1995-2000. Working Papers, no. 34. Paris : Paris-Jourdan Sciences Economiq, 24 p.
Council directive 2006/112/EC of 28 November 2006 on the common system of value added tax. OJ L 347, 11.12.2006, p. 1–118
Crawford, I., Keen, M., Smith S. 2010. Value added tax and excises. In Mirrlees, J. Adam, S., Besley, T., Blundell, R., Bond, S., Chote, R., Gammie, M., Johnson, P., Myles, G., Poterba, J. (eds.) Dimensions of tax design: the Mirrlees review, p. 275-365. ISBN 978-0-19-955375-4.
Crum, W. L., Fennelly, J. F., Seltzer, L. H. 1942. Fiscal Planning for Total War. Cambridge : NBER, 358 p.
Deaton A. 1986. Demand Analysis. In Griliches Z., Intriligator, M. D. (eds.): Handbook of Econometrics, vol. 3, no. 30, p. 1767-1839.
Dráb, R., Mihóková, L. 2013. Determinants of Fiscal Consolidation Success in V4 Countries, In Mirdala, J. (Ed.) Financial Aspects of Recent Trends in the Global Economy, vol. 2, Craiova, Romania : ASERS Publishing, p 220-243.
Dušek, L., Janský, P. 2012. Dopady změn daně z přidané hodnoty na reálné příjmy domácností (Impact of changes in the value added tax on real incomes of households).
Politická ekonomie, vol. 60, no. 3, p. 309-329.
https://doi.org/10.18267/j.polek.844
EU Commision. 2016. VAT Rates Applied in the Member States of the European Union, Situation at 1st January 2016. Bruxells: Final report.
EU Commission. 2007. Taxation papers. Study on reduced VAT applied to goods and services in the Member States of the European Union, EU Commission: Working paper No. 13-2007. 108 p.
Eurostat, 2016. Eurostat© Database [online] s.a. [cit. 2016-10-15] Available at: http://ec.europa.eu/eurostat/data/database.
Harčariková, M. 2015. Proposal of new outperformance certificates in agricultural market. Agricultural Economics (Zemědělská Ekonomika), vol. 61, no. 9, p. 400-409.
Holman, R. 2002. Ekonomie. 3rd ed. Praha, Czech Republic : Nakladatelství C. H. Beck, 726 p. ISBN 80-7179-681-6. 726 p.
Klazar, S., Slintáková, B., Svátková, S., Zelený, M. 2007. Dopad harmonizace sazeb DPH v ČR. Acta Oeconomica Pragensia, vol. 15, no. 1, p. 45-55.
Koutsoyiannis A. 1979. Modern Microeconomics. 2nd ed. London : Macmillan. 581 p. ISBN 0-333-25349-3.
https://doi.org/10.1007/9781349160778
Kozelová, D., Mura, L., Matejková, E., Lopašovský, Ľ., Vietoris, V., Mendelová, A., Bezáková, M., Chreneková, M. 2011. Organic products, consumer behaviour on market and european organic product market situation.
Potravinarstvo, vol. 5, no. 3, p. 20-25.
https://doi.org/10.5219/96
Kozelová, D., Vietoris, V., Fikselová, M. 2013. Quality and Availability of Organic Foods by Slovak Consumers.
Potravinarstvo, vol. 7, no. 1, p. 146-150.
https://doi.org/10.5219/306
Mihóková, L., Andrejovská, A., Buleca J. 2016. Estimation of vat gap in Slovak Republic. Actual Problems of Economics, vol. 180, no. 6, p. 327-336.
Mura, L., Buleca, J., Hajduova, Z., Andrejkovic, M. 2015. Quantitative Financial Analysis of small and medium food enterprises in a developing country.
Transformation in Business & Economics, vol. 14, no. 1, p. 212-224.
Myles, G. 1996. Imperfect Competition and the Combination of Ad Valorem and Specific Taxation.
International Tax and Public Finance, vol. 3, no. 1, p. 29-44. https://doi.org/10.1007/BF00400145
Nicholson, W. 1992. Microeconomic Theory, Basic Principles and Extensions. 5th ed. Fort Worth : Dryden Press, 762 p. ISBN 0-03055043-2.
OECD, 2016. Organisation for Economic Co-operation and Development© Database [online] s.a. [cit. 2016-10-15] Available at: https://data.oecd.org/.
Oosterhius, F., Rayment, M., Varma, A, Jantzen, J, van der Woerd, H, Mudgal, S, Tinetti, B., Gerdes, H., Neubauer, A, Stocker, A, Dodoková, A, Greño, P. 2008.
The use of differential VAT rates to promote changes in consumption and innovation. Final report. Amsterdam, Netherland : Institute for Environmental Studies. 150 p.
Ramsey, F. 1927. A Contribution to the Theory of Taxation. Economic Journal, vol. 37, no. 145, p. 47-61.
https://doi.org/10.2307/2222721
Remeta, J., Perret, S., Jareš, M., Brys, B. 2015. Moving Beyond the Flat Tax – Tax Policy Reform in the Slovak Republic, OECD Taxation Working Papers, no. 22. p. 80.
https://doi.org/10.1787/5js4rtzr3ws2-en
Šoltés, M., Gavurová, B. 2016. Economic aspects of social services development in Slovakia in the context of demographic changes. Scientific papers of the University of Pardubice. Series D, Faculty of Economics and Administration, no. 37, p. 14-25.
Šoltés, V., Gavurová, B. 2015. Modification of Performance Measurement System in the intentions of Globalization Trends. Polish Journal of Management Studies, vol. 11, no. 2, p. 160-170.
Šoltés, V., Jakubíková, E. 2008. Taxation and Public Finance in the Slovak Republic. Taxation and Public Finance in Transition and Development Economies, p. 603-308. https://doi.org/10.1007/978-0-387-25712-9_32
Stiglitz, J. E. 2000. Economics of the Public Sector, 3rd Ed., New York : W. W. Norton and Company. 823p. ISBN 0393966518.
Syrovátka, P. 2011. Effects of changes in the tax environment on the consumer demand for food.
Agricultural Economics, vol. 57, no. 7, p. 350-355. World Bank, 2016. World Bank Group© Database [online] s.a. [cit. 2016-10-15] Available at: http://data.worldbank.org/.
Zajác, P., Tomáška, M., Murárová, A., Čapla, J. and
Čurlej, J. 2012. Quality and Safety of Raw Cow’s Milk in Slovakia in 2011. Potravinarstvo, vol. 6, no. 2, p. 64-73.
https://doi.org/10.5219/189 Contact address:
Ing. Slavomíra Martinková, Technical University of Košice, Department of Finance, Němcovej 32, 040 01 Košice, Slovakia, E-mail: slavomira.martinkova@tuke.sk. Assoc. prof. Anna Bánociová, PhD., Technical University od Košice, Department of Finance, Němcovej 32, 040 01 Košice, Slovakia, E-mail: anna.banociova@tuke.sk.