Rural Livelihoods: Interplay Between Farm Activities, Non-farm
Activities and the Resource Base
Marijke Kuiper
(marijke.kuiper@wur.nl)Gerdien Meijerink
(gerdien.meijerink@wur.nl)Derek Eaton
(derek.eaton@wur.nl)International Trade and Development, Public Issues Division Agricultural Economics Research Institute (LEI) – Wageningen UR
P.O. Box 29703 2502 LS The Hague
The Netherlands
Contributed paper prepared for presentation at the International Association of Agricultural Economists Conference, Gold Coast, Australia, August 12-18, 2006
Copyright 2006 by M. Kuiper, G. Meijerink and D. Eaton. All rights reserved. Readers may make verbatim copies of this document for non-commercial purposes by any means, provided that this
A concentration of poor in rural areas has resulted in a research and policy focus on agricultural technologies and (poor) households’ impact on soil productivity. But farm households do not live of farming alone, non-farm activities play a principal role even in remote areas. With a unique household-level dataset covering seven regions in Africa and two in Asia we analyze (1) the importance of non-farm income in different geographical zones; (2) the role of geographical factors in determining access to non-farm employment; (3) the role of non-farm income in external input use and soil nitrogen balances. Distinguishing geographical zones based on the distance to urban areas we find the share of non-farm income increasing from 12 percent in the remote areas to 35 percent in peri-urban areas. Geographical location is found to explain a major part of the variation in individual non-farm participation, besides characteristics like education and gender. At household level we find non-farm income not playing a role of significance in explaining external input use, inorganic fertilizer use nor changes in the nitrogen balance. Households thus appear not to invest non-farm income in agriculture. This limits the contribution of non-farm income to reducing widespread soil nutrient depletion witnessed in Africa.
Despite ongoing urbanization over 70 percent of world’s poor are still located in rural areas (IFAD 2001). Agriculture plays an important part in their livelihood. Research on poverty reduction therefore tends to focus on agricultural technologies (IAC, 2004; Mellor, 2001; Thirtle et al., 2003) and on the impact of (poor) households’ land use decisions on natural resources to maintain future productivity (Shiferaw and Holden, 1998; Scherr, 2000; Drechsel et al., 2001; Barbier, 1998). But farm households do not live from farming alone. Non-farm activities play an important role in rural households’ income and livelihoods, even in areas commonly perceived to be subsistence-oriented, such as Sub-Sahara Africa. In a rare worldwide comparison of the importance of non-farm income in developing countries, Africa ranks first with 42 percent of total rural income, followed by Latin America (40 percent) and Asia (32 percent) (Reardon, 1998).
Non-farm activities thus play a principal role: directly, by contributing considerably to rural households’ income; and indirectly, by influencing agricultural activities with potential implications for sustainability. Pressure on natural resources may be reduced when households have alternative sources of income. Furthermore, investments in the resource base, such as the use of fertilizer, might be facilitated by cash income from non-farm activities. Very little research linking non-farm activities with natural resource management has been undertaken and as far as we know, no study has linked soil conservation management to non-farm activities. One study has looked at the impact of non-farm employment on the natural resource base in Chile and concludes that as members of communities have taken more non-farm jobs, the demographic pressure on the natural resource base
declined, although some threatening agricultural practices have not diminished, notably livestock grazing and gathering of firewood (Bahamondes, 2003).
Our objective is to analyze the role of non-farm activities in rural households’ livelihood strategies and the implications for the sustainability of natural resource use. Based on existing literature we develop a conceptual framework for analyzing links between non-farm activities and agriculture. The conceptual framework indicates the importance of local conditions and changes over time in the links between farm and non-farm activities. This implies that analyses and policies need to be location and time-specific. Using a unique household-level dataset pulled together from different DLO-IC1 projects and covering different regions in Africa and Asia we analyze the importance of non-farm income for households and their agricultural production decisions. We start by assessing the importance of non-farm activities at household level, followed by an analysis of the factors determining an individual’s access to non-farm activities. The third and last step of the analysis focuses at the role of non-farm activities on external input use in agriculture and soil nitrogen balances. We conclude by deriving implications for policies aimed at reducing poverty and promoting sustainability through promoting both agricultural and non-agricultural household activities.
The importance of location for non-farm employment
Promoting non-farm employment2 is gaining attention as a strategy for reducing poverty (Ellis and Harris, 2004; Van der Walle and Cratty, 2003; Pender, 2000). The scope for rural non-farm employment however is to a large extent determined by geographical factors. The role of geography in economic development is well known, dating back to the work of von Thunen in 1810 stressing
1
Since 1998 the Dutch Ministry of Agriculture, Nature and Food Quality (LNV) promotes development-orientated agricultural and environmental research and strengthening of North-South partnerships through its International Cooperation (DLO-IC) research programme. The authors would like to thank the Ministry and the leaders of the individual projects from which data are used for enabling this study.
2
We define farm employment as all agricultural income. We thus do not include agricultural wage labor in non-farm activities.
the importance of distance to urban areas. Based on distance to urban areas we can distinguish three different zones: peri-urban, countryside and remote rural areas, each with different likely activities. Access to urban markets is important for selling agricultural surpluses and for determining the scope for local manufacturing and services. High transportation costs prevent sales of all but very high-value crops, thus limiting the scope for agricultural activities. At the same time limited access to urban markets also implies that goods and services are produced locally, increasing local non-farm employment opportunities if local demand suffices.
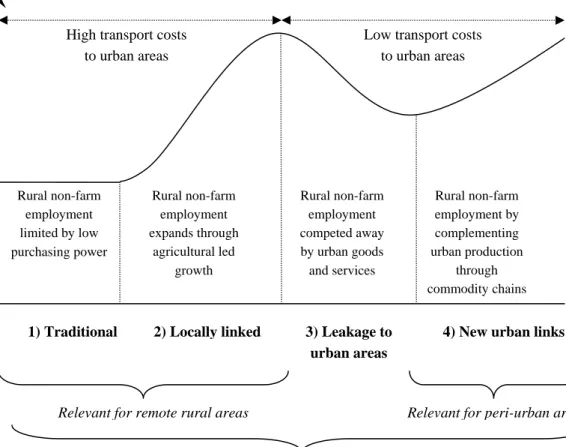
The importance of transport costs is depicted in Figure 1, presenting a stylized representation of the development of rural non-farm employment opportunities in relation to transport costs and agricultural growth. Agricultural and non-agricultural sectors are linked through production and expenditure linkages. These links imply that growth (or lack of growth) from one sector can spill over to (or inhibit) another sector (FAO 2002). The importance of transport costs implies that the four stages ((1) traditional; (2) locally linked; (3) leakage to urban areas; (4) new urban links) are only relevant for the countryside in between the peri-urban and remote areas. Local non-farm production in peri-urban areas typically needs to compete with the nearby urban production, only leaving room for complementary production. Local non-farm production in the remote areas, on the other hand, will usually be protected from urban competition by high transport costs. This at the same time limits the relevance of sub-contracting of production as in the last stage of Figure 1. The representation of the development in rural non-farm employment in Figure 1 is of course highly stylized. In reality developments will vary across regions and sectors. Recession and disasters may result in a decline in agriculture, leading through negative spill-over effects to a contraction of the non-farm sector. There is thus by no means a homogeneous and linear process that irreversibly leads to the development of rural non-farm employment.
Figure 1: Stages of rural non-farm employment and relevance for different rural areas
Level of rural non-farm employment
Source: based on Start (2001) and Wiggins and Proctor (2001)
The discussion so far has concentrated on a rather aggregate level, comparing the scope for non-farm employment in different geographical locations. These non-farm income opportunities vary from well-paid formal employment to casual unskilled labor. Access to these opportunities depends on skills, wealth, gender class and race (Start 2001). The ability of households and household members to exploit available opportunities is thus not evenly spread. This has a sparked a discussion on the extent to which non-farm employment reduces or increases income inequality (Stokke et al. 1991).
The empirical evidence suggests that the effect can go both ways, thus precluding any general conclusions on the impact of non-farm income on inequality (Haggblade et al. 1989;
1) Traditional 2) Locally linked 3) Leakage to
urban areas
4) New urban links Rural non-farm employment limited by low purchasing power Rural non-farm employment expands through agricultural led growth Rural non-farm employment competed away by urban goods and services Rural non-farm employment by complementing urban production through commodity chains
Relevant for remote rural areas Relevant for peri-urban areas
Relevant for countryside in between peri-urban and remote areas
Low transport costs to urban areas High transport costs
Lanjouw and Lanjouw 2001). In studies of the factors influencing individuals participation in non-farm employment, household endowments (land, labor and capital) and individual characteristics, particularly education and gender, play an important role (Ezumah and Di Domenico 1995; Ruben and van den Berg 2001). Finally, investments in non-farm opportunities are often related to ethnic or kinship ties, limiting access to non-farm opportunities to subsets of a rural population. The development of rural non-farm employment opportunities for households or individuals is thus highly temporally, spatially and socially specific (Start 2001).
Data description
Differences in non-farm employment opportunities will imply differences in the impact of non-farm income on sustainability indicators as well. A unique dataset collected in six different countries of Africa and Asia allows us to explore links between non-farm employment, agricultural practices and sustainability indicators. Data has been combined from five different multidisciplinary research projects addressing sustainability issues in developing countries. The data were all collected using the same methodology for surveying farm households and intensive monitoring of farm activities (involving frequent visits by enumerators) over one or more calendar years.3 This resulted in a rich dataset of 449 households (including data on 3305 individuals) that is consistent across households and countries.
The surveyed villages cover the spectrum of geographical locations as depicted in Figure 1 (see Table 2). The sample is strongly biased towards Africa. The two Asian locations provide a strong contrast to the African households, being in a more densely populated continent and being located close to urban centers. This confounds the differences we find between areas with new urban links and the other more remote areas. Nonetheless, the distribution of location and distance to urban
3
Further details and references to the projects and the survey methodology are not provided at this stage in order to preserve the authors’ anonymity.
centers is fairly even (similar number of observations within each zone) which gives an even distribution in access to markets and institutional environment.
Table 1: Description of data
Countrya) Yearb) No. of
households
No of individuals
Household members engaged in non-farm employment (%) 1) Traditional 121 1122 17.2 Burkina Faso 1997 104 1002 14.1 Ethiopia 2001 17 120 36.3 2) Locally linked 98 874 17.7 Ethiopia 2000 20 138 17.8 Kenya 1997 18 164 24.5 Uganda 1997/2000 60 572 15.6
3) Leakage to urban areas 107 801 10.1
Ghana 2004 62 421 25.4
Kenya 1997/1999 45 380 27.1
4) New urban links 123 508 15.2
China 2002 60 221 38.8
Vietnam 2002 63 287 54.5
Whole sample n.a. 449 3305 27.5
a)
Countries are grouped under the headings used in Figure 1, see text for details; b) Year in which data are collected.
Analyzing the non-farm employment and its relation with external input use
The analysis of the role of non-farm employment in rural livelihoods proceeds in three steps: (i) the importance of non-farm employment at household level; (ii) the access to non-farm employment at individual level; and (iii) the impact of non-farm employment on external input use.
The importance of non-farm employment
Obtaining reliable data on non-farm employment and especially on revenues derived from non-farm work is not easy. In general, people are rather reticent about disclosing how much they have earned,
and what their sources of income are. We therefore use multiple indicators to gauge the importance of non-farm employment (Table 2).
Table 2: Importance of non-farm employment by location (in percentages, standard deviation in parentheses)
Main occupationa) Share of household membersb) Share of incomec) (1) (2) (3) Traditional 2.2 17.2 12.0 (8.7) (23.5) (26.0) Locally linked 9.7 17.7 15.2 (19.1) (23.5) (21.2)
Leakage to urban areas 10.3 26.1 25.5
(15.9) (22.9) (65.8)
New urban links 16.4 46.8 35.3
(21.8) (27.1) (25.1)
Total sample 9.7 27.5 22.2
(17.8) (27.3) (38.0)
a)
Percentage of household members identifying non-farm as their main type of employment; b) Share of household members that are involved in any non-farm activities; c) Share of household income derived from non-farm activities.
The first indicator is whether household members’ main occupation is non-farm employment, signaling the importance attached to non-farm activities (column 1). There is a clear pattern that the closer one gets to urban areas, the more important non-farm activities become as the main source of income. The second indicator measures the share of household members involved in non-farm activities, thus including household members engaged in non-farm activities next to agricultural production (column 2). Comparing the first two columns we find a strong increase in involvement in non-farm in all zones. Even in the remote traditional zone 17 percent of the households members is involved in non-farm activities, signalling the general importance of non-farm activities. The third indicator presents the share of non-farm income in total household income (column 3). Despite underreporting of non-farm earnings in the surveys, it still accounts for 12 to 35 percent of household income. This confirms the importance of non-farm activities found by Reardon et al. (et al. 1998), even in remote areas.
Households in the locally linked zones thus have less non-farm employment than those in the leakage to urban areas zone, while we expected the opposite based on our theoretical framework (see Figure 1). The three indicators in Table 3 all point towards a growing importance of non-farm activities the closer one gets to urban areas. This finding may result from the cross-section nature of our data, as opposed to time-series data following the developments in an area after links to an urban centre are developed. Another likely cause is that we are unable to distinguish rural (or local) non-farm employment from urban employment. It may well be that the in the leakage to urban areas there is less local and more urban employment. The higher share of non-farm income in total income (with similar participation rates in non-farm activities) for the leakage to urban areas zone points in this direction. Urban wages are as a rule higher than urban areas, suggesting a higher share of urban employment in the leakage to urban areas zone.
Access to non-farm employment
The key finding of Table 2 is that location is an important driving factor for non-farm activities. We therefore analyzed the role of location in relation to other factors, such as age or education, in individuals’ engagement in non-farm employment. Table 3 presents the detailed results from the estimation of the ordered probit model with the extent of individual participation in non-farm employment as the dependent variable. This takes three possible values: 0 for no, 1 for some, and 2 and for only non-farm employment. The table presents the coefficients for the various explanatory variables as well as the marginal effects (together with standard errors) evaluated at the means of the explanatory variables, for each of the three possible values of the extent of non-farm employment. Various specifications of explanatory variables were evaluated using information criteria tests (as described in Cameron and Trivedi, 2005).
Table 3: Ordered probit estimates of individual participation in non-farm employmenta) Marginal Effectsb) Coefficient No non-farm employment Some non-farm employment Non-farm employment only (1) (2) (3) (4) Zonec) Locally linked 0.369* -0.128*** 0.045*** 0.083*** (0.191) (0.017) (0.015) (0.031)
Leakage to urban areas 0.812*** -0.292*** 0.086*** 0.206***
(0.176) (0.012) (0.022) (0.027)
New urban links 0.720*** -0.259*** 0.079*** 0.180***
(0.179) (0.013) (0.020) (0.028)
Household characteristics
Number of members 0.027* -0.009* 0.003* 0.005
(0.016) (0.005) (0.002) (0.004)
Farm size (ha) -0.053* 0.017* -0.007* -0.010*
(0.028 (0.009) (0.004) (0.006)
Ratio land / membersd) 0.130 -0.042 0.017 0.026
(0.142) (0.046) (0.018) (0.029) Individual characteristics Age -0.006* 0.002* -0.001* -0.001* (0.004) (0.001) (0.0004) (0.001) Gender (F = 0; M =1) 0.446*** -0.144*** 0.056*** 0.088*** (0.125) (0.013) (0.016) (0.025) Child (under 15) -0.345* 0.104*** -0.044*** -0.060* (0.181) (0.029) (0.003) (0.036) Education: primarye) 0.120 -0.040* 0.015 0.024 (0.079) (0.020) (0.011) (0.032) Education: secondary e) 0.459*** -0.160*** 0.055*** 0.106*** (0.110) (0.016) (0.016) (0.030) Education: postsecondary e) 0.626*** -0.232*** 0.065*** 0.166*** (0.208) (0.017) (0.019) (0.032)
Constant -1.166*** n.a. n.a. n.a.
(0.218)
* Significant at 10% level ** Significant at 5% level *** Significant at 1% level
a)
An ordered probit model was fitted using maximum likelihood estimation. Number of observations = 1797. Standard errors in parentheses. Log likelihood function = -1281. Covariance matrix was adjusted for clustering according to 30 villages.
b)
Marginal effects are evaluated at means of regressors.
c)
The “traditional” zone is used as the benchmark.
d)
Ratio of land to household members is calculated as total hectares divided by total number of household members using an adjustment factor for children.
e)
The results tend to confirm the pattern seen above with respect to the effect of location. The probability of an individual having some non-farm employment generally increases with zones that are closer to urban areas, as does the probability of an individual being employed full-time in non-farm activities. Indeed, this effect is even stronger for the leakage to urban areas zone than for the new urban links zone. This may well be due to the large differences between the types of farm enterprises in these two zones4. Such differences are partly accounted for given the adjustment for clustering at village level (see Table 3 notes) but further analysis will concentrate on a better incorporation of these differences. In any case, the pattern across the African study locations remains robust even when the observations for the new urban links zone are omitted.
Household and individual characteristics are also related to participation in non-farm employment. Non-farm employment is positively related to household size while individuals from larger farms have less probability of engaging in non-farm employment. These effects are however relatively modest in size. Age does not appear to a strong determinant of non-farm employment, with the exception of the expected lower probability for children under 15. The results do though confirm that men are more likely to be engaged in off-farm employment than women, as are individuals with a secondary or post-secondary education.
The role of non-farm employment in external input use and nitrogen balances
Another issue of interest is the relationship between non-farm employment and farm management practices, including both intensification and sustainability perspectives. Four more econometric models were therefore estimated at household level (Table 4 and 5). First, the effect of location, as well as various household and farm characteristics, on expenditures on cropping inputs per hectare (primarily fertiliser, pesticides and extra hired labour) was examined (Table 4, column 1). These expenditures are an indicator of intensification or general investment in agricultural production.
4
The uban zones consist of survey data from China and Vietnam of horticultural producers, while the other zones consist data from African villages.
Input expenditures are, of course, by far higher for the intensive horticultural production of the new urban links zone. But it also turns out that farms in the locally linked and leakage to urban areas zones are inclined to use significantly fewer inputs than those in the traditional zone. Furthermore non-farm income, either in absolute terms or as a percentage of household income does not seem to affect expenditures on inputs. Taken together with the findings on individual access to non-farm employment, these findings suggest that farms closer to urban areas, but not in the new urban links or peri-urban zones around cities, are not investing more in agricultural production than those further away. In particular, increased incomes from non-farm employment opportunities are not being invested directly in farm production (at least not in improving crop production). This suggests that income earned with non-farm activities is not used to substitute for the labour withdrawn from agriculture.
But because expenditures on crop inputs also capture differences in production systems and their profitability, more detailed analysis was undertaken of the use of inorganic fertiliser (Table 5). Fertiliser use and soil nutrient balances (discussed below) are a key concern in the African context, where most of our data comes from, given the extent to which soil nutrients are being mined. Our dataset indicates that a farm’s decision to use fertiliser can be separated from the second decision concerning how much to apply (for those farms choosing to do so). The results suggest the possible importance of structural factors, or impediments to accessing fertiliser among African farms.
The amount of fertiliser applied by farmers in the different zones matches the same pattern seen above for input expenditures. Farms in the new urban links apply much more (kg nitrogen per ha) but farms in the traditional zone are still likely to use more than those in the locally linked zone, with those in the leakage to urban areas zone likely to apply the least amount. Again, farms with more available labour tend to use more fertiliser while farms that are somewhat larger tend to apply less. Aside from similar differences among countries, it appears that income from non-farm
Table 4: Estimates from OLS regressions of external input use and soil nutrient balancea)
(standard errors in parentheses)
Variable input costs (log $ per ha)
Soil nitrogen balance (log kg N per ha)
(1) (2)
Zoneb)
Locally linked -1.672*** 1.182
(0.373) (0.798)
Leakage to urban areas -2.906*** -0.824
(0.497) (1.064)
New urban links 6.226*** 3.759***
(0.377) (0.883)
Household characteristics
Non-farm income (amount $ ‘000) 0.006 0.015
(0.093) (0.199)
Percentage of income from non-farm employment -0.002 (0.002) 0.006 (0.004) Number of HH members -0.042 0.133* (0.032) (0.068)
Number of individuals consuming in HH 0.068 -0.001
(0.060) (0.128)
Gender HH head (F = 0; M =1) -0.082 0.250
(0.197) (0.421)
Percentage women in household 0.301 (0.344) 0.028 (0.736) Education HH head Primary 0.052 0.087 (0.172) (0.369) Secondary 0.173 0.449 (0.160) (0.343) Post-secondary 0.512** 0.082 (0.250) (0.537) Farm characteristics
Labour available for farm 0.077 -0.142
(0.057) (0.122)
Land area -0.098* 0.106
(0.059) (0.125)
Ratio of land area to number of individuals consuming in HH
0.160 (0.188)
0.091 (0.402)
Square of land area 0.002 -0.003
(0.001) (0.003)
Livestock units 0.003 0.041**
(0.010) (0.020)
Fertiliser use (kg N per ha) 0.003**
Table 4 - continued Regional characteristics Price fertiliser -1.220** -0.014 (0.487) (1.043) Country Burkina Faso 3.674*** -1.575* (0.422) (0.904) China 0.185 -0.437 (0.220) (0.480) Ethiopia 5.573*** 0.079 (0.437) (0.935) Ghana 7.805*** -3.203** (0.657) (1.410) Kenya 7.245*** -2.430** (0.573) (1.231) Uganda 5.142*** -4.854*** (0.541) (1.160)
Vietnam benchmark benchmark
* Significant at 10% level ** Significant at 5% level *** Significant at 1% level a)
Both equations are estimated with OLS using logarithms of dependent variables. For model of cost of external inputs, R2 = 0.61, Number of observations = 379; Chi-squared statistic of LLR test = 361.92 (which is significant at 1% level, given 23 degrees of freedom). For model of soil nutrient balance, R2 = 0.68, Number of observations = 379; Chi-squared statistic of LLR test = 440.47 (which is significant at 1% level, given 24 degrees of freedom).
b)
The “traditional” zone is used as the benchmark.
As mentioned above, we are also interested in possible linkages between location, non-farm income and the sustainability of farming practices. The available data also allows us to estimate the effects of various factors on the net soil nutrient balance for nitrogen which is the total input of nitrogen from fertilisers (including organic as well as inorganic) less what is removed through harvesting (see Table 4, column 2).
Even though this ignores other losses such as from erosion or leaching, for a majority of the African farms in the sample, this partial balance is already negative. Despite the strong differences in fertiliser use among zones, the only zone with a significant difference in soil nitrogen balances is the new urban links zone of the Asian horticultural producers. The results provide few other clues, but they do not suggest any link between non-farm income and soil fertility management.
Table 5: Estimates from a two-tier model use of inorganic fertilizera) (standard errors in parentheses)
Use of inorganic fertilizer (Yes/No)
Amount inorganic fertilizer (kg N per ha)
Coefficient Marginal effectb) Coefficient
(1) (2) (3)
Zonec)
Locally linked -0.717**
(0.319)
Leakage to urban areas -1.223***
(0.439)
New urban links 5.214***
(0.418)
Household characteristics
Non-farm income (amount) 0.001** 0.0001** -0.0001
(0.0002) (0.0000) (0.0001)
Percentage of income from non-farm employment -0.008 (0.006) -0.002 (0.001) -0.003 (0.003) Number of HH members 0.004 0.001 0.042 (0.089) (0.021) (0.031) Number of individuals consuming in HH -0.069 (0.057) Gender HH head (F = 0; M =1) -0.040 (0.174)
Percentage women in household 0.265 (0.888) 0.063 (0.213) -0.142 (0.337) Education HH head Primary 0.310* (0.165) Secondary -0.014 (0.141) Post-secondary 0.294 (0.210) Farm characteristics
Labour available for farm 0.418*** 0.100*** 0.128**
(0.118) (0.028) (0.062)
Land area 0.016 0.004 -0.318***
(0.094) (0.023) (0.048)
Square of land area -0.001 -0.0002 0.006***
(0.003) (0.0007) (0.001)
Livestock units 0.028 0.007 -0.009
Table 5 - continued Regional characteristics
Price fertiliser -7.613*** -1.824*** 0.121
(2.541) (0.662) (0.934)
Country
Burkina Faso benchmark benchmark 2.488***
(0.557) China 0.252 (0.185) Ethiopia 2.883*** 0.435*** 2.405*** (0.756) (0.60) (0.505) Ghana 3.630*** 0.493*** 4.271*** (1.042) (0.095) (0.851) Kenya 2.119*** 0.398*** 3.728*** (0.521) (0.083) (0.587) Uganda -1.266 -0.306 1.381*** (1.086) (0.248) 0.485 Vietnam benchmark Constant 0.716 0.172 n.a. (1.279) (0.311) * Significant at 10% level ** Significant at 5% level *** Significant at 1% level a)
The first tier concerns the decision to apply inorganic fertiliser and was estimated with a logit regression (log likelihood function = -128.8415, df = 13, number of observations = 283). The second model is an OLS regression of amount of fertiliser applied (logarithm of equivalent kg nitrogen per hectare) on a range of household and farm characteristics, using only farms which had applied fertiliser i.e. only positive values (R2 = 0.86, Number of observations = 281; LLR test chi-squared statistic = 571.21 which is significant at 1% level, given 22 degrees of freedom). A range of combined corner solution models, including Tobit were rejected. In addition, a normality test of a probit specification for the first model was rejected. An extreme value distribution gave similar results to the logistic results presented here. The results preseented here show the logit results for a specification omitting the Asian observations, i.e. the new urban linkages zone.
b)
Marginal effects are evaluated at means of dependent variable. c)
The “traditional” zone is used as the benchmark.
Summarising the results in general, location does matter. Concerning the role of non-farm employment and income in agricultural livelihoods, one general interpretation of results is that households do not invest additional non-farm income in agricultural production, but rather use this income for other purposes, such as consumption or school fees. These conclusions are supported by the evaluation of the impact of commercial activities on household expenditures. Households indicate to spend the income mainly on purchasing food and non-food items. Investments in agriculture are only frequently mentioned in one village out of three cases. This would suggest a more nuanced view of household livelihood strategies and investment behaviour than one placing farm production as the central activity.
Conclusions
Non-farm activities play a principal role in the livelihoods of rural households, even for households in remote areas. As in other studies we find educated males to be most likely to engage in non-farm employment. Controlling for household and individual endowments we find distance from urban centers to play a determining role in the extent to which household members engage in non-farm activities. This implies that the growing attention for non-farm employment as a strategy for rural poverty reduction is warranted, but needs to account for geographical differences.
Non-farm activities are not only important for combating rural poverty, but also affect agricultural production decisions. Preliminary analyses of the sustainability of agricultural production (using inorganic fertilizer or external inputs as proxies) find non-farm income associated with a reduction in fertilizer use. Income from non-farm activities apparently is not invested in agriculture. In the African context, which covers the majority of our data, this suggests a negative impact of non-farm activities on sustainability. African farm households, including those in the dataset, generally apply insufficient organic or inorganic fertilizers, making soil nutrient mining a key issue. Since the use of inorganic fertilizer is a rather crude proxy for sustainability, we are currently further investigating the link between non-farm activities, geographical location and soil nutrient balances. Thus although our finding of reduced fertilizer use with non-farm employment could be taken as an indication of less intensive agriculture, similar to the findings of Bahomenes (2003) in Chile, agricultural production becomes less sustainable because of increased soil nutrient mining.
Although we conclude that non-farm employment is important for rural households it can however not be taken for granted that non-farm employment provides a path out of poverty. Besides commonly analyzed factors like education and gender differences, distance from urban centers plays a key role in determining access to farm employment. This limits the scope for using local non-farm employment for poverty reduction in remote areas, suggesting possibly a focus on migratory employment. In terms of sustainability of agricultural production we find that non-farm income may
worsen soil nutrient mining in Africa. If further analysis confirms this finding, this would support the hypothesis of a trade-off between poverty reduction and sustainability concerns.
References
Bahamondes, M. 2003. Poverty-Environment Patterns in a Growing Economy: Farming Communities in Arid Central Chile, 1991–99. World Development, Volume 31, Issue 11, Pages 1947-1957
Barbier, B. 1998. Induced innovation and land degradation: Results from a bioeconomic model of a village in West Africa. Agricultural Economics, Volume 19, Issues 1-2, Pages 15-25
Cameron, A. C. and P. K. Trivedi (2005). Microeconometrics: Methods and Applications. Cambridge, U.K. and New York: Cambridge University Press.
Drechsel, P., D. Kunze and F. Penning de Vries. 2001 Soil nutrient depletion and population growth in sub-Saharan Africa: a Malthusian nexus?. Population Environ. 22 (4), pp. 411–423. Donovan, G., F. Casey, 1998. Soil fertility management in sub-Saharan Africa. World Bank Technical Paper No. 408. The World Bank, Washington, DC, 60 pp.
Ellis, F., N. Harris, 2004. New Thinking About Urban and Rural Development. Keynote Paper for DFID Sustainable Development Retreat. University of Surrey, Guildford.
Ezumah, N. N. and C. M. Di Domenico (1995). "Enhancing the Role of Women in Crop Production: A Case Study of Igbo Women in Nigeria." World Development 23(10): 1731-44.
FAO (2002). Promoting farm/non-farm linkages for rural development. Case studies from Africa and Latin America. Rome, FAO.
Haggblade, S., P. Hazell, et al. (1989). "Farm-N onfarm Linkages in Rural Sub-Saharan Africa." World Development 17(8): 1173-1201.
IFAD (2001). Rural Poverty report 2001: The Challenge of Ending Rural Poverty. Oxford, Oxford University Press for IFAD.
InterAcademy Council, 2004. Report of the Inter Academy Council: Realizing the Promise and Potential of African Agriculture. Amsterdam, The Netherlands
Lanjouw, J. O. and P. Lanjouw (2001). "The rural non-farm sector: issues and evidence from developing countries." Agricultural Economics 26(1): 1.
Mellor, J. 2001. Faster more equitable growth––agriculture, employment multipliers and poverty reduction, paper prepared for USADD/G/EGAD
Pender, J., 2000. Development strategies for the East African Highlands. 2020 Focus 4 (Promoting Sustainable Development in Less-Favored Areas), Brief 7. IFPRI, Washington.
Reardon, T., et al. (1998). Rural non-farm income in developing countries. The state of food and agriculture, 1998. FAO. Rome.
Renkow, M. 2000. Poverty, productivity and production environment: a review of the evidence. Food Policy, Volume 25, Issue 4, Pages 463-478.
Ruben, R. and M. v. d. Berg (2000). Non-farm employment and rural poverty alleviation in rural Honduras. Wageningen, Development Economics Group, Department of Social Sciences, Wageningen University. Scherr, S.J., 2000. A downward spiral? Research evidence on the relationship between poverty and natural
resource degradation. Food Policy, Volume 25, Issue 4, Pages 479-498.
Shiferaw, B., S. T. Holden. 1998. Resource degradation and adoption of land conservation technologies in the Ethiopian Highlands: A case study in Andit Tid, North Shewa . Agricultural Economics, Volume 18, Issue 3, Pages 233-247
Start, D. (2001). "The RIse and Fall of the Rural Non-farm Economy: Poverty Impacts and Policy Options." Development Policy Review 19(4): 491-505.
Stokke, K. et al. (1991). "Growth Linkages, the Non-farm Sector, and Rural Inequality: A Study of Southern Sri Lanka." Economic Geography 67(3): 223-39.
Thirtle, C. L.Lin, J. Piesse. 2003. The Impact of Research-Led Agricultural Productivity Growth on Poverty Reduction in Africa, Asia and Latin America. World Development, Volume 31, Issue 12, Pages 1959-1975 Van der Walle, D., D. Cratty. 2003. Is the emerging non-farm market economy the route out of poverty in
Vietnam? Volume 1. Policy, Research working paper series no. 2950. World Bank.
Wiggins, S. and S. Proctor (2001). "How Special Are Rural Areas? The Economic Implications of Location for Rural Development." Development Policy Review 19(4): 427-436.