Spatial Modelling Techniques and Data Integration Using GIS for
Target Scale Gold Exploration in Finland
Nykänen, V. M.
[1], Ojala, V. J.
[1], Sarapää, O.
[1], Hulkki, H.
[1], Sarala, P.
[1] _________________________1. Geological Survey of Finland
ABSTRACT
Spatial modelling techniques, including weights of evidence, logistic regression and fuzzy logic, have been used in this study for a mineral prospectivity analysis to test the utility of these methods in a target scale gold exploration project with i n t h e Palaeoproterozoic Central Lapland Greenstone Belt (CLGB) in Finland, Northern Fennoscandian Shield. In mineral exploration, typical numerical data sets used are categorical geological maps and their derivatives, ordered or ratio-scale data from geophysical and geochemical surveys processed in various ways, in addition to any other relevant spatially referenced geoscientific information. Spatial analysis in Geographic Information Systems (GIS) is an efficient and accurate way to quantify relationships between existing targets (e.g. mineral deposits) and various geoscientific datasets and to produce a quantitative measure of the favourability of the desired feature, typically a specific mineral deposit type. The datasets used in this study are derived from very high resolution airborne geophysical survey (magnetic, elecetromagnetic and gamma radiation measurements), regional ground gravity survey and a target scale till geochemical survey. Drilling samples with over 0.5 g/ton gold were used as ‘training points’ for the spatial modelling. This study shows that integrating high quality and high precision geophysical and geochemical data in a GIS provides valuable guidelines for decision making in a mineral exploration project. The success of these exercises has still not been truly proven but the indirect new evidence from geochemical surveys correlate with the high potential areas.
INTRODUCTION
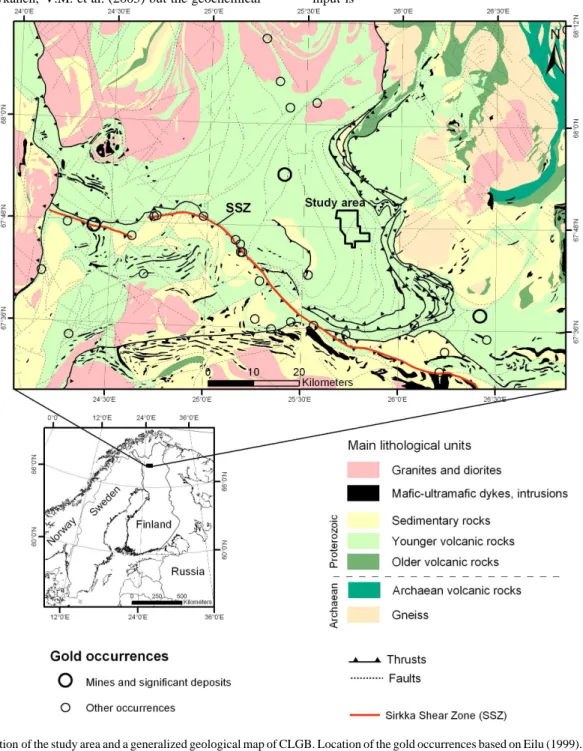
The Central Lapland Greenstone Belt (CLGB) is located in the Northern Fennoscandian Shield, approximately 100 km north of the Arctic Circle (Figure 1). It is mainly composed of Palaeoproterozoic mafic to ultramafic volcanic sequences and related sedimentary units surrounded by granitic intrusions (Lehtonen et al., 1998). Small-s c a l e g o l d exploration within CLGB started in the 1980s concentrating mainly along a major shear zone, named the Sirkka Shear Zone (SSZ), which roughly crosses the entire greenstone belt from west to east. However, there are several gold occurrences located at a considerable distance from the SSZ, indicating that there are additional controlling factors involved. In the current study area, Petäjäselkä, gold mineralization is hosted by mafic volcanic rocks and intercalated intermediate volcanic rocks, graphitic cherts, tuffs and sedimentary rocks metamorphosed to greenschist facies.
Mineral prospectivity mapping (or mineral potential mapping) takes great advantage of GIS technology to deal with the large amount of digital geoscientific map data (Bonham-Carter, 1994). Various GIS methods have greatly surpassed a human’s ability to integrate and analyze
quantitatively large amounts of spatially referenced data. There are several mathematical and statistical techniques available for discovering patterns in spatial data, thereby making effective use of the exploration data that grow on annual basis.
Nykänen and Salmirinne (2007) and Nykänen, V.M. et al. (in press) conducted a series of empirical and conceptual prospectivity analyses for orogenic gold within the CLGB using high-resolution airborne geophysics (Airo, 2005) with 200 m line spacing at 40 m terrain clearance (magnetic and electromagnetic), regional till geochemical survey with 1 sample/4 km2 (Salminen, 1995), regional gravity survey with 1 reading/km2 and 1:200 000 scale bedrock map, resulting in the generation of several untested targets. Furthermore Nykänen, V.M. et al. (2005) conducted a conceptual target scale spatial modelling for one of the targets called Petäjäselkä located in the middle part of CLGB (Figure 1) using very high-resolution airborne geophysics with 50 m line spacing at 30 m terrain clearance (magnetic, electromagnetic and gamma radiation), regional gravity with 6 readings/km2 and regional till geochemistry with 1 sample/4 km2 as input data. The current paper describes a further prospectivity mapping at a target scale using a combination of Fuzzy Logic, Weights-of-Evidence and Logistic regression. The geophysical input is the
Paper 6
8
___________________________________________________________________________
same as in Nykänen, V.M. et al. (2005) but the geochemical input is
Figure 1: Location of the study area and a generalized geological map of CLGB. Location of the gold occurrences based on Eilu (1999).
enhanced with a target scale detailed geochemical survey comprising a 250 m grid. The aim of the study is to provide data integration tools for exploration geologists and help them plan the next step in their drilling program.
SPATIAL MODELLING
The spatial modelling techniques used in this study are described by Bonham-Carter (1994) and have been widely used in various ways for mineral exploration (e.g. Carranza & Hale, 2000, 2001; Harris et al., 2000, 2001; Raines & Mihalasky, 2002; Paganelli et al., 2002; Carranza, 2004; Raines & Bonham-Carter, 2006; Harris & Sanborn-Barrie, 2006; Wright et al., 2006). Two modelling approaches, conceptual and empirical, were combined here to integrate the evidential datasets into a single prospectivity map. Initially the geochemical evidence was combined together using the inference network adopted and
slightly modified from Nykänen, V.M. et al. (2005). The resulting combination map of geochemical anomalies was then used as an input in the combined weights-of-evidence and logistic regression modelling together with the geophysical evidence.
The empirical weights-of-evidence method is based on quantifying the spatial association between the training sites (e.g. known mineral occurrences) and the evidential data (map patterns). In this study, the training points for the empirical modelling were selected from the existing one meter drill sections exceeding 0.5 g/ton Au. The amount of samples passing this requirement was 17 in the current state of the exploration project. Samples were projected to the surface to represent the training point by using the drilling direction and the average dip of 45 degrees. Unit cell size in the modelling was 10x10 m and the total study area was 31.8 km2. The weights-of-evidence modelling is based on Bayes’ probability theory, which assumes conditional independency between the evidence layers with respect to the training sites (Bonham-Carter, 1994). To avoid this conditional dependency problem, there are analytical methods available, like logistic regression, which do not have this requirement of conditional independency, and thus enable the use of more variable data sources for prediction models. Input evidence data layers were reclassified into binary patterns using the maximum contrast value in the cumulative weights calculation, and then the logistic regression method was used to combine the evidence layers (Agterberg, 1989; Agterberg et al., 1993) into a single prospectivity map for orogenic gold deposits.
Very high resolution airborne geophysics
A very high resolution aerogeophysical survey covering 260 km2 was flown over the Petäjäselkä study area, at a line spacing of 50 m, a flight altitude of about 30 m, and flight direction east– west, perpendicular to the dominant trend of geological units (Nykänen, V.M. et al., 2005). Differential GPS resulted in extremely high spatial precision of data. The measurements included three standard components: magnetism, electromagnetism, and radioactivity. The evidential dataset were derived from these components.
Magnetic
The tilt derivative (TDR) was calculated for 100 m upward continued magnetic field total intensity data to describe and illustrate structures that might be associated with gold deposits. The method for calculating TDR is described by Miller and Singh (1994) and Verduzco et al. (2004). The upward continuation was used to enhance the signal to noise ratio and better define larger structures that are often masked by near surface anomalies observed at low flight altitudes (Naidu and Mathew, 1998). High TDR values are commonly associated with lateral contrasts in magnetization that are dike-like in shape, and may represent dikes, nonmagnetic alteration zones, or faults associated with gold mineralization.
Electromagnetic
The measured parameters of the electromagnetic survey were in-phase and quadrature components with frequencies 3 kHz and 14 KHz. The lower frequency has better depth penetration (Peltoniemi, 1998) and has been widely used for mineral exploration. Thus the in-phase component of the 3 kHz frequency was selected for gold potential modelling to help locate sulfide conductors.
Gamma radiation
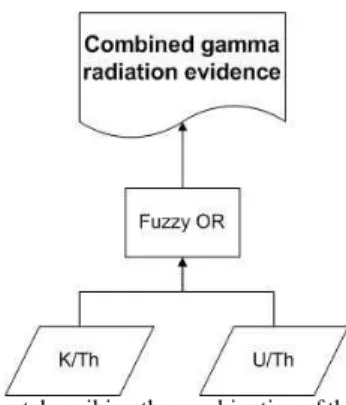
Anomalous K/Th ratios can be used as evidence of the potassic alteration related to gold mineralization alteration zones within mafic to ultramafic rocks (Airo, 2002). On the other hand the decrease in Th in metasedimentary rocks may indicate sulfides associated with gold. Therefore, the elevated U/Th ratio can be used as evidence of reduced conditions within metasedimentary rocks (Airo, 2002). These two parameters derived from the gamma radiation survey were combined together using Fuzzy OR operator (Nykänen, V.M. et al., 2005) and the resulting combination was used as an evidence layer (Figure 2).
Figure 2: Flow chart describing the combination of the gamma radiation data to produce the evidence map.
Regional gravity
A gravimetric ground survey in the Petäjäselkä study area covers 169 km2 using a density of six readings/km2. The horizontal gradient magnitude of he Bouguer anomaly data [mgal/km] peaks over structures associated with contrasts in bedrock density. Orogenic gold deposits in greenstone belts are commonly located in affiliated smaller faults on a district scale or shear zones geometrically related to crustal-scale shear zones. The horizontal gradient of the Bouquer anomaly was selected to delineate this important structural control associated with orogenic gold occurrences.
Detailed till geochemistry
The target scale geochemical sampling was done using 250 m point spacing resulting in the collection of 559 samples within the 31 km2 study area. Assays were done using ICP-AES and GAAS (for Au) methods after partial leaching. The procedure is
described by Niskavaara (1995). The original point data were interpolated using the inverse distance weighting (IDW) method and a 50-m grid interval to create the gridded color surface maps for the selected elements. Values for each grid were then divided into 16 classes by quantiles for further processing prior to modelling. Suites of elements were considered together to determine favorability for certain sources. The suites used were Fe, Cu, Co and As (sulfidic source), K (alkaline alteration) and Au together with Te (mineralized source). These suites of elements were combined together using Fuzzy logic methodology (Nykänen, V.M. et al., 2005) and the resulting combination was used as an evidence layer (Figure 3).
Figure 3: Flow chart describing the combination of the geochemical data to produce the evidence map.
MODELLING RESULTS
Table 1 summarizes the measurement of spatial association between the 17 training sites and the evidence layer following the methodology described by Bonham-Carter (1994) and Raines et al. (2000). Due to strong conditional dependency between the geochemical data the separate anomaly maps of individual elements were combined together using a Fuzzy logic method (Bonham-Carter, 1994). The same was done for the gamma radiation maps. Thus the number of evidence maps for the final prospectivity maps was five.
The evidence layer comprising the combined till geochemistry has the strongest spatial association with the training sites whereas the gamma radiation map has the weakest spatial association. In addition, the confidence (C*) value for the gamma radiation evidence is rather low. Confidence values above 1.96 are considered as acceptable. Thus the gamma radiation could be excluded and the gravity gradient map is only slightly below this threshold. However, these two maps were used in the model and we are accepting the uncertainty into the prospectivity map resulting from this decision. When Nykänen, V.M. et al. (2005) used TDR lows as an input in their Fuzzy
logic model in this study we found that high TDR values had stronger spatial association with the drill samples used as training sites. Low values on the TDR map did not correlate at all with the training sites. Modelling could perhaps be improved if the magnetic textures in magnetic high areas were geologically interpreted into a structure map.
Table 1: Summary of the weights (W+ and W-), contrast (C) and confidence (C*) for each input evidence map organized in descending order by the contrast (C) value (measure of spatial association). Evidence W- W+ C C* Till geochemistry -2.4215 1.0255 3.4470 3.3440 EM real -1.8750 0.4232 2.2983 2.2296 Gravity gradient -1.1262 0.3255 1.4517 1.9285 AM (TDR) -0.2848 0.9267 1.2115 2.3871 Gamma radiation -0.7503 0.2738 1.0241 1.6097
Total area = 31.8 km2; Unit cell size = 0.0001 km2; Number of training sites = 17; Prior probability = 0.00005; C = W+ - W-; C* = C/C(std) 0.000010 0.000100 0.001000 60 65 70 75 80 85 90 95 100 Cumulative area (%)
Posterior probability prior probability = 0.00005
High Moderate
Low
Very low
Figure 4: Cumulative area vs. posterior probability plot. The dashed lines represent the class brakes for the probability classes in the prospectivity map (Figure 5).
Geological evidence gathered during exploration suggest that gold mineralization in Petäjäselkä is related with shear zones and sub-parallel quartz veins and cross-cutting magnetite rich graphitic chert horizons in mafic volcanic rocks. Although gold mineralization related alteration destroys magnetite, even the very high resolution aeromagnetics does not resolve these few metre wide alteration zones within the magnetic host rock. The most obvious magnetic lows cross cutting the area have been drill tested and they are related to earlier deformation and have been barren so far.
The posterior probabilities of the final prospectivity map are classified into four classes using the natural data breaks shown in Figure 4. The lowest probability class has an upper break at the prior probability value of 0.00005 and represents ‘very low’ Potential. According to the current modelling this area in the
probability map is defined as an area where the probability of finding gold is less than chance, whereas in the other areas in the map the probability is higher than chance. This ‘very low’ probability area covers about 77% of the total study area, whereas the area of highest potential covers only about 3 % of the total study area.
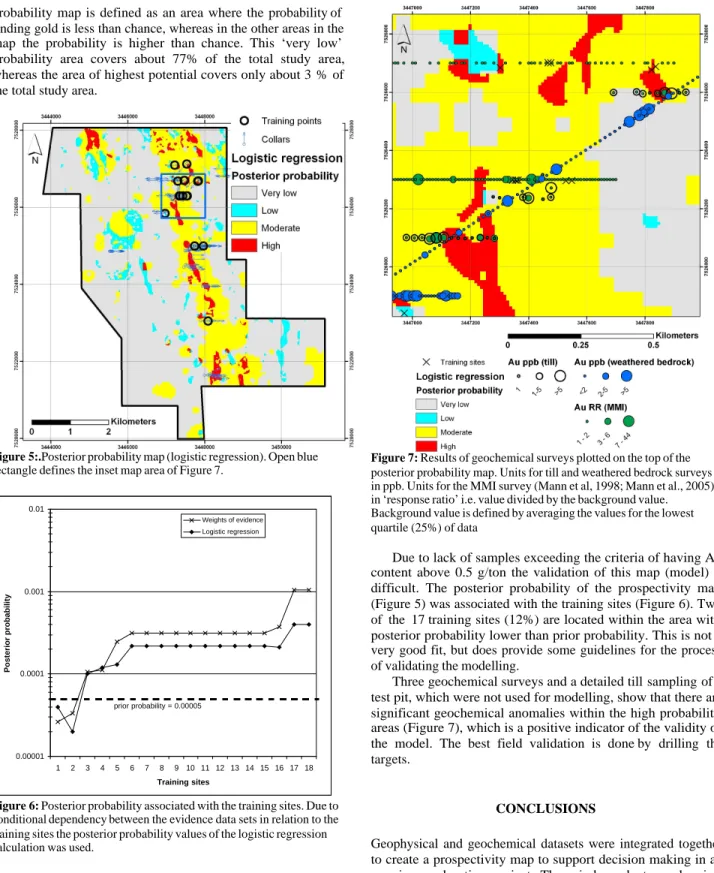
Figure 5:.Posterior probability map (logistic regression). Open blue rectangle defines the inset map area of Figure 7.
0.00001 0.0001 0.001 0.01 1 2 3 4 5 6 7 8 9 10 11 12 13 14 15 16 17 18 Training sites Posterior probability Weights of evidence Logistic regression prior probability = 0.00005
Figure 6: Posterior probability associated with the training sites. Due to conditional dependency between the evidence data sets in relation to the training sites the posterior probability values of the logistic regression calculation was used.
Figure 7: Results of geochemical surveys plotted on the top of the posterior probability map. Units for till and weathered bedrock surveys in ppb. Units for the MMI survey (Mann et al, 1998; Mann et al., 2005) in ‘response ratio’ i.e. value divided by the background value. Background value is defined by averaging the values for the lowest quartile (25%) of data
Due to lack of samples exceeding the criteria of having Au content above 0.5 g/ton the validation of this map (model) is difficult. The posterior probability of the prospectivity map (Figure 5) was associated with the training sites (Figure 6). Two of the 17 training sites (12%) are located within the area with posterior probability lower than prior probability. This is not a very good fit, but does provide some guidelines for the process of validating the modelling.
Three geochemical surveys and a detailed till sampling of a test pit, which were not used for modelling, show that there are significant geochemical anomalies within the high probability areas (Figure 7), which is a positive indicator of the validity of the model. The best field validation is done by drilling the targets.
CONCLUSIONS
Geophysical and geochemical datasets were integrated together to create a prospectivity map to support decision making in an ongoing exploration project. Three independent geochemical surveys were used to test the validity of the modelling.
This study shows that integration of high resolution data in a GIS using quantitative spatial modelling techniques can be used
to highlight potential new drilling targets at a prospect scale. However, since the spatial modelling techniques used are sensitive to training point selection and availability, the accuracy of the modelling can be randomly biased if the training set is not representative of the target mineralization. Therefore the exploration model has to be revised as more data is gathered and the model revised.
REFERENCES
Agterberg F.P., 1989, LOGDIA; Fortran 77 program for logistic regression with diagnostics; Statistical methods for resource appraisal; Proceedings of the NATO/ASI Conference. Computers & Geosciences 15, 599-614.
Agterberg F.P., Bonham-Carter G.F., Cheng Q. and Wright D.F., 1993, Weights of evidence modeling and weighted logistic regression for mineral potential mapping. In Davis J.C. and Herzfeld U.C. eds. Computers in Geology, 25 Years of Progress. Oxford University Press, Oxford, 13-32.
Airo, M.-L., 2002, Aeromagnetic and aeroradiometric response to hydrothermal alteration: Surveys in Geophysics, v. 23, p. 273– 302.
Airo, M.-L., ed., 2005, Aerogeophysics in Finland 1972-2004: Methods, system characteristics and applications. Geological Survey of Finland, Special Paper 39, 197 p.
Bonham-Carter, G.F., 1994, Geographic Information Systems for Geoscientists – Modelling with GIS. Computer Methods in the Geosciences 13. Pergamon Press, New York, 398 p
Carranza, E.J.M. and Hale, M., 2000, Geologically constrained probabilistic mapping of gold potential, Bauio District, Philippines. Natural Resources Research 9, 237-253.
Carranza, E.J.M. and Hale, M., 2001, Logistic regression for geologically constrained mapping of gold potential, Baguio district, Philippines. Exploration and Mining Geology 10, 165-175.
Carranza, E.J.M., 2004, Weights of evidence modeling of mineral potential: A case study using small number of prospects, Abra, Philippines. Natural Resources Research 13, 173-187.
Eilu P., 1999, FinGOLD –a public database on gold deposits in Finland. Geological Survey of Finland, Report of Investigation 146. 224 p. Harris, J.R. and Sanborn-Barrie, M., 2006, Mineral potential mapping: examples from the Red Lake Greenstone Belt, Northwest Ontario. In: Harris J.R. (Ed.) GIS for the Earth Sciences. Geological Association of Canada. Special Publication 44, 1-21.
Harris, J.R., Wilkinson, L and Grunsky, E.C., 2000, Effective use and interpretation of lithogeochemical data in regional mineral exploration programs: application of Geographic Information Systems (GIS) technology. Ore Geology Reviews 16, 107-143. Harris, J.R., Wilkinson, L., Heather, K., Fumerton, S., Bernier, M.A.,
Ayer, J. and Dahn, R., 2001. Application of GIS processing techniques for producing mineral prospectivity maps; a case study; mesothermal Au in the Swayze greenstone belt, Ontario, Canada. Natural Resources Research 10, 91-124.
Lehtonen M., Airo M-L., Eilu P., Hanski E., Kortelainen V., Lanne E., Manninen T., Rastas P., Räsänen J. and Virransalo P., 1998, The stratigraphy, petrology and geochemistry of the Kittilä greenstone
area, northern Finland. A report of the Lapland Volcanite Project. In Finnish with summary in English. Report of Investigation 140. Geological Survey of Finland. Espoo 1998.
Mann, A.W., Birrell, R.D., Mann, A.T., Humphreys, D.B. and Perdrix, J.L., 1998, Application of mobile metal ion technique to routine geochemical exploration. Journal of Geochemical Exploration, 61, 87-102.
Mann, A.W., Birrell, R.D., Fedikow, M.A.F. and de Souza, H.A.F., 2005, Vertical ionic migration: mechanisms, soil anomalies, and sampling depth for mineral exploration. Geochemistry: Exploration, Environment, Analysis, Vol. 5, 2005, pp. 201-210. Miller, H. G. and Singh, V., 1994, Potential field tilt—a new concept for
locationof potential field sources: Journal of Applied Geophysics, v. 32, 2–3, p. 213–217.
Naidu, P.S. and Mathew, M.P., 1998, Analysis of geophysical potential fields. A digital signal processing approach: Advances in exploration geophysics, Elsevier, 298 p.
Niskavaara, H., 1995, A comprehensive scheme of analysis of soils, sediments, humus and plant samples using inductively coupled plasma atomic emission spectrometry (ICP-AES). Geological Survey of Finland, Special Paper, 20, 167-175.
Nykänen VM, Groves DI, Ojala VJ and Gardoll S, (in press), Combined conceptual/empirical prospectivity mapping for orogenic gold in the Northern Fennoscandian Shield, Finland. Australian Journal of Earth Sciences, Thematic Is-sue on Conceptual Targeting. Nykänen, Vesa, Salmirinne, Heikki, Hyvönen, Eija, Hulkki, Helena, and
Airo, Meri-Liisa, 2005, Fuzzy logic spatial modelling as targeting tool for orogenic gold mineralization in the Central Lapland greenstone belt, Northern Fennoscandian Shield, using high-resolution multi-element airborne geophysical data, in Rhoden, H.N., Steininger, R.C., and Vikre, P.G., eds., Geological Society of Nevada Symposium 2005: Window to the World, Reno, Nevada, May 2005, 1159-1167.
Nykänen, VM and Salmirinne H, 2007, Prospectivity analysis of gold using regional geophysical and geochemical data from the Central Lapland Greenstone Belt, Finland In: Ojala VJ (ed.) Gold in the Central Lapland Greenstone Belt, Finland. Geological Survey of Finland, Special Paper 44, 235-253.
Paganelli, F., Richards, J.P. and Grunsky, E.C., 2002, Integration of structural, gravity, and magnetic data using the weights of evidence method as a tool for kimberlite exploration in the Buffalo Head Hills, Northern Central Alberta, Canada. Natural Resources Research 11, 219-236.
Peltoniemi, M., 1998, Depth penetration of frequency-domain airborne electromagnetics in resistive terrains: Exploration geophysics, v. 29, p. 12–15.
Raines, G.L. and Bonham-Carter, G.F., 2006, Exploratory spatial modelling: demonstration for Carlin-type deposits, central Nevada, USA, using Arc-SDM. In: Harris J.R. (Ed.) GIS for the Earth Sciences. Geological Association of Canada. Special Publication 44, 23-52.
Raines, G.L., Bonham-Carter, G.F. and Kemp L.D., 2000, Predictive probabilistic modelling using Arview GIS. ArcUser 3, 45-48. Raines, G.L. and Mihalasky M.J., 2002, A reconnaissance method for
delineation of tracts for regional-scale mineral-resource assessment based on geologic-map data. Natural Resources Research 11, 241-248.
Salminen R., ed., 1995, Geochemical mapping in Finland in 1982-1994. In Finnish with summary in English. Geological Survey of Finland, Report of Investigation 130, 47 p.
Verduzco, B., Fairhead, J. D., Green, C. G. and MacKenzie, C., 2004, New insight into magnetic derivatives for structural mapping: The Leading Edge, February 2004, p. 116–119.
Wright, D.F., Kerswill, J.A., Bonham-Carter, G.B. and Daneshfar, B., 2006. Mapping gold potential for the Yellowknife greenstonebelt EXTECH III study area using GIS-based analytical methods, in Anglin, C.D., Falck, H., Wright, D.F. and Ambrose, E.J., eds., Gold in the Yellowknife Greenstone Belt, Northwest Territories: Results of the EXTECH III Multidisciplinary Research Project: Special Publication 3, Geological Association of Canada, Mineral Deposits Division, 372-397.